Cryptocurrency Risk Appetite and the Surge in Global Liquidity
September 24, 2024
“Alt-season” refers to a phase when markets are overheated and investors are overconfident – such that smaller market cap, higher risk crypto investments become the assets of choice – causing eye-watering overvaluations amid an increase of greed, euphoria and complacency – usually followed by a major correction, or collapse.
This phase in the cryptocurrency market reflects the state of financial markets as a whole and is a useful indicator used to analyse the risk appetite of broader financial markets. As global liquidity continues to rise, and we embark upon a rate-cutting cycle in the U.S., we explore the question on many crypto investors’ minds – “Is Alt-season approaching?”.
Looking at Bitcoin we can note objective technical strength – it is currently well above the 50% of every sustained macro price movement since the market bottom.
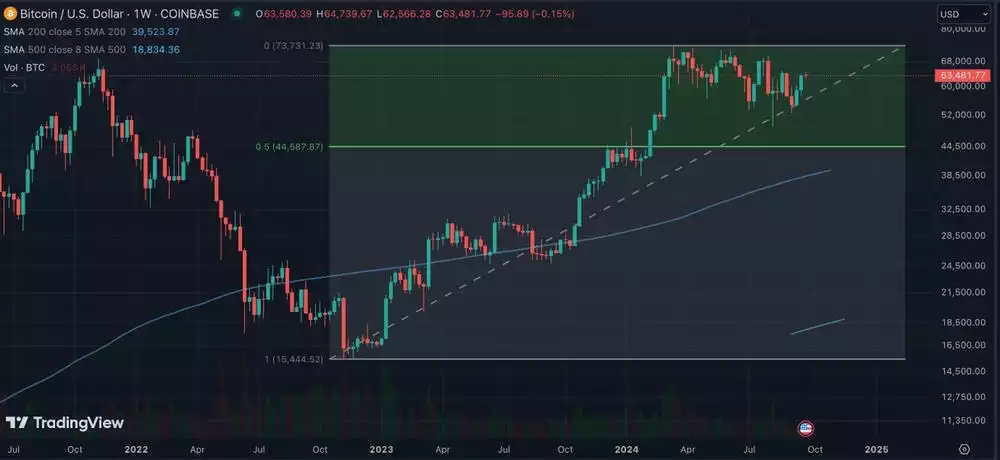
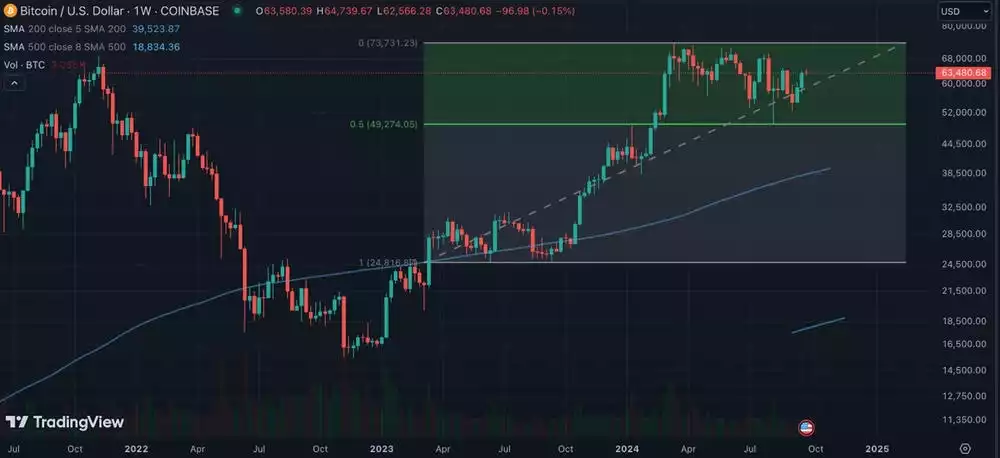
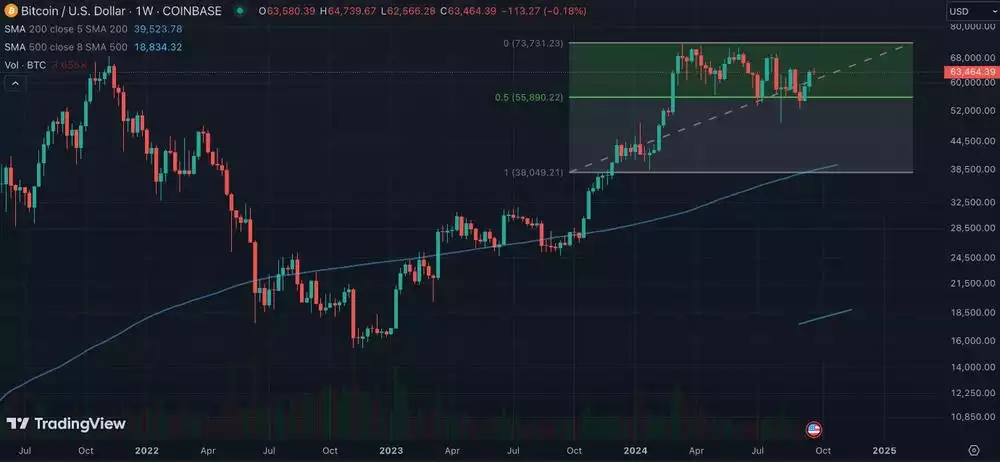
However, Bitcoin did something significant, and most people weren’t paying attention. It closed the week above US$61,500, the 50% level of our 6-month consolidation range. If Bitcoin continues to hold above this level for consecutive weekly closes – we could see the price increase exponentially, fast.
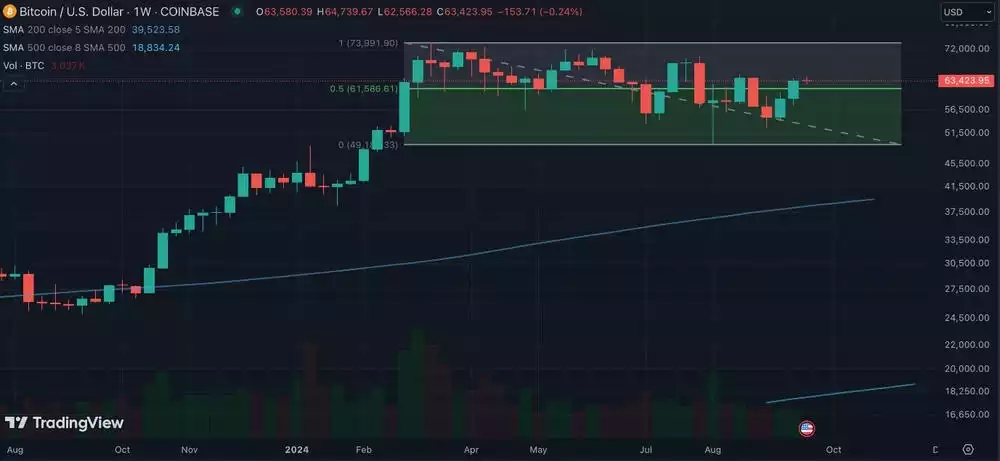
Bitcoin and the wall of worry – are we finally above it?
The “wall of worry” is a term used to describe the period in financial markets where price continues to ascend amid a variety of negative factors. While steadily climbing through significant fearful events, Bitcoin has recently put in a major low with the “yen carry trade” event – resulting in an ‘extreme fear’ sentiment, while printing a hammer candle with a long wick. It also recorded the highest volume over the last six months since it started consolidating after its peak in March of this year.
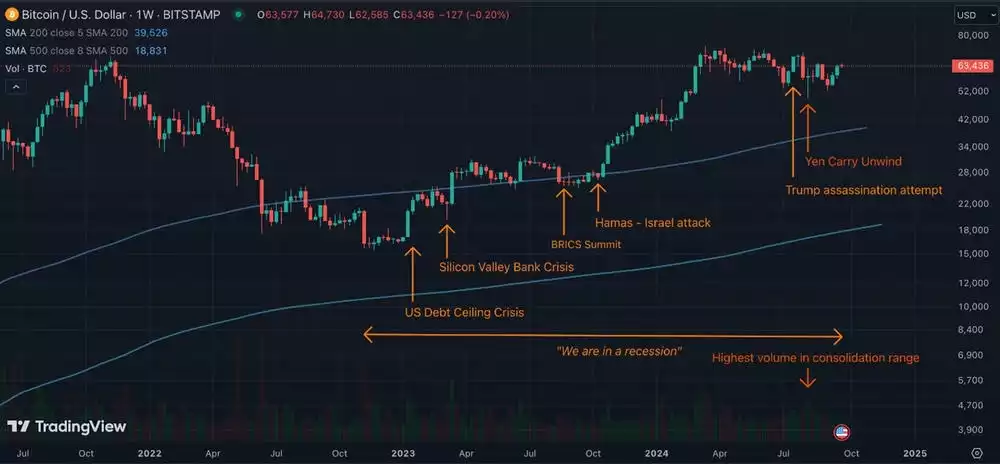
With Bitcoin consolidating around the peak of the previous bull run – it might be that the wall of worry is nearly behind us. Zooming out we are potentially at a bear trap phase of the macro uptrend, with sentiment being recorded as largely fearful for many months, amid technically bullish price action, the current market set-up has all the makings of a macro “bear trap”.

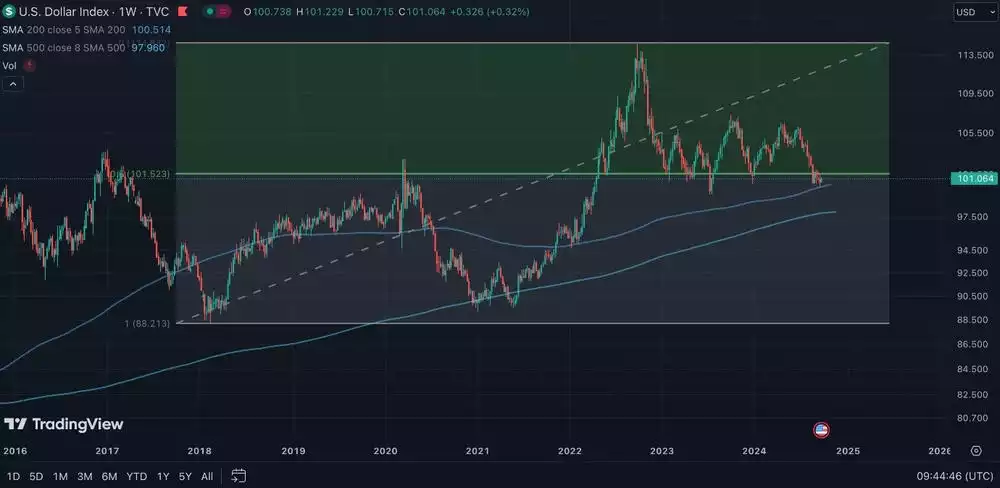
The DXY (U.S. Dollar Index)
The DXY currently sits heavy on its 50% level of the uptrend over the last six years, looking ready to break down – with four consecutive weekly closes below the 50% level of 101.5
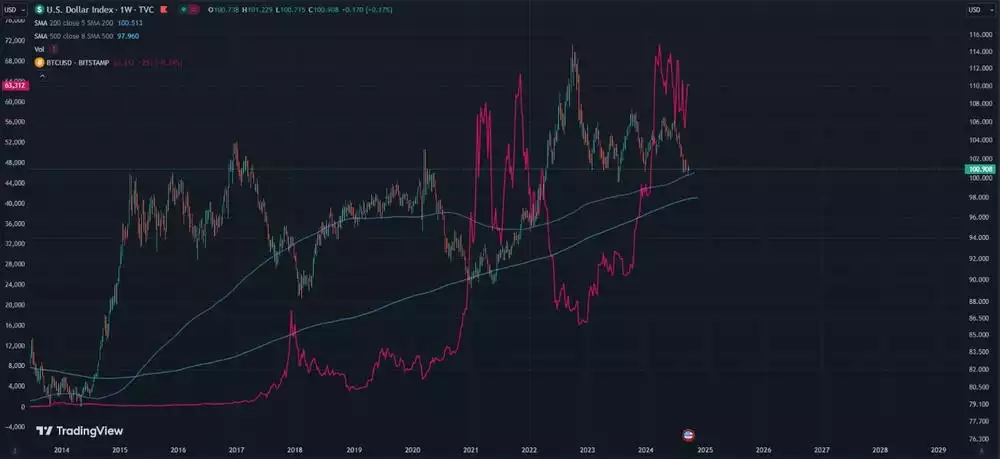
BTC vs DXY
Often the DXY and Bitcoin will move in opposite directions, this is because risk markets gaining strength usually coincides with a macroeconomic phase where the dollar is a less appealing
asset, often for a variety of reasons – including lower yield on dollar deposits (due to lower interest rates), and higher supply of dollars amid monetary expansion, reducing the value of individual currency units (resulting in asset inflation).
Global liquidity
Recently, we have seen a significant expansion in global liquidity, with an increase of US$66 billion, pushing the total figure into new record-high territory above US$174 trillion. This growth is driven by an 11% annualised growth rate over the past three months, with year-on-year liquidity rising by 5.6%. In nominal terms, liquidity has grown by US$4.62 trillion since late June, marking a substantial recovery from the lows seen earlier in the year.
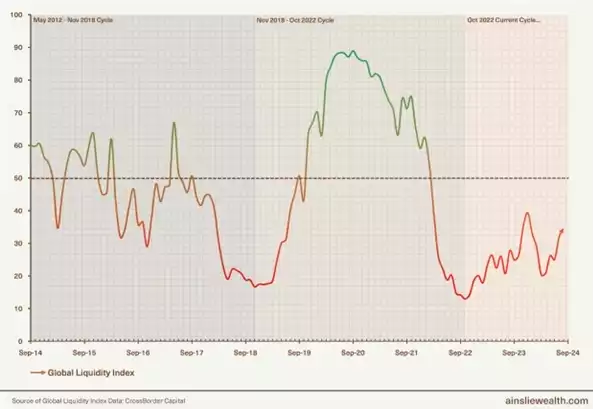
Are we entering a euphoric risk on period and the implications on crypto markets – Looking at Altcoins.
In macro price structure, after markets establish a top they form a macro lower high driven in an overly positive market sentiment, also known as a complacency bounce (This shows a clear divergence between technical price structure and market sentiment – with technical structure recording weakness, amid sentiment remaining positive).
Once the markets have collapsed from the complacency bounce and formed a macro low – they enter the accumulation phase of the next bull cycle. When the macro bull run starts – we see the price working its way up, out of this accumulation range.
The peak of the complacency bounce usually provides strong resistance – as this was the last time markets “felt good” the trading volume at these levels were quite high. Any participants who entered complacently are now able to exit the markets breaking even.
Breaking and holding above the complacency bounce level is a clear sign that the new macro bull run has legs, that the wall of worry has nearly ascended, and that some of the final sellers are being purchased from – the last major bears are being converted to bulls. Once this phase is completed, things can turn bullish, and fast – and prices can increase exponentially.
To understand how “risk on” the macro landscape is today, we can look at the low-cap investments of choice, for stock and crypto investors today – the Russell 2000 and Altcoins. The Russell 2000 Index is a small-cap stock market index that measures the performance of the 2,000 smaller companies from the Russell Index.
Total 2 is the total market cap of cryptocurrency, excluding bitcoin – it shows the cumulative price performance of altcoins in the crypto space.
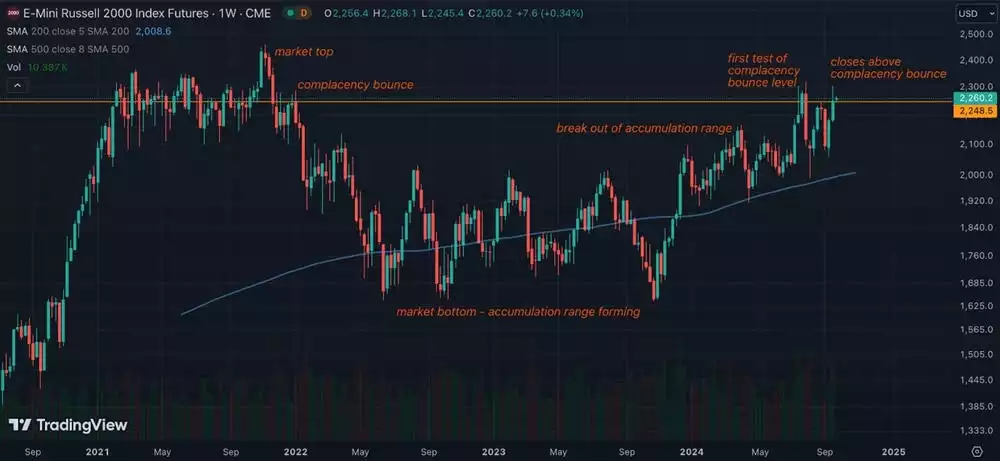

Russell 2000 and Total 2 – spot the difference.
Altcoin timing
Total 3 shows altcoins, excluding Ethereum – portraying the truly speculative participants.
The chart below marks the weeks from the market bottom for Total 3, comparing where we sit today, with the same time in the previous cycle – notice what came next.

Share this Article:
Crypto in your SMSF
Top Movers
Get Started Trading Crypto with Ainslie.
Join Thousands of satisfied customers who trust Ainslie for their cryptocurrency and bullion needs.


