Bitcoin – Objective Perspective, in a Chaotic World
August 15, 2024
It has been over 5 months since my neighbour asked me about Bitcoin. Over 5 months ago, on the 13th of March, Bitcoin broke US$73,000/BTC – reaching its all-time high – with most market participants seeing clear blue skies ahead. Since then, we have had World War III fears, attempted assassinations of U.S. presidential candidates, global cyber shutdowns, major stock index price “collapses”, and sentiment turning from imminent 6 figure calls – to many calling for the end of the bull market.
So how do we keep a clear and objective perspective of the markets, amid the global chaos?
The classic phrase “when in doubt, zoom out” rings true, now more than ever. Employing the KISS principle of “Keep It Simple and Straightforward” – we can combine basic technical and sentiment analysis – to help block out noise – and make investment decisions based on objective truths.
Part 1 – Technical analysis
William Delbert Gann, who started his trading career in 1902 developed technical analysis methods that have stood the test of time, still being used today, 120 years later. One of Gann’s famous rules is the 50% retracement rule, which states that – after an initial, sustained price move – prices retrace to 50% of that move. The application of this rule is – while an asset consolidates after a sustained move up, it can consolidate down to the 50% level of this run while maintaining an objectively bullish structure. Long-term price closes above this 50% level signalling objective strength in the macrostructure of the asset – with long-term price closes below this 50% level, signalling objective weakness. Keeping an eye on the 50% level, during long periods of consolidation, allows us to block out all the noise and focus purely on the big picture. While the world panics, we can calmly make investment decisions, in line with objective truth.
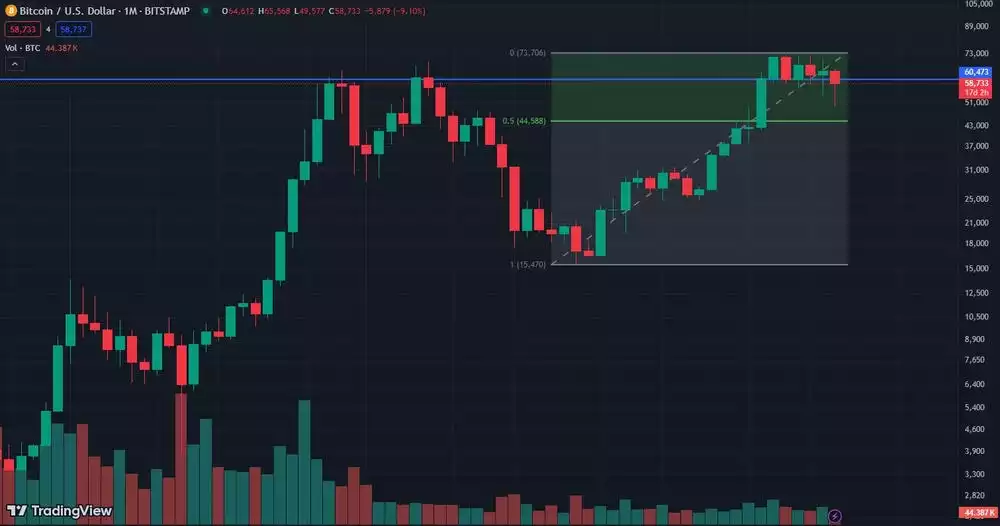
Zooming out to the monthly chart – Bitcoin had a sustained run from US$15,470 to US$73,706 – with its 50% level around US$44,588.

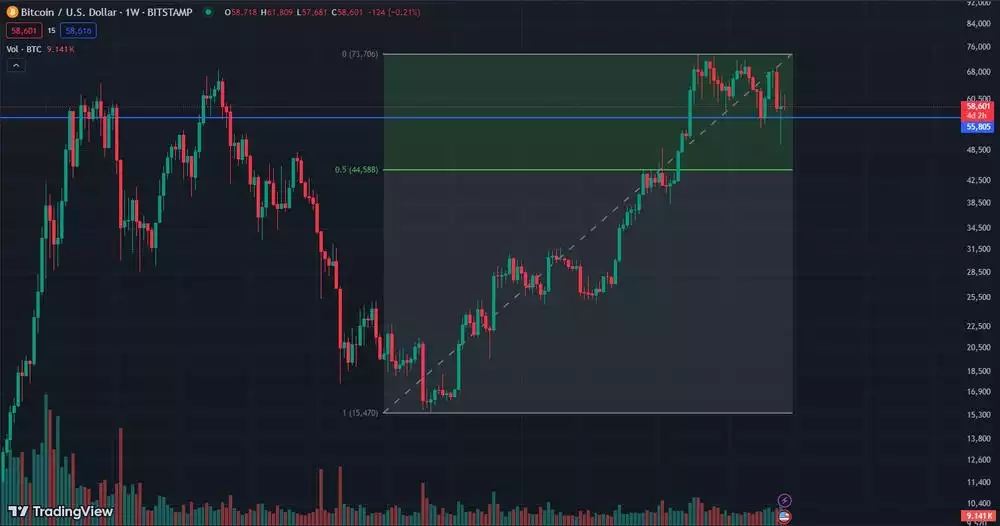
The lowest weekly close since BTC hit its all-time high, is on the 7th of July, at US$55,805. The lowest monthly close, is on the 30th of April, at US$60,473 (with the August candle still 2 weeks away from closing).

For all the doom and gloom, BTC is still well above its 50% level and has not closed a long-term candle anywhere near it. This shows incredible strength thus far – and leaves the chart with an objectively bullish structure, in the big picture. Additionally, we can determine that BTC could drop down to US$44,588 and would objectively change nothing about its macro-bullish structure (though one can only imagine the market sentiment if that were to occur). This leads into our next segment –
Part 2 – Sentiment analysis
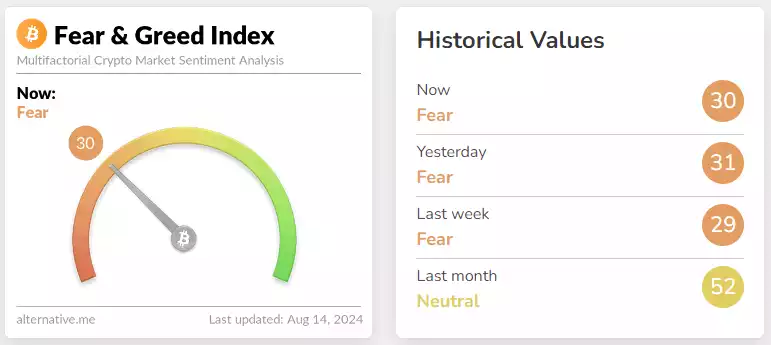
A second tool that helps form a balanced view of the markets is Sentiment analysis – using indicators like the fear and greed index, along with the broader chatter on platforms like X, we can gauge market sentiment. We know that at market tops – sentiment is generally euphoric and market participants are in mass consensus, with overwhelming confidence in the macro trend continuing – ignoring any signs to the contrary. With the fear and greed index, we can objectively see the market sentiment is currently sitting in fear – a far cry from the greed and euphoria usually seen at market tops.

Observing the chatter on X – it is also abundantly clear to see mixed views on which direction the market is headed, with many participants actively debating how much steam is left in this bull run’s engine.
Conclusion
The combination of – Bitcoin’s price currently being in an objective position of strength (from a technical analysis perspective), along with a prevalent market sentiment of fear, and the lack of consensus among participants – all of which have formed during Bitcoin’s price consolidation, over the past 5 months – further point to the bullish trend being intact. Combining technical analysis with sentiment analysis can be incredibly effective in determining bullishness or bearishness in markets – by looking at divergences between the two.
Observing positive sentiment (or greed) amid a weak technical structure – shows market bearishness; while observing negative sentiment (or fear), amid a strong technical structure shows market bullishness. The latter is exactly what can be seen playing out in real-time. While the world gets caught up in chaotic events, we can sit back, ignore the noise and stay objective in our investment decisions – by using simple analysis and zooming out, to see the bigger picture.
Share this Article:
Crypto in your SMSF
Top Movers
Get Started Trading Crypto with Ainslie.
Join Thousands of satisfied customers who trust Ainslie for their cryptocurrency and bullion needs.


