Bitcoin's ETF Era: Will It Follow Gold’s Market Cap Trajectory?
Posted on 03/10/2024 | 545 Views
With the recent approval of Bitcoin ETFs, many are drawing parallels between Bitcoin's market trajectory and that of gold when its ETF was launched in 2004. Similarities in institution-driven adoption, market inflows, and presently in Bitcoin, for instance, the forced liquidation related to the GrayScale court case, are eerily similar to the early days of the gold ETFs. This article explores how Bitcoin's market cap could follow the historical growth pattern of gold, using comparisons of market conditions, broad money supply percentages, and projections for 2030.
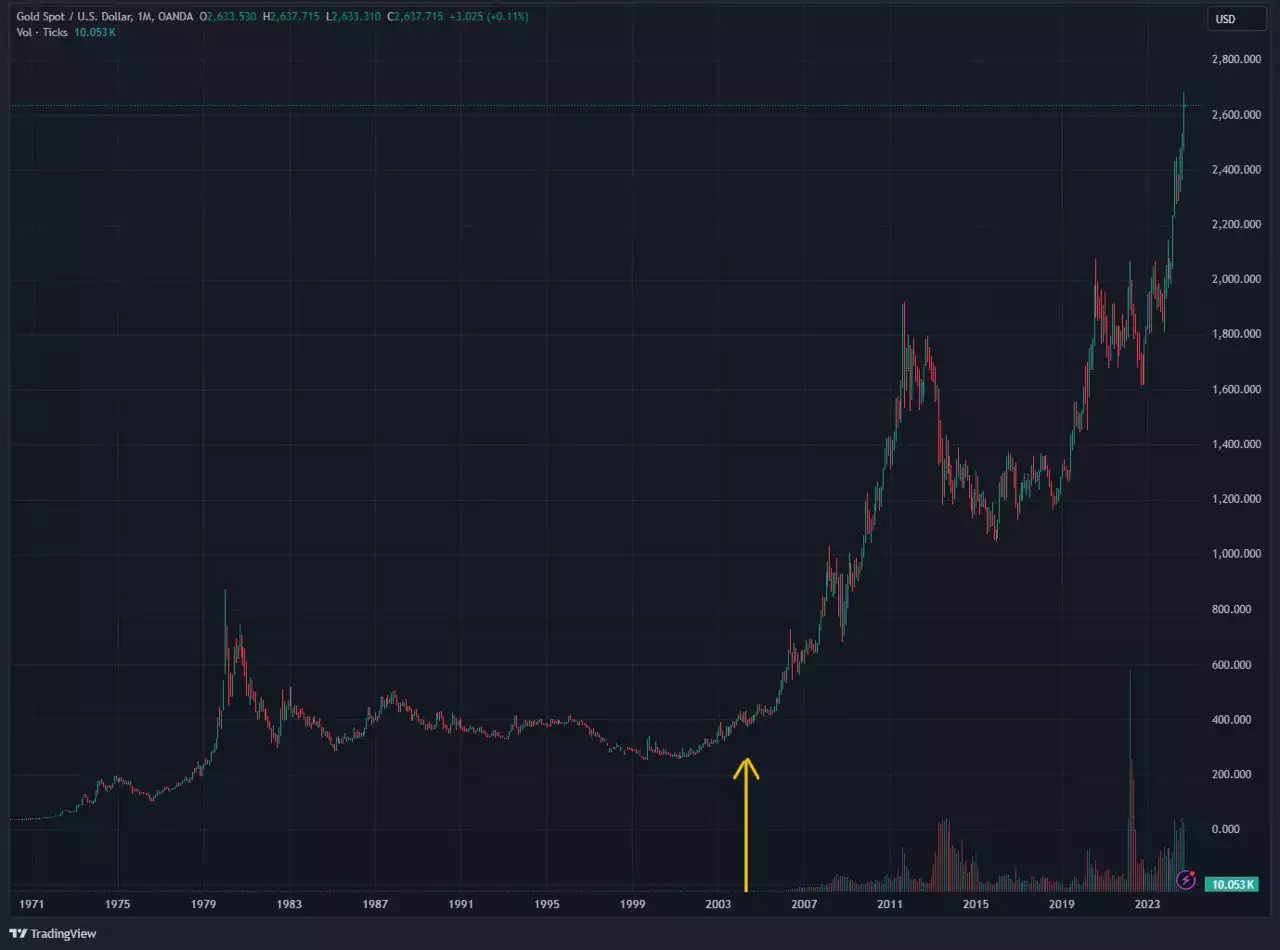
When the first gold ETF launched in 2004 (the SPDR Gold Shares), gold’s price was around US$400 per ounce, with a market cap hovering around US$1.6 trillion. At the time, this represented roughly 1.5% of the global broad money supply (M3). Over the next two decades, gold would have extreme institutional inflows, reaching a US$13 trillion market capitalisation in 2024 with its price over US$2,500 per ounce. Today, gold constitutes about 7-8% of global M3, solidly cementing its position as a global asset and a store of value.

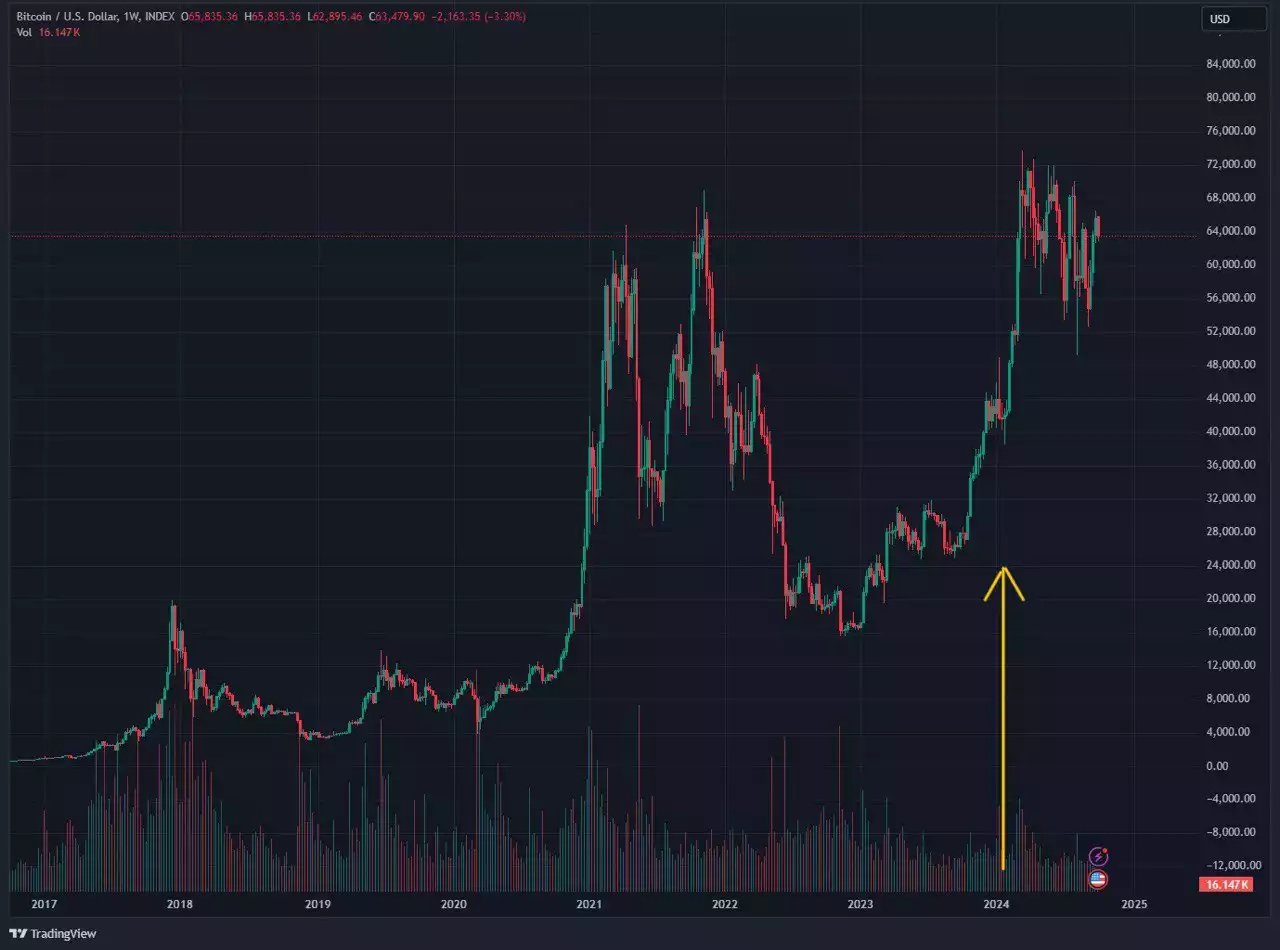
Zoom out! Gold Price since its ETF launched in 2004 – Could this “tiny cup shape” be what we see formed in the BTC price with its respective ETF launch this year?
This shift was driven by inflation hedging, geopolitical risks, and demand from central banks. Finally, the introduction of gold ETFs opened the door to easy access for institutional and retail investors alike, allowing gold to gain ground in its share of the global money supply.
Bitcoin, often referred to as "digital gold," is now entering a similar phase following its own ETF approval. With a market cap of US$1.2 trillion today, Bitcoin currently represents about 0.1% of the global broad money supply. Despite sell pressure from Grayscale’s court-mandated liquidation of GBTC shares—part of its transition away from the trust model—demand for Bitcoin ETFs has been robust, hinting at significant potential for inflows as more investors gain exposure through traditional financial instruments.

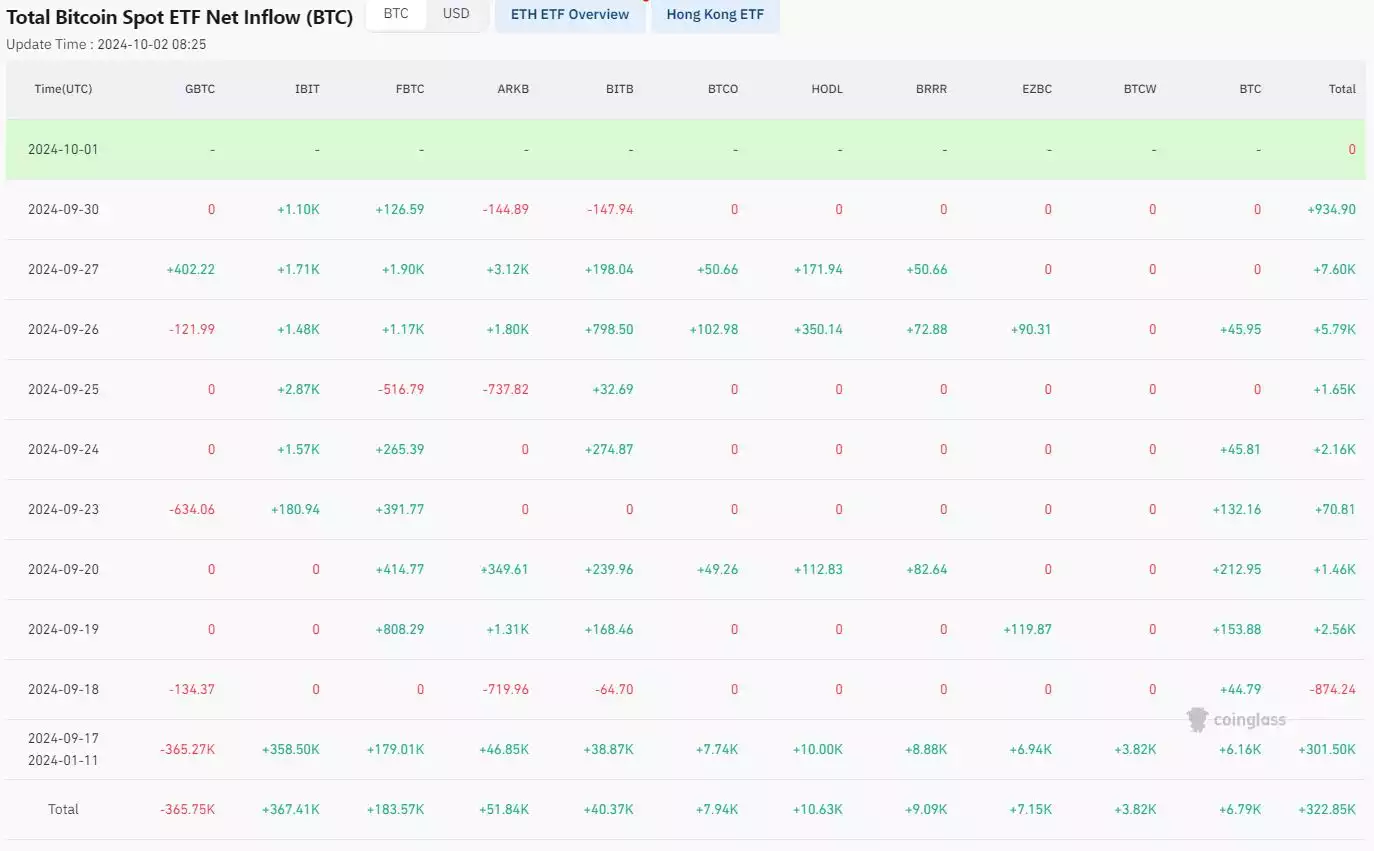
This situation mirrors the early days of gold ETFs, where initial selloffs were followed by a period of rapid market cap expansion as the asset matured and institutional adoption grew which can be seen by the total Bitcoin spot ETF net inflows.

Source: CoinGlass
You’ll notice the Greyscale GBTC column and its net outflows. Grayscale is currently liquidating a significant amount of Bitcoin from its Grayscale Bitcoin Trust (GBTC) for several reasons which should resolve itself over time:
- Bankruptcy and Creditors Repayment: One major driver is the bankruptcy of Genesis Global, a crypto lender that held about 36 million GBTC shares. Genesis is liquidating these shares to repay creditors, following court approval to sell around US$1.3 billion worth of assets, including GBTC shares. The liquidation is part of broader efforts to resolve debts tied to the collapse of crypto firms like Three Arrows Capital.
- Conversion to Spot Bitcoin ETF: Grayscale recently converted its GBTC to a spot Bitcoin ETF. This conversion created opportunities for long-term GBTC investors to realise profits. Most investors who purchased GBTC shares at huge discounts during the bear market are now selling to take advantage of the recent price recovery.
- Competition from Lower-Cost ETFs: Grayscale faces an increasing presence of new Bitcoin ETF entrants much cheaper than Grayscale's management fee. While GBTC charges a fee of 1.5%, the newer ETFs for competitors like BlackRock charge lower fees; some investors have already transferred their GBTC positions to capture the more inexpensive alternatives.
Set against compelling creditor repayments, profit-taking, and competitive pressures, this combination tends to drive the selloff, which may be somewhat mitigated by such other factors as high demand from competing ETFs.
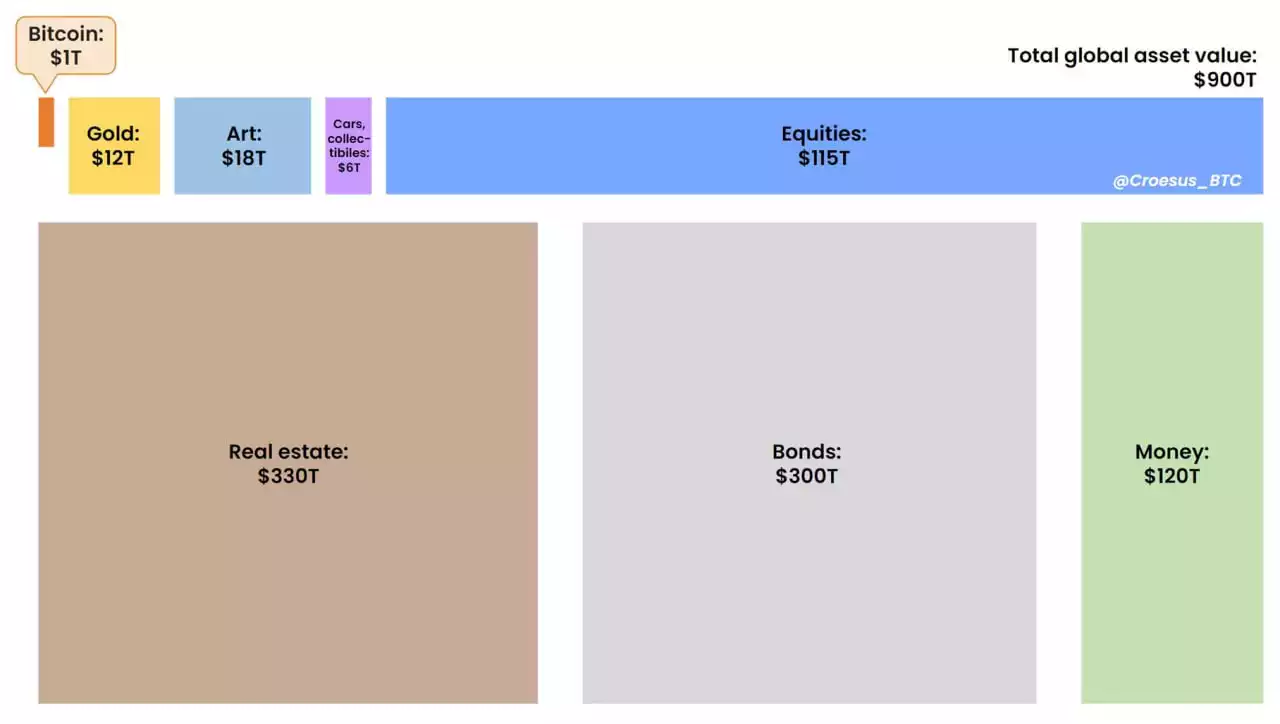
To gauge Bitcoin’s potential, we can look at projections for both its market cap and global broad money supply. Because of inflation, monetary expansion, and gross domestic product gain, global broad money supply is expected to be over US$200 trillion by 2030. The combined supply of Bitcoin to be mined and already mined could, in coordination, reach a market capitalisation between US$9 trillion to US$20 trillion, assuming a price ranging between US$500,000 to US$1 million per coin.
If these projections hold, Bitcoin could constitute 4.5-10% of the global broad money supply by 2030, closely following a path mirrored by gold. In such a bullish scenario where Bitcoin sees widespread adoption as a global reserve asset or store of value, it could increase the share to 5-15% and rival the position of gold as a percentage of M3 today.

Source: x.com/Croesus_BTC
Several factors could accelerate Bitcoin's growth, mirroring the bullish drivers behind gold’s rise:
- Institutional Inflows via ETFs: Just as gold ETFs opened institutional demand, so too will Bitcoin ETFs. From BlackRock to Fidelity, the largest financial institutions in the world are launching a Bitcoin ETF that will provide a conduit for trillions of dollars in capital into the market.
- Inflation and Monetary Policy: Like gold, Bitcoin benefits from the fear of inflation and lax monetary policy. The expectation that the Federal Reserve will further cut interest rates is a promise that Bitcoin will continue to gain traction as a hedge against inflation and currency devaluation.
- Digital Reserve Potential: In the future, the maturity of Bitcoin as an internationally recognised reserve asset might attract central banks to buy it, as in the case of gold reserves. This would substantially increase the money supply share.
- Scarcity and Limited Supply: Unlike gold, Bitcoin has a capped supply of 21 million coins, and hence higher prices could result in increased demand. This inherent scarcity is thus one of the key differentiators that may drive its market cap upward faster than that of gold historically.
While Bitcoin’s market dynamics are unique, the comparison to gold’s post-ETF growth provides a useful framework for understanding where it could be headed. With institutional adoption accelerating via ETFs and with a potential hedge against inflation, the next decade could see Bitcoin take something of a similar trajectory to that of gold.
Further adoption and, finally, a clear and transparent regulatory environment will help Bitcoin cement its role as a digital alternative to gold in the global financial system.