Bitcoin Report – June 2025
Posted on 19/06/2025 | 1753 Views
Today our Independent Research Analyst, Isaac Ho from the Ainslie Research Team brings you the latest monthly deep dive specifically on Bitcoin – including market analysis, on-chain metrics, sentiment, and technical analysis. He highlights some of the key charts that were discussed and analysed by our expert panel in the latest Beyond the Block episode and expands upon his work with some additional insights. We encourage you to watch the video of the original presentation if you haven’t already.
MVRV
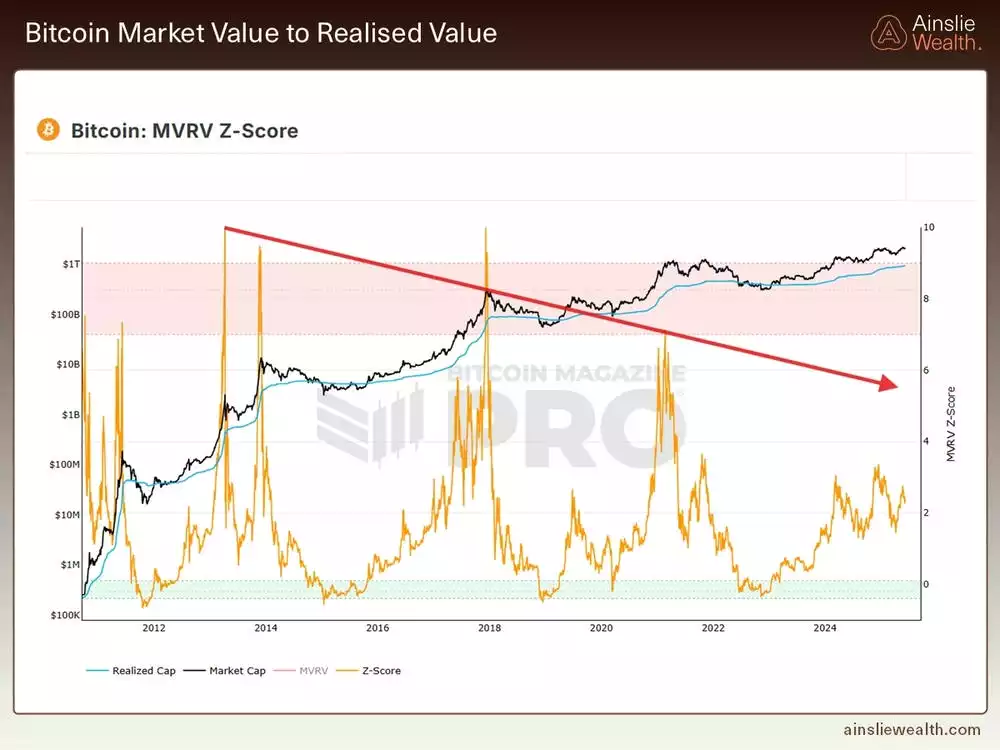
When examining the MVRV Z-Score, it’s clear we’re not seeing the explosive peaks that characterised previous bull markets. The metric remains relatively subdued, which aligns with what many are observing on the ground — this cycle appears to be led more by institutional capital than by euphoric retail speculation.
Unlike past cycles where retail-driven mania sent the Z-Score soaring into overextended territory, the current move has been more measured. The steady, staircase-like price action is reflected in a gradually rising realised cap, which in turn tempers the MVRV Z-Score.
This indicator is less about calling tops and more about gauging the broader emotional and capital positioning of the market. And right now, it’s signalling restraint, not mania. With retail still largely on the sidelines — as seen in other behavioural and flow metrics. The MVRV Z-Score suggests there’s room to run before things get overheated.\
Fear and Greed
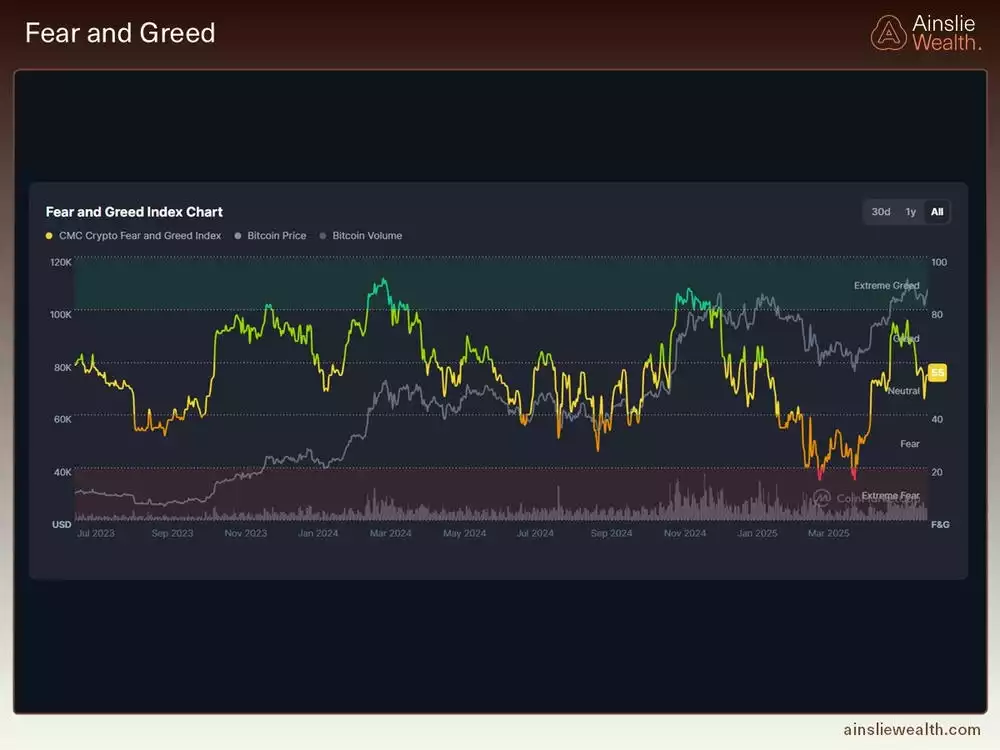
Sentiment continues to drag — not collapse — which is telling. Despite persistent global tensions and mounting geopolitical risk, Bitcoin’s price action has remained impressively resilient. That alone is a signal of underlying strength.
The Fear & Greed Index has proven its worth yet again. Just weeks ago, we were in “Extreme Fear” territory — a historically reliable contrarian signal. Market sentiment was deeply bearish, but the data suggested otherwise. Since then, price has moved sharply higher, even as the index has climbed back to neutral levels.
We’re now hovering in the high 40s — a far cry from euphoria, but a noticeable shift from panic. What’s notable here isn’t just the rebound, but the pace of that sentiment shift. Rapid swings in emotion often signal fragility, so while we’re not in “Greed” just yet, the quick recovery could bring choppy price action or even short-term pullbacks.
FOMO Finder
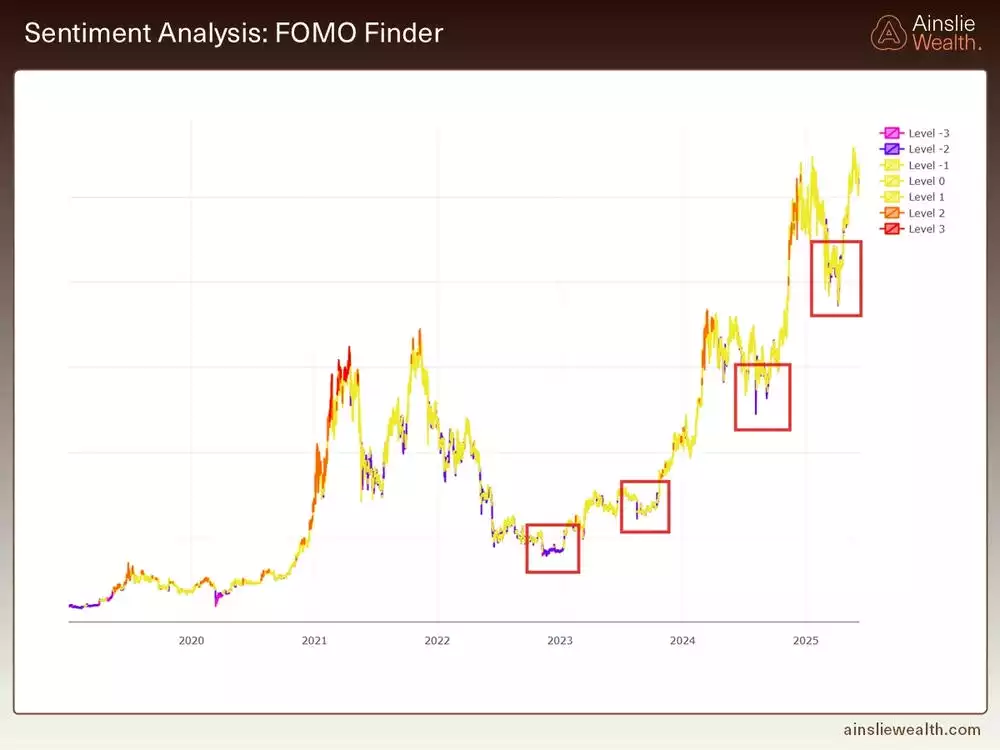
The FOMO Finder continues to demonstrate a consistent weekly cycle pattern.
We’ve observed that the appearance of fear signals—highlighted in purple—often aligns with significant technical and cyclical market lows. Most recently, a sharp market dip triggered widespread liquidations and fear, followed by a strong reversal—precisely the type of behaviour we want to see at key inflection points.
Now, the indicator has moved back into the yellow zone, signalling a reduction in fear but not yet reaching euphoric (greed-driven) levels. While not a stand-alone tool, the FOMO Finder serves best as a confirmation signal when it aligns with broader market indicators—and lately, it's been spot on.
Google Trends
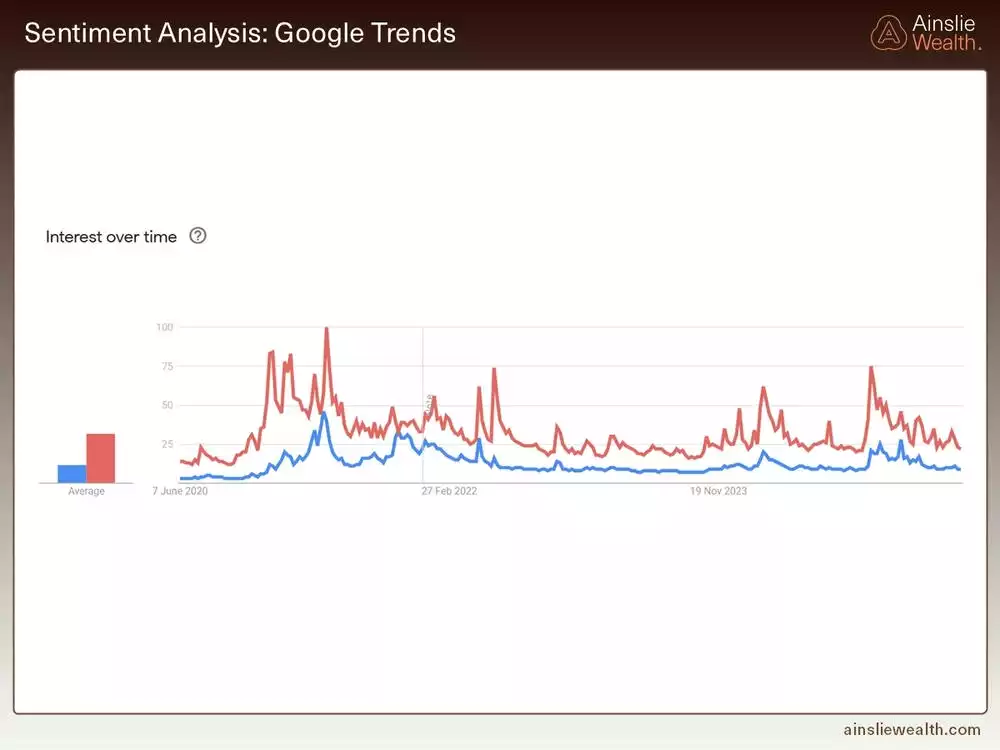
Google Trends paints a clear picture — retail interest is still absent.
Despite Bitcoin approaching all-time highs, search volume for "Bitcoin" continues to decline. There was a brief spike last November tied to the Trump news cycle, but it quickly faded. This reinforces what many in the space have sensed: the current rally is still largely driven by institutions. The public is aware of crypto, but the hype hasn’t returned yet—and that lack of retail frenzy suggests there's still plenty of upside potential.
Funding Rates
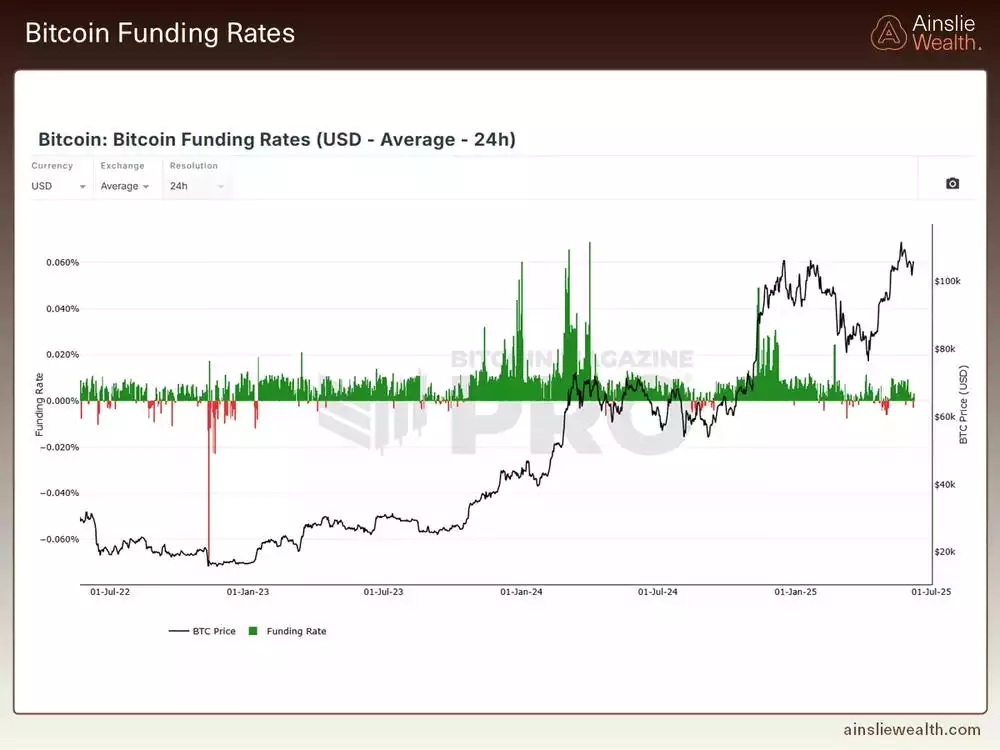
Funding rates are currently signalling indecision. After dipping negative near the recent lows — often a reliable indicator of a long setup — we saw a strong upside reaction. But now, with rates turning mildly positive, the conviction seems to be fading.
We’re not seeing the kind of aggressive long positioning that typically precedes sharp corrections, nor are we witnessing the kind of panic-driven shorting that fuels major rallies. Instead, we’re likely in what could be described as a chop zone — a period of consolidation marked by balanced positioning and indecisive flows.
Historically, Bitcoin hasn’t stayed in this kind of low-volatility environment for long. It tends to be a calm before the storm. While direction isn’t guaranteed, the broader trend and macrostructure suggest the next significant move is more likely up than down. It’s a waiting game — and this kind of tension usually resolves with momentum.
Macrocycles
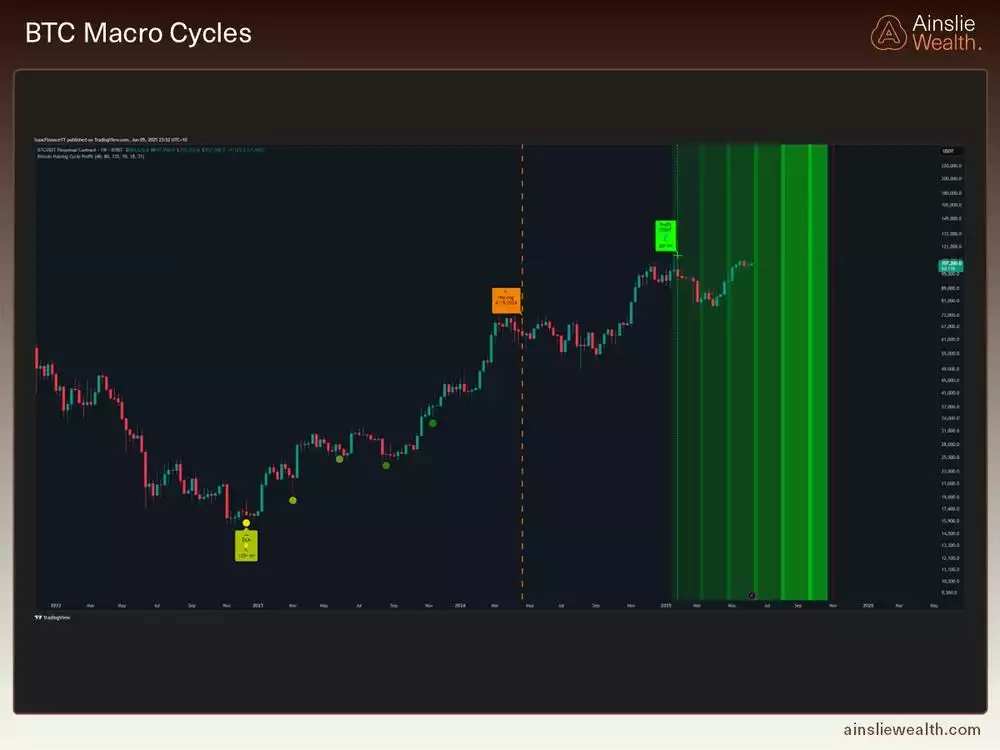
From a broader macro standpoint, we’re likely still in the mid-cycle expansion phase. Liquidity has been increasing, though at a gradual pace, which generally supports higher asset prices. However, there's currently a disconnect — Bitcoin's price has outpaced what liquidity levels would typically warrant. In March, conditions were much more aligned: liquidity was rising, technical indicators were strong, and market sentiment was cautious — an ideal setup. Today, the price appears to have run ahead of liquidity, introducing some caution into the picture. While the medium- to long-term outlook remains largely constructive, our current level of conviction is somewhat reduced compared to last month.
Weekly Cycles
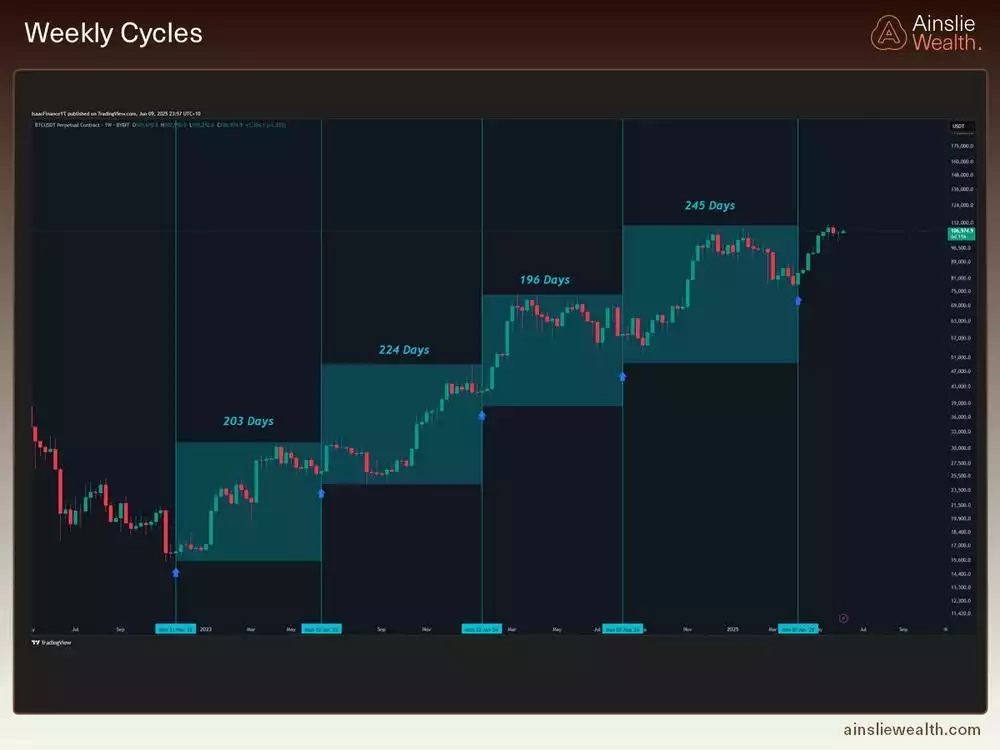
Weekly cycles look a little extended, with the Stochastic RSI flattening near its upper bound — a level that has historically signalled rising volatility. We've encountered similar setups in the past: while prices can continue to climb, maintaining momentum tends to get more difficult. This cycle has unfolded with impressive consistency in terms of timing, and we now find ourselves back in a zone of uncertainty. A period of consolidation or a healthy pullback to reset the trend wouldn’t come as a surprise.
Daily Cycles
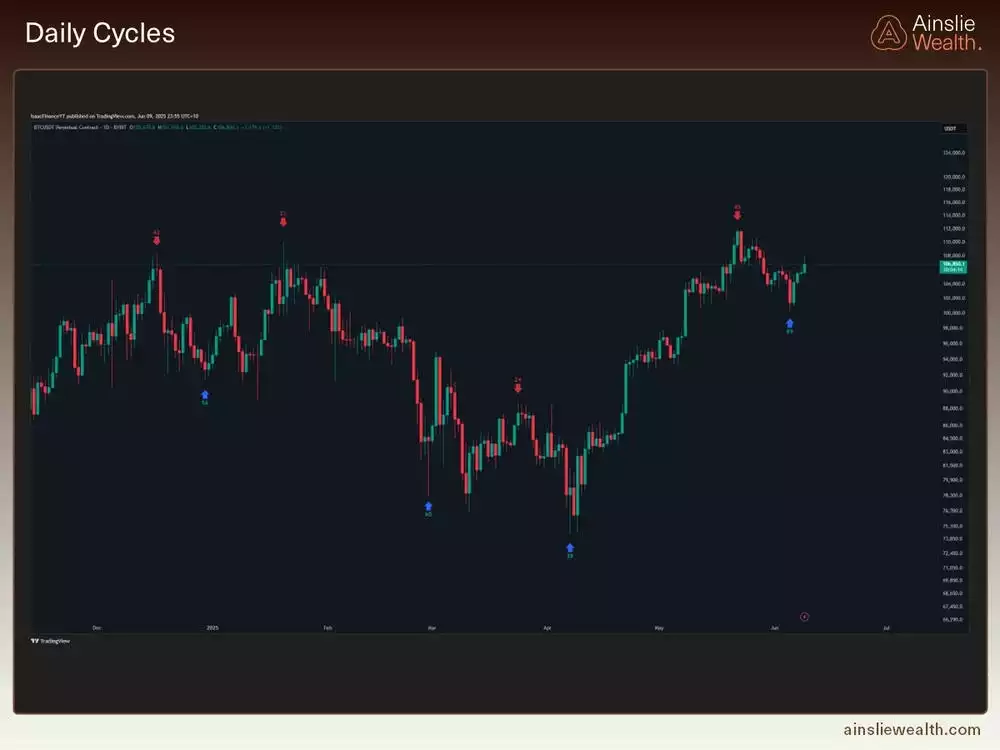
Daily cycles indicate we're positioned to take off from the most recent time zone, but price action is currently signalling more sideways movement and potential liquidation wicks. This aligns with the backdrop of ongoing geopolitical tensions. Should we see any relief on that front, a significant move higher wouldn’t be surprising — much of the uncertainty appears to be priced in already, and the underlying strength in the market remains evident.
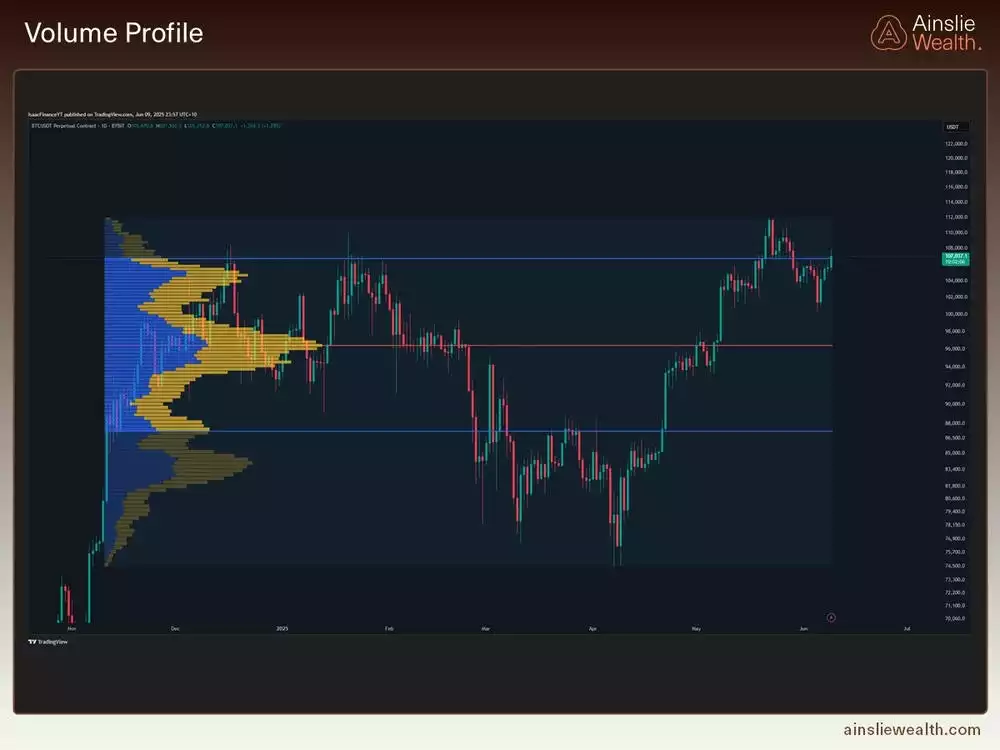
Volume Profile
From a volume perspective, the price is currently hovering just below the value area high of the range. Until we see a decisive break and close above that level, I expect continued choppy price action in both directions. Local movement remains highly reactive to global events, adding a layer of instability to the current environment.
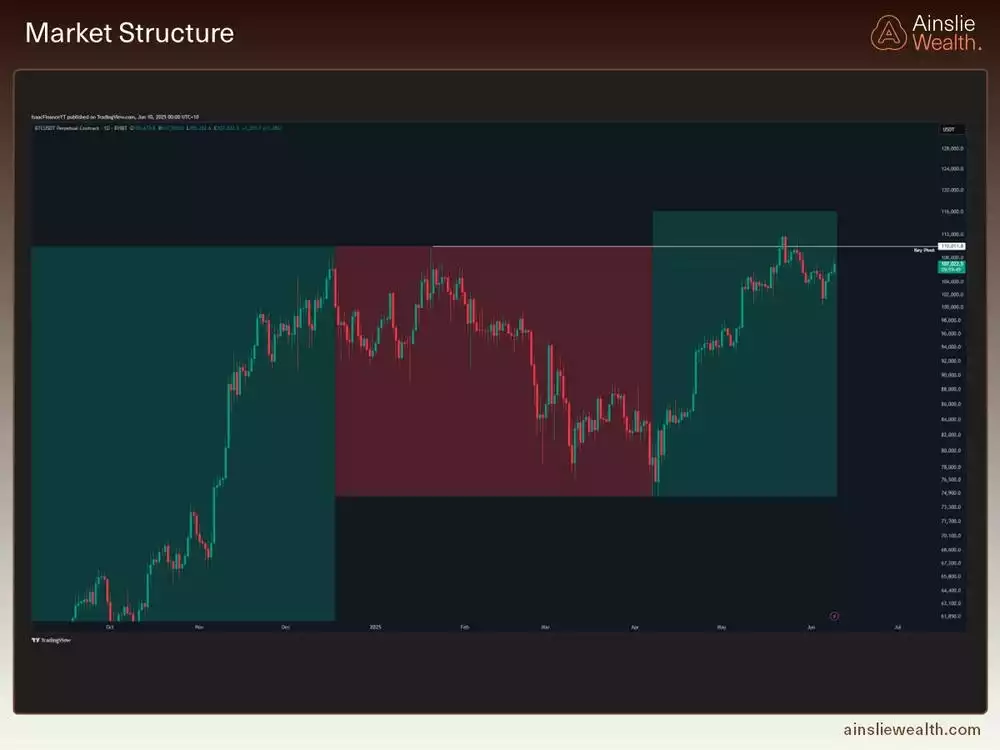
Market Structure
On the local timeframe, the market structure has turned bullish, with a series of higher highs and higher lows — a constructive sign. The key question now is whether that structure can hold. A break below the recent swing low would quickly shift the picture. For the moment, the setup seems to favour consolidation — potentially forming a higher low — rather than an immediate continuation of the uptrend. A period of confirmation would be prudent before taking a more aggressive position.
Watch the most recent video presentation of Bitcoin Analysis: Beyond the Block where we share some of these explanations in a panel format, and join the discussion on our YouTube Channel here:
We will return with a more detailed analysis of everything Bitcoin next month, including more market analysis, on-chain metrics, sentiment, and technical analysis.
Isaac Ho
Independent Research Analyst
The Ainslie Group
x.com/IsaacsDevCorner