Bitcoin Report – July 2024
July 23, 2024
Today our Independent Research Analyst, Isaac Ho from the Ainslie Research Team, brings you the latest monthly deep dive specifically on Bitcoin – including market analysis, on-chain metrics, sentiment, and technical analysis. He highlights some of the key charts that were discussed and analysed by our expert panel in the latest Beyond the Block episode, but also expands upon his work with some additional insights. We encourage you to watch the video of the original presentation if you haven’t already.
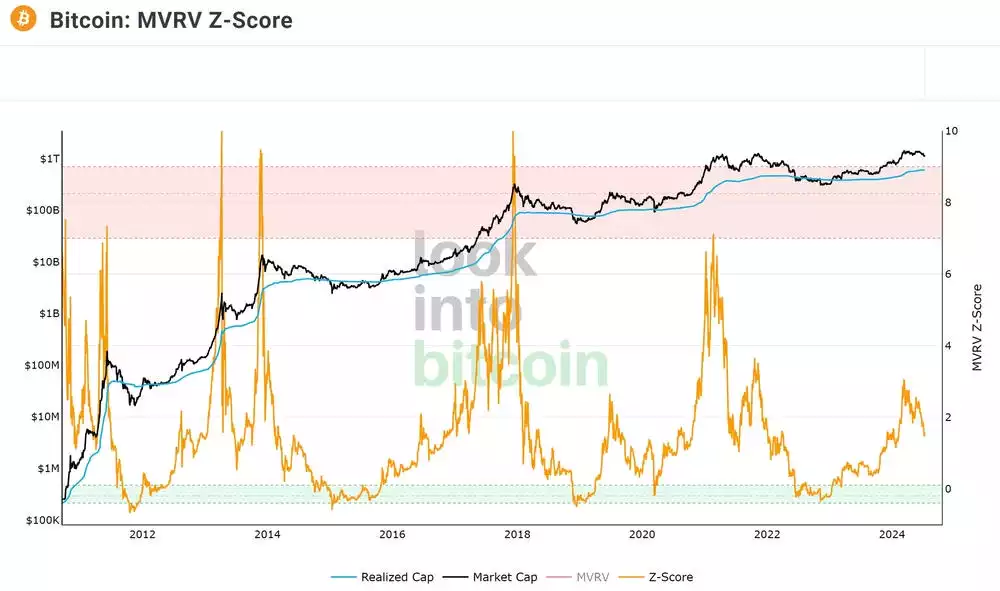
Following last month’s update we saw a significant sell-off which was primarily caused by the Germany and Mt Gox sell-off and the market pricing it in. This resulted in a large drop in the MVRV Z score, resetting the sentiment and setting up a strong base going into the next few months. Time wise we are still tracking in line with the previous cycles, in fact a reduction in the MVRV is typically what is seen post halving coming into the latter stage of the bull cycle.
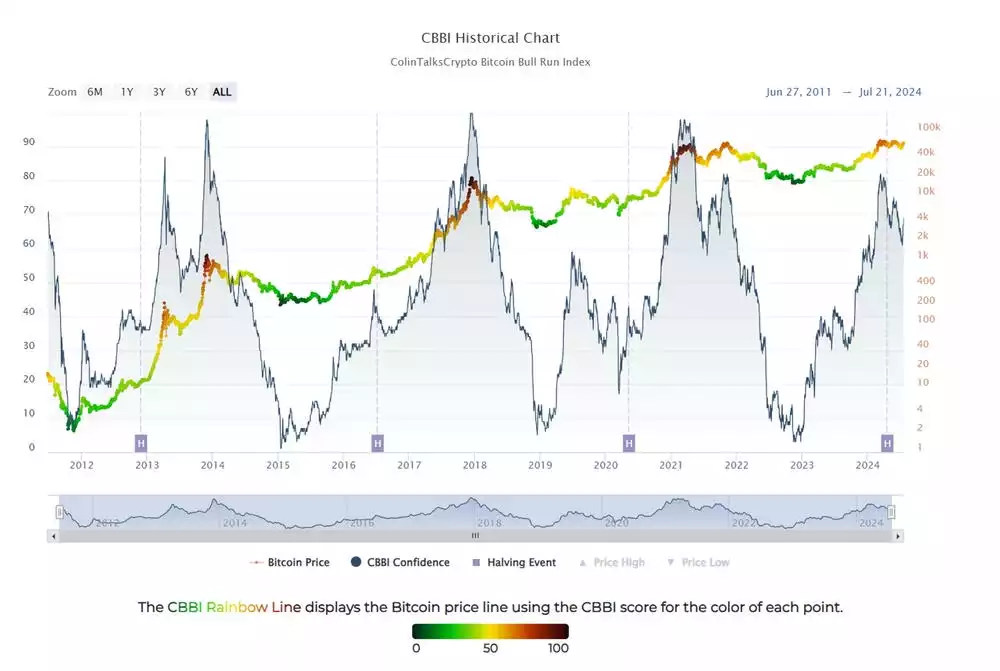
The combination chart indicates that we are currently in a consolidative market with price staying at relative levels the past few months. With a current CBBI score of 69 this is pointing to higher prices coming as you typically expect to see numbers in the 90 range to have a good chance of the cycle top being in. One thing to note in relation to time is that we still have around another year if the bull market acts like previous cycles, which we tend to believe it should do based on the macro analysis covered in the Beyond The Block episodes and Macro and Global Liquidity Analysis updates.
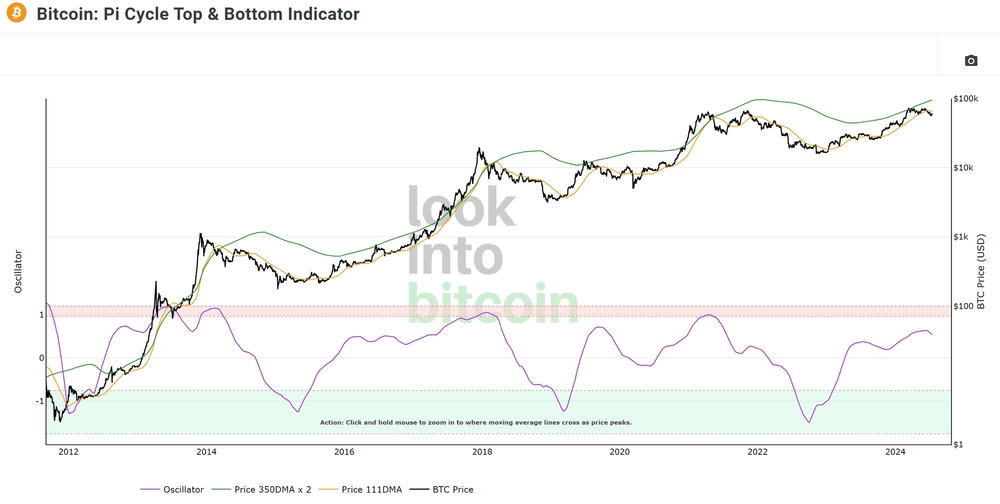
Nothing new on the Pi Cycle metric, we are just expecting the two DMA’s to cross coming in the latter months which has happened in every bull cycle. However, if the other metrics are showing weakness, then we will re-evaluate the expectations for this indicator.
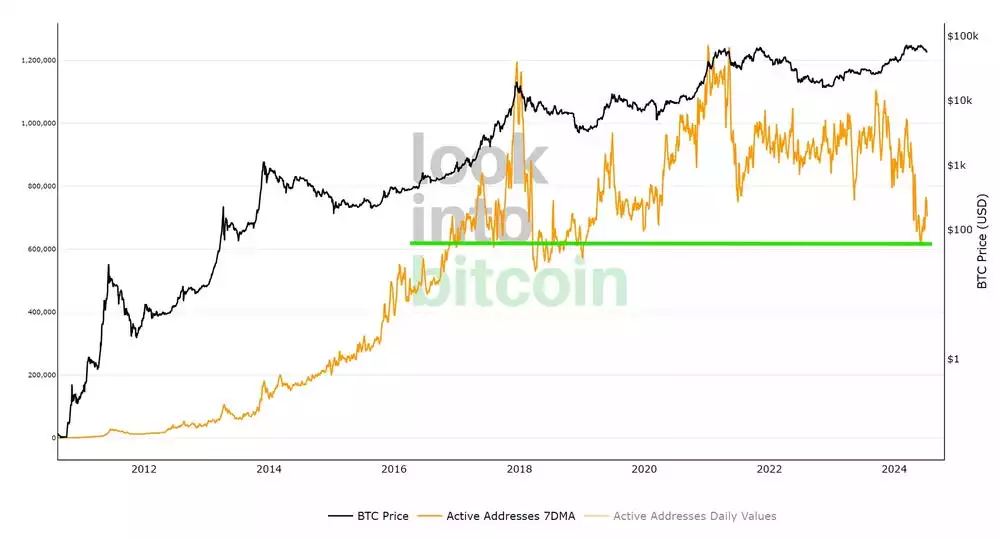
Active addresses have formed a local bottom with an increase coming in recently fuelled by the fear within the market. This is a very bullish sign as typically the bottom of active addresses forms when the low is in for Bitcoin, relative to what phase of the cycle we are in. Bottoming into capitulation and fear is very good to wash out weak hands.
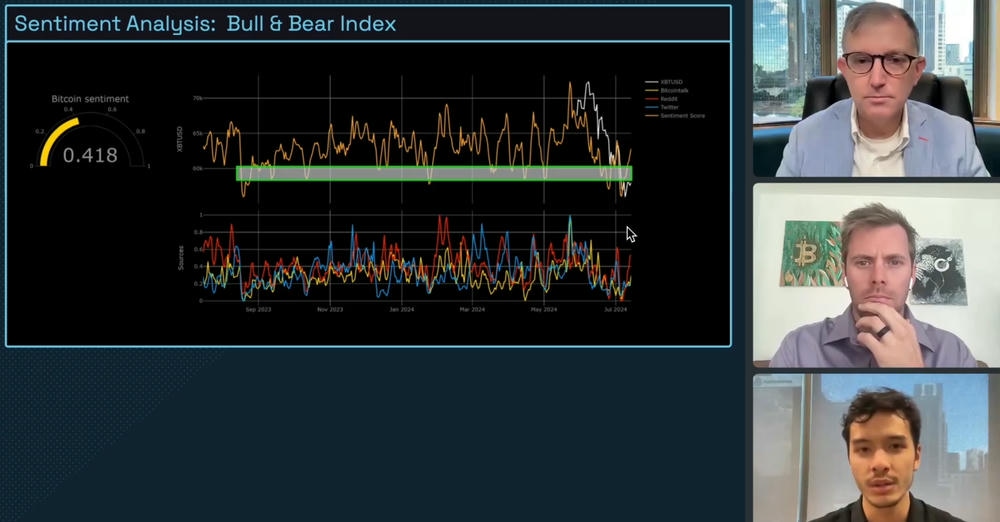
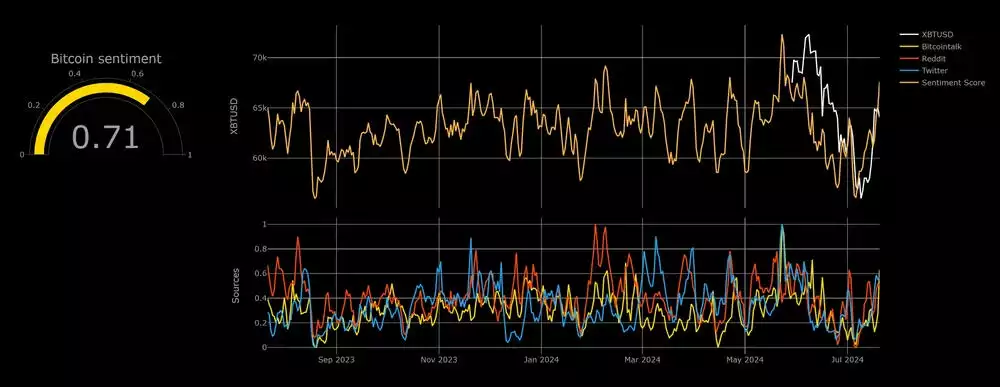
Regarding short term sentiment, in the video we spoke about how we had a capitulation event which triggered a large sell-off resetting sentiment levels. Since then, we have seen a significant reversal with price back up to US$67k which is the volume node of the channel. As we know sentiment moves in quite a cyclical pattern it is becoming clear that we are reaching a little bit of local exhaustion, however we still have a lot of potential for the price to climb to US$72k, which has been a target since the last update. Either way, once again the sentiment proves king, and adopting a counter trader mindset is the best way to take optimal advantage of the retail sentiment and its relationship to price.
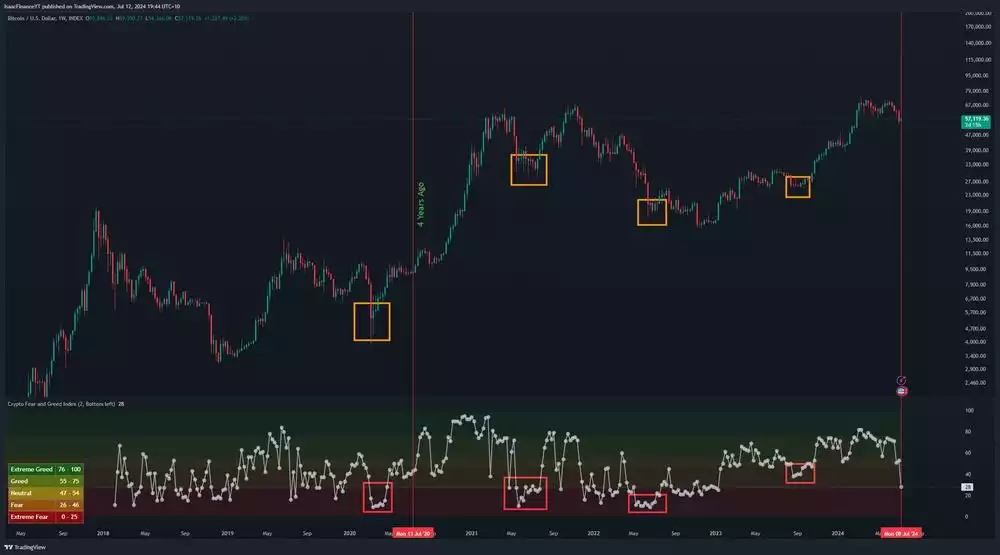
Shifting to the more macro sentiment, a large flush to the 20th percentile on the index occurred during the Germany and Mt Gox sell-off. This happening whilst going into a 60-day cycle low primed the market for a perfect setup. As you can see, when the sentiment index reaches such lows, the market tends to have large Macro reversals seeing a significant move higher. This time 4 years ago (the last cycle) you can see the index also saw a reduction before a large rise.
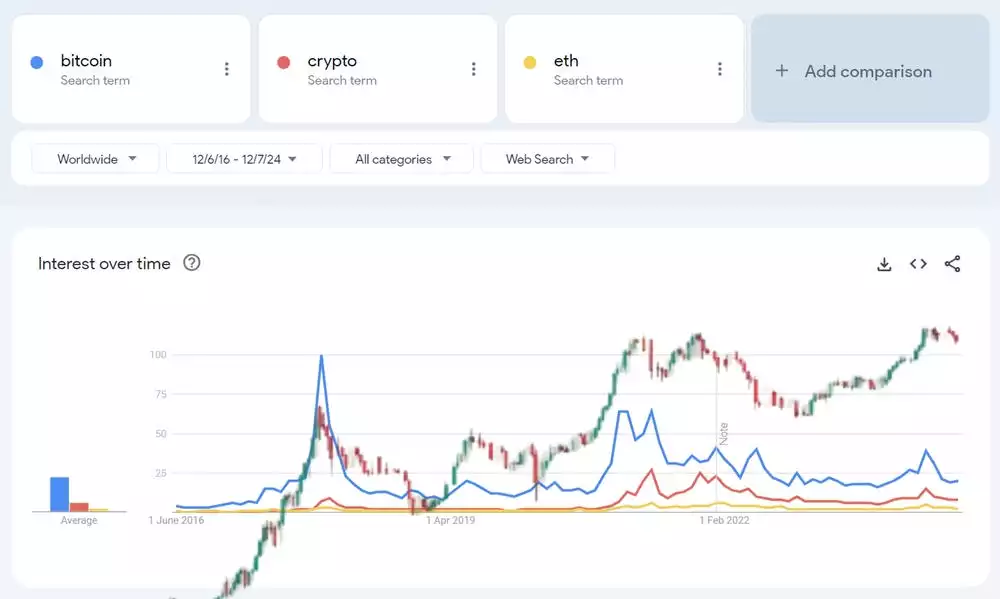
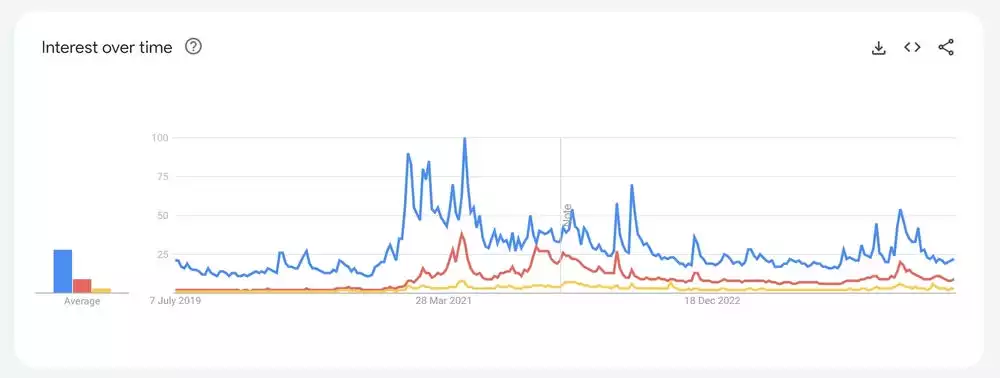
Google Trends are still telling us that retail hasn’t entered in a way that previous cycles have shown, however it’s important to note that the bull market has still been rising to all-time highs with minimal searches. This could be because people already know what those search terms are, or people already have trading accounts from previous cycles and log back in to buy without needing to understand and do a refresher on crypto like previous cycles. However, if we want a euphoric rise, it will be very important to see large increases in new retail interest later in the cycle.
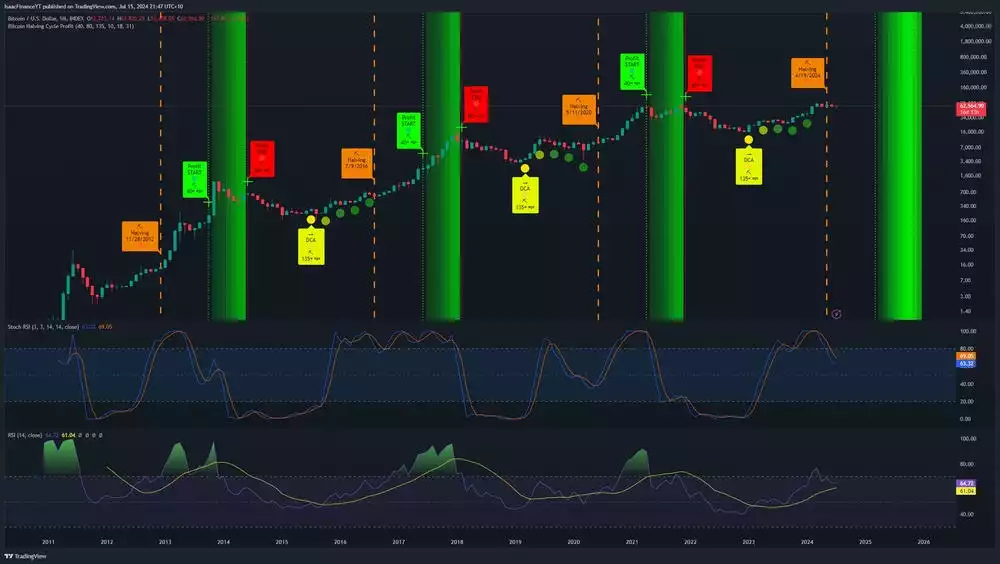
The Macro cycle is still in play, and nothing has changed. It’s important to note the green zone going forward as we start to shift our mindset from bullish to a more neutral/bearish stance. In the past, this has proven to be the most effective way to trade Bitcoin in hindsight.
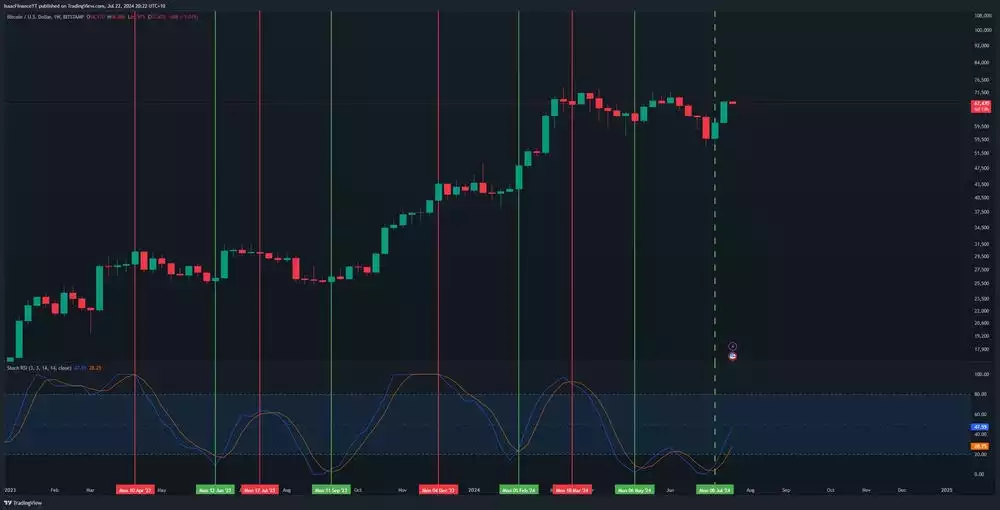
Looking at the weekly stochastic it is very promising with the price and indicator getting acceptance back into the trading range. If the stochastic has more follow through this could take us to the US$72k region we spoke about in the video update. These are long/mid-term momentum waves which dictate the direction of price.
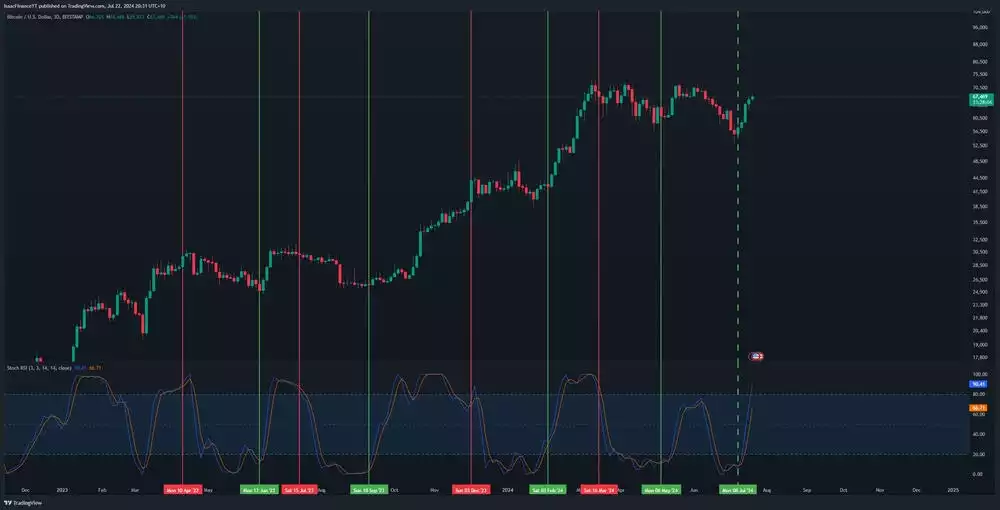
The 3 day is signalling we may be potentially slowing down, however it’s important to note that that it can stay in the exhausted range for quite some time, often giving misleading signals if solely relying on it for an exit.
This is what the price was looking like before it took off, a significant RSI divergence on the back end of a large sell-off into the 60-day cycle lows. This is something that doesn’t happen too often, however people do tend to get the most bearish into the lows of the daily cycles.
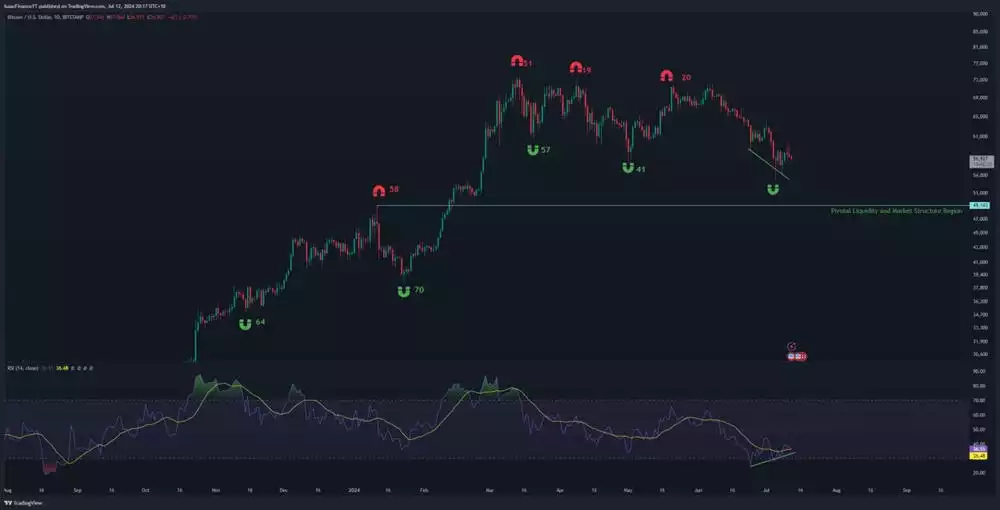
This is what has subsequently happened since then, solidifying the daily cycle low and pushing back into range which was needed to show bullish structure.
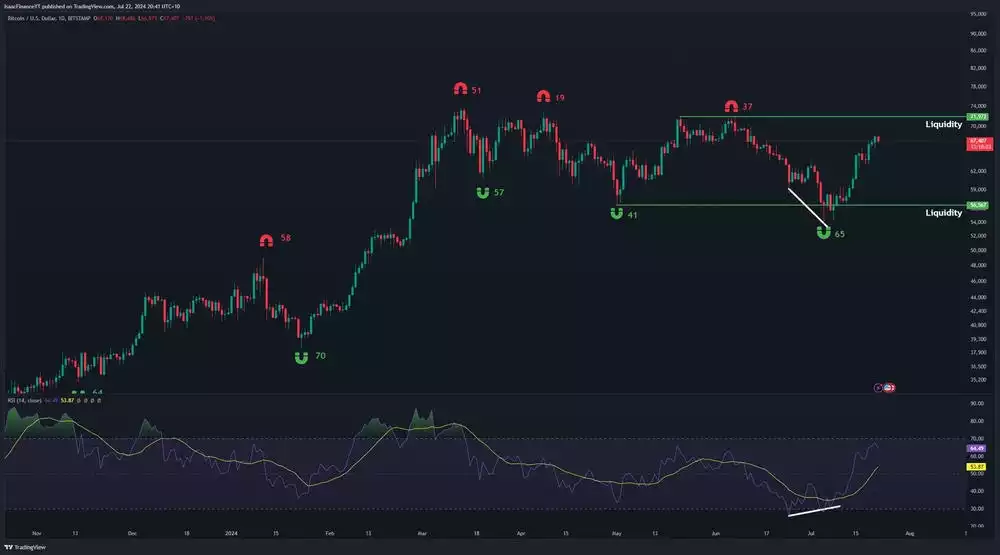
Zooming in to the current price action, we spoke about what strength in price would look like and so far it is on display. The key was to claim the Value Area Low of the range, which has happened. A key point to note is that once claimed there is an 80% chance that we reach the value area high, which sits at about US$72k.
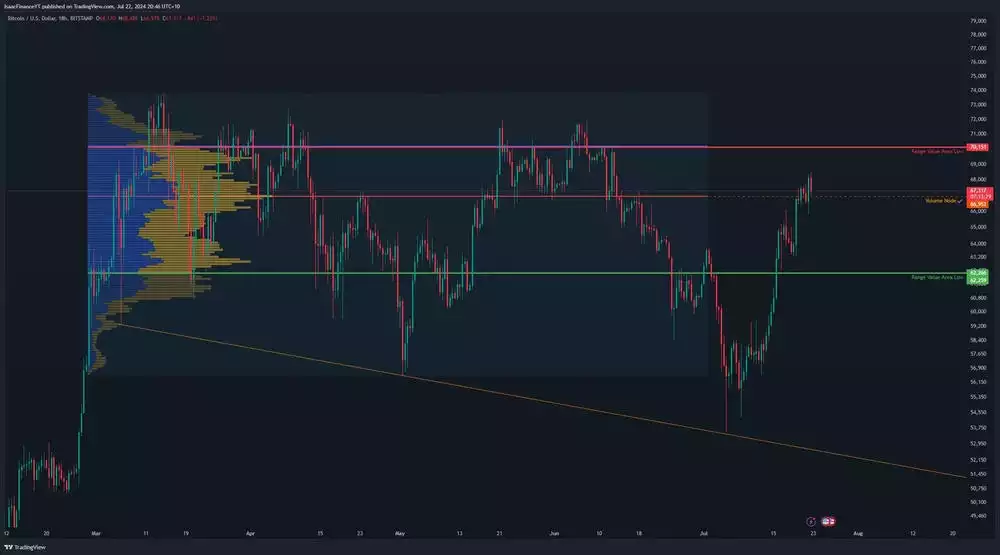
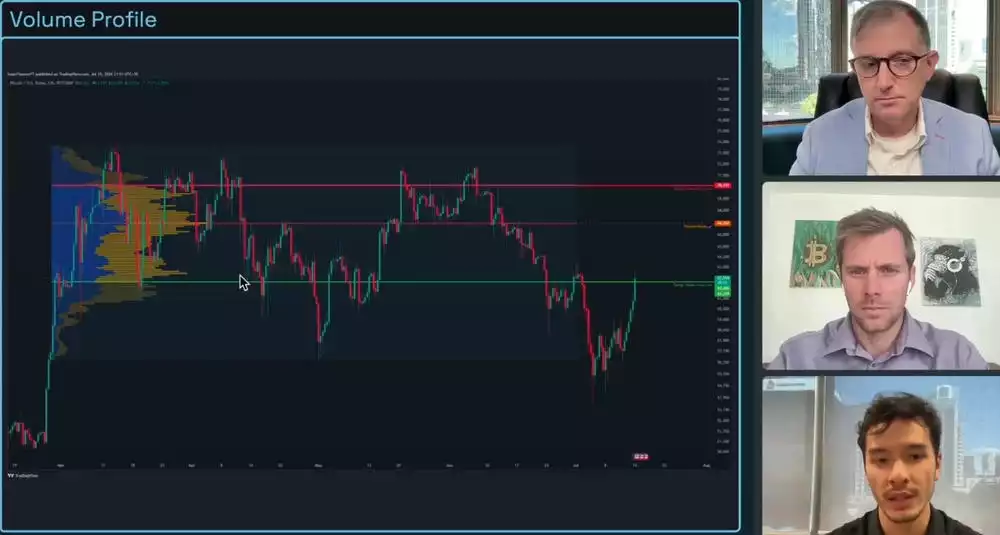
Here is what we were looking at in real time to get a better grasp on what was mentioned before.
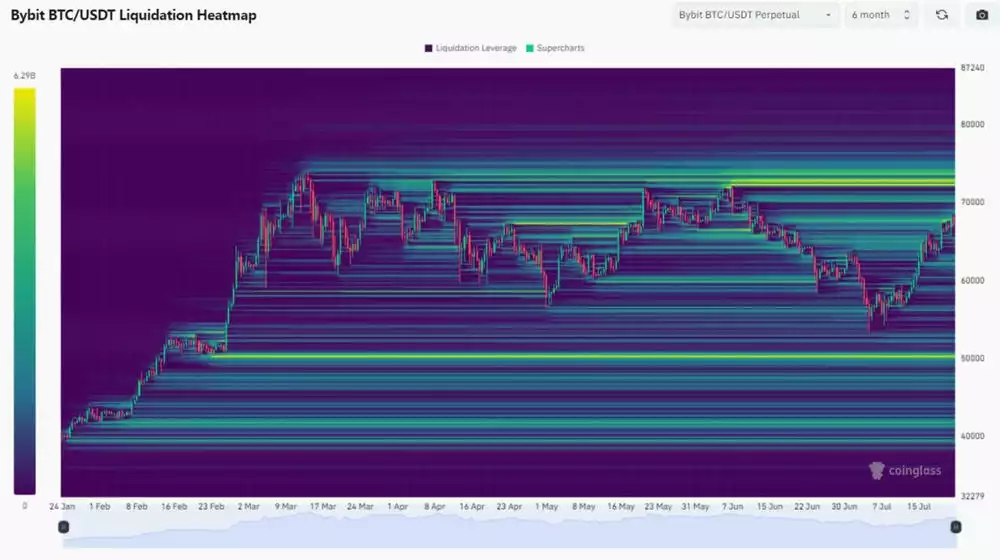
Regarding the liquidity levels, we are so to taking out US$72k liquidity block that it is currently acting as a magnet for price as there is no other significant block besides the US$52k region. Being in a bullish 60-day cycle the target should be the upside zone.
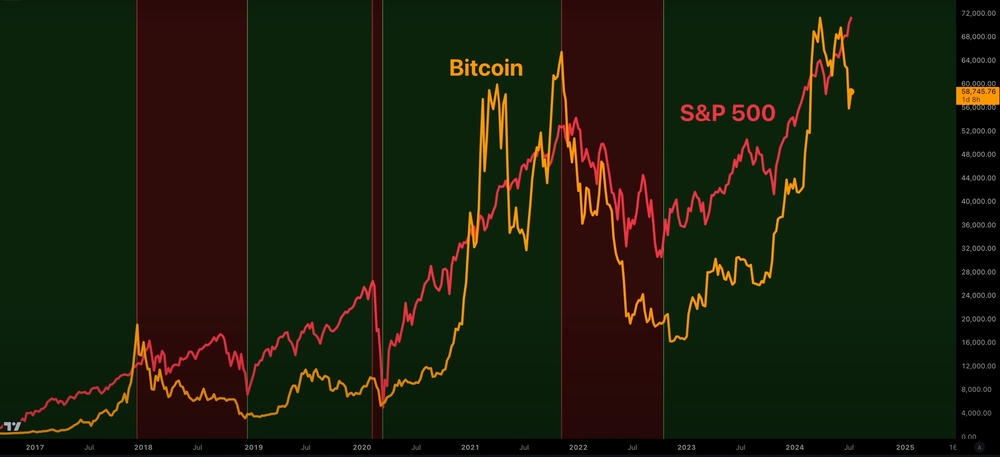
Another interesting chart to observe is the relationship between BTC and the stock market. Currently we are experiencing a divergence, however from an historical outlook this is actually very bullish as they both tend to revert back to parity in the long run. We have likely already started that journey to parity.
Watch the most recent video presentation of Bitcoin Analysis: Beyond the Block where we share some of these explanations in a panel format, and join the discussion on our YouTube Channel here.
We will return with more detailed analysis of everything Bitcoin next month, including more market analysis, on-chain metrics, sentiment, and technical analysis…
Isaac Ho | Independent Research Analyst
The Ainslie Group
x.com/IsaacsDevCorner
Share this Article:
Crypto in your SMSF
Top Movers
Get Started Trading Crypto with Ainslie.
Join Thousands of satisfied customers who trust Ainslie for their cryptocurrency and bullion needs.


