Bitcoin Report – January 2025
Posted on 28/01/2025 | 588 Views
Today our Independent Research Analyst, Isaac Ho from the Ainslie Research Team brings you the latest monthly deep dive specifically on Bitcoin – including market analysis, on-chain metrics, sentiment, and technical analysis. He highlights some of the key charts that were discussed and analysed by our expert panel in the latest Beyond the Block episode and expands upon his work with some additional insights. We encourage you to watch the video of the original presentation if you haven’t already.
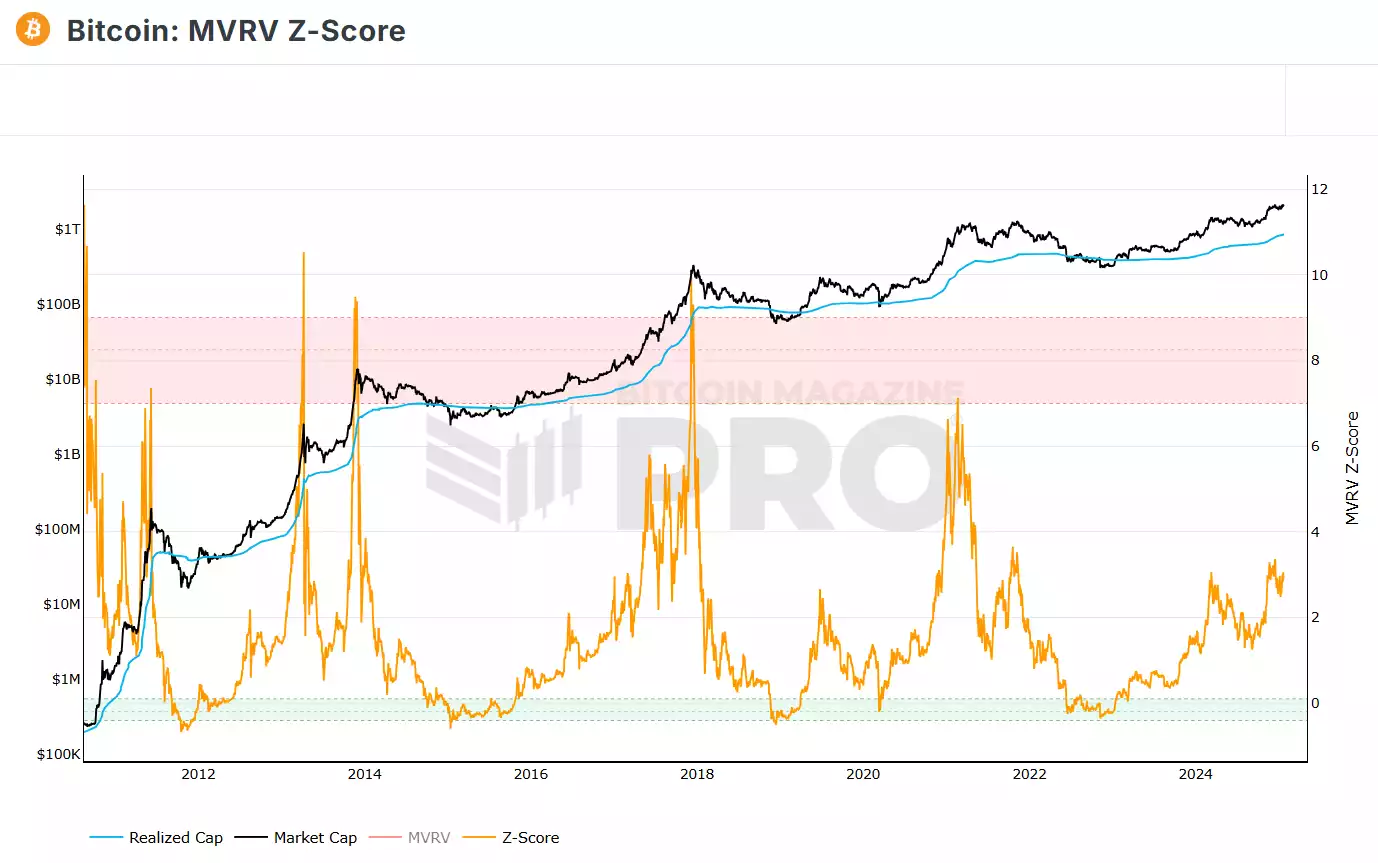
In the past two months, the Bitcoin price has moved even higher than the last update, with a new high of US$109,000. This price action has been nothing but expected. During the previous monthly updates, we warned of a rebasing period where Bitcoin could consolidate and dry up sentiment for the next impulsive move. This is evident by a new high in the MVRV ratio, however, we have since seen a cool-down. The expectation this cycle is that we hit five or higher on the MVRV ratio, which is still expected. There is no doubt we have slowed down in terms of price acceleration, and typically, we have seen large moves in the Z-score. This cycle has been more gradual with a less steep gradient.
That being said, just like the 7-month chop we experienced, more ranging simply raises the realized price, making the Z-score harder to push up. This could be viewed as bullish because typically every cycle we top with an extreme amount of deviation to the realized price, and sentiment gets blown out to an extreme. However, based on numerous metrics, nothing points to extremely overblown sentiment just yet. Especially when you tie the global liquidity backdrop into this, it is extremely hard to believe that the full-blown top is in.
Moving over to the fear and greed index, upon reaching the local regional top of US$105-109k, we have seen a subsequent pullback in sentiment. People new to the space think a drop in sentiment is bearish; however, when adopting a contrarian trading style, going against the pack can be the best thing to do and often delivers amazing returns. A perfect example was the sentiment flush in the last consolidative period. Price was at the relatively same level, yet people were drained and exhausted from months of sideways price action. Is the same thing happening now? While some sideways chop could be expected, it’s unlikely to draw out for seven months like the last phase simply due to the timing of the four-year cycle.
During the final year of the bull market, we don't generally consolidate for long, and every dip is eaten up very quickly until the top is in, which then the dip keeps on dipping. So, in summary, dragging sentiment out is the best thing for price, especially at elevated levels like now.

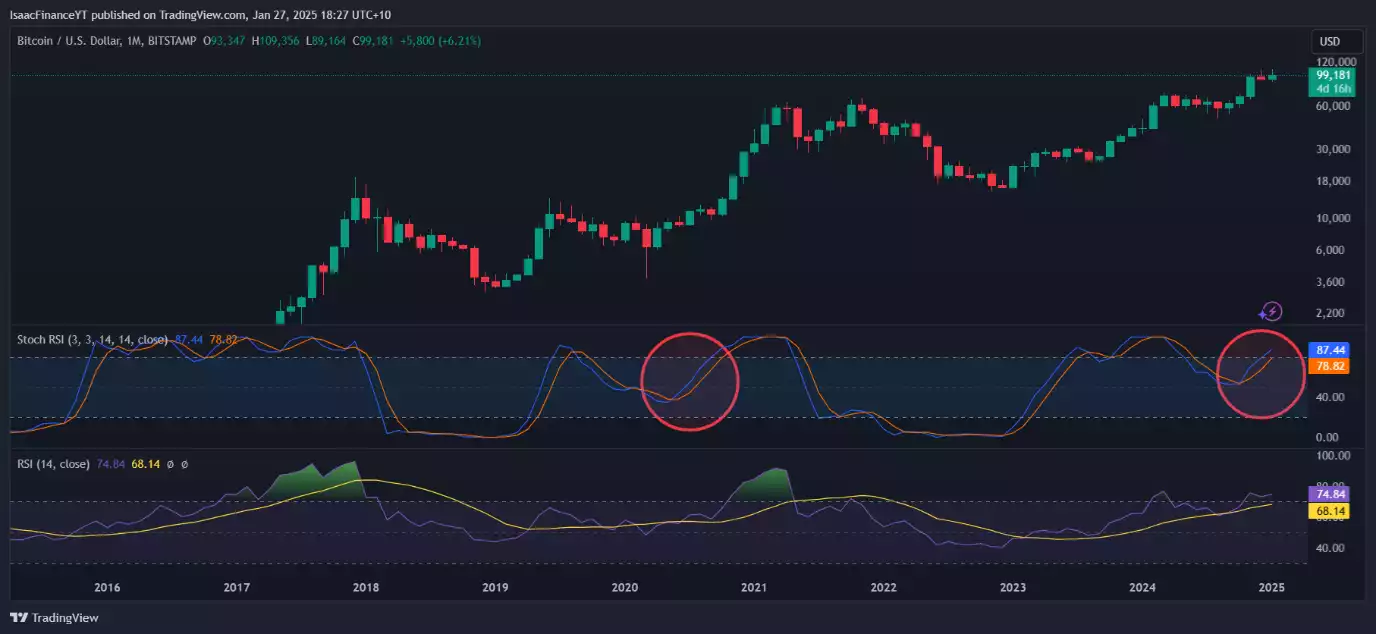
Moving along to the Monthly RSI chart, what we’re seeing is that this cycle, from a stochastic viewpoint, is looking rather like the 2020 bull run, bouncing off the 50th percentile region of the RSI. Now, looking at the standard RSI, which is resembled in the purple chart, what is visible is that we likely haven't yet reached fully overbought levels, typically denoted by green colouring on the indicator. While the hard rule is not that we must see this green overbought look for the top to be in, but one could make the based assumptions that it's going to happen again based on the previous samples. Keep in mind other metrics like MVRV also point to a similar picture.
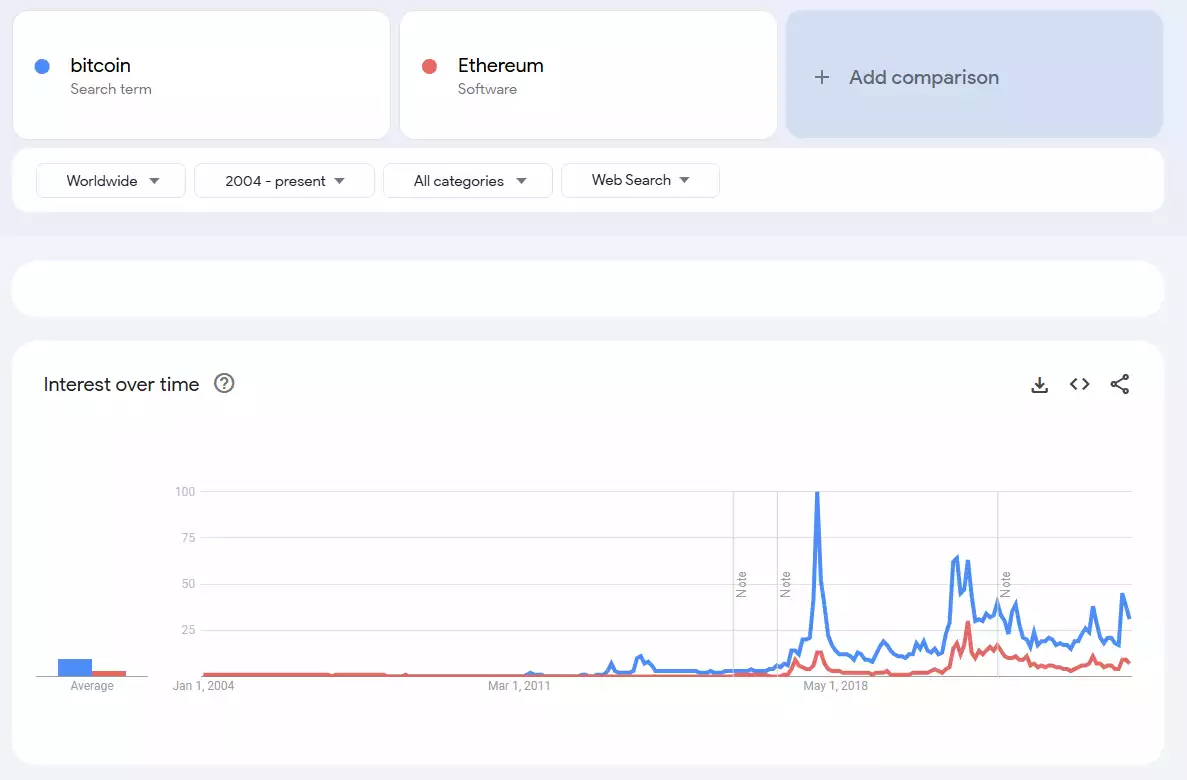
Google Trends for these specific search terms (Bitcoin and Ethereum) is not showing any new information to the last update, the only noticeable difference is we are now at overall higher sustained levels which is very bullish because it means the network effect will grow stronger as it compounds through time.
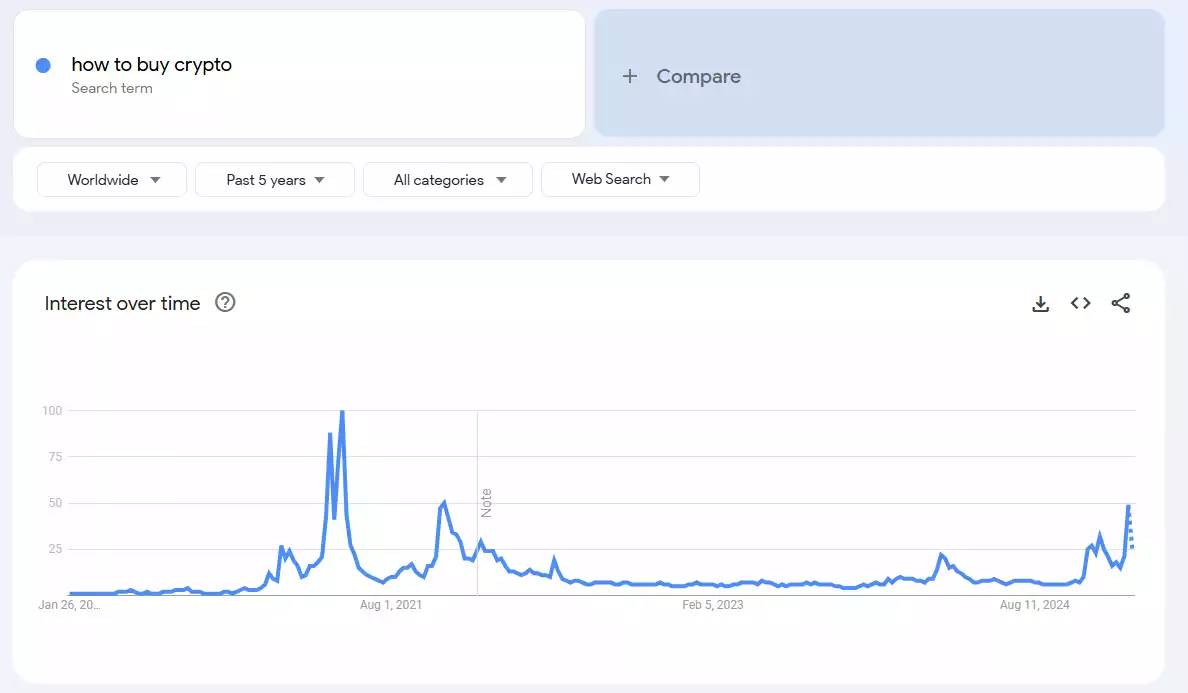
However, when looking at “How to buy crypto” we can see a sharp increase during and leading up to Trumps inauguration this is most likely due to the Trump coin and all the new people that it brought to crypto so makes sense why people would type that search term.
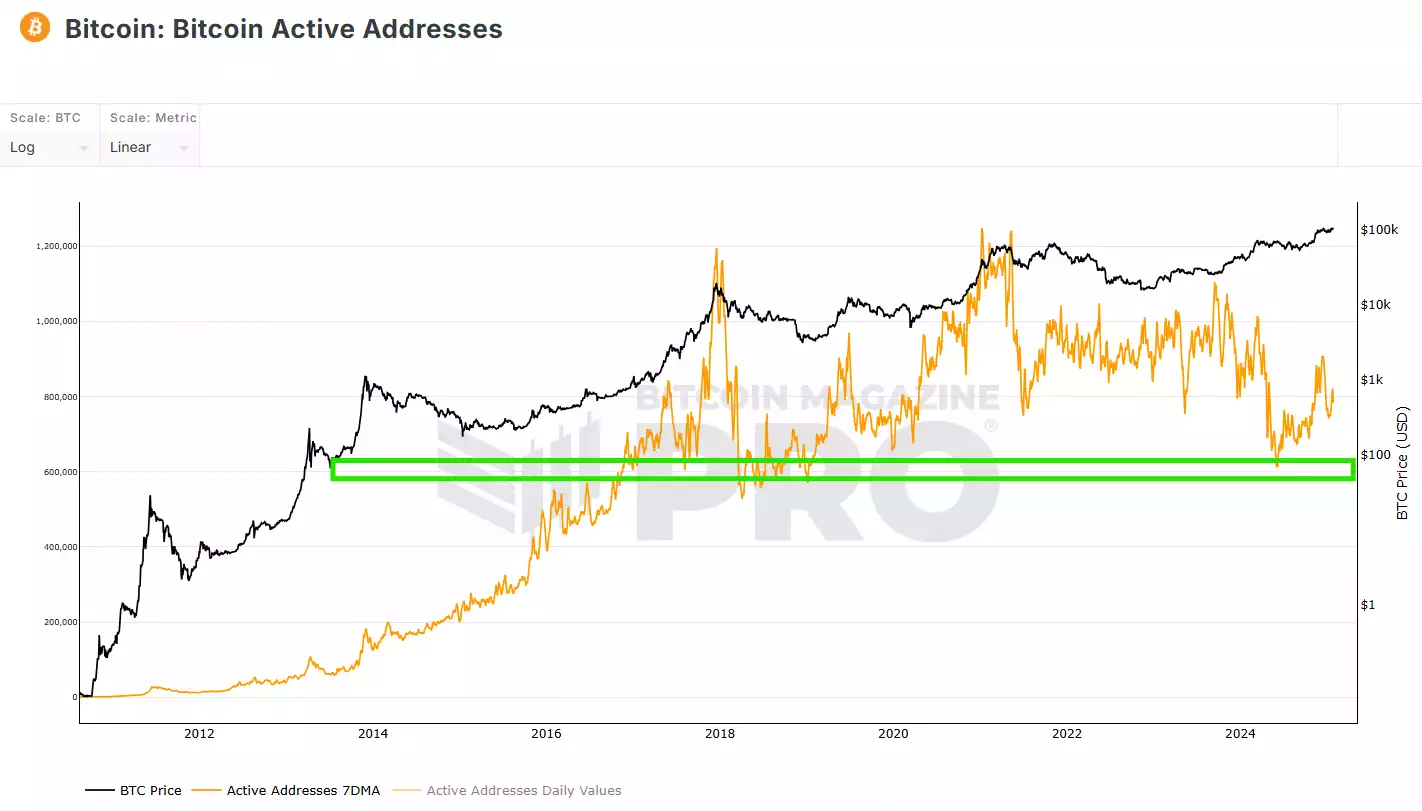
Now, looking at active addresses, what we can see is that support is still being held at the region noted in the updates a while back. However, we are starting to see a decline in activity. This metric is not used much, so it's quite hard to give a prediction on what to expect. But based on a logical assumption, it's clear the top isn't in according to this metric because we didn't even get close to breaking all-time highs in activity, which is something you would expect while reaching such a pivotal point in the chart. And we can see each respective top has seen a new all-time high in activity. However, it's hard to tell the effect that ETFs have on the market in terms of an activity representation like this.
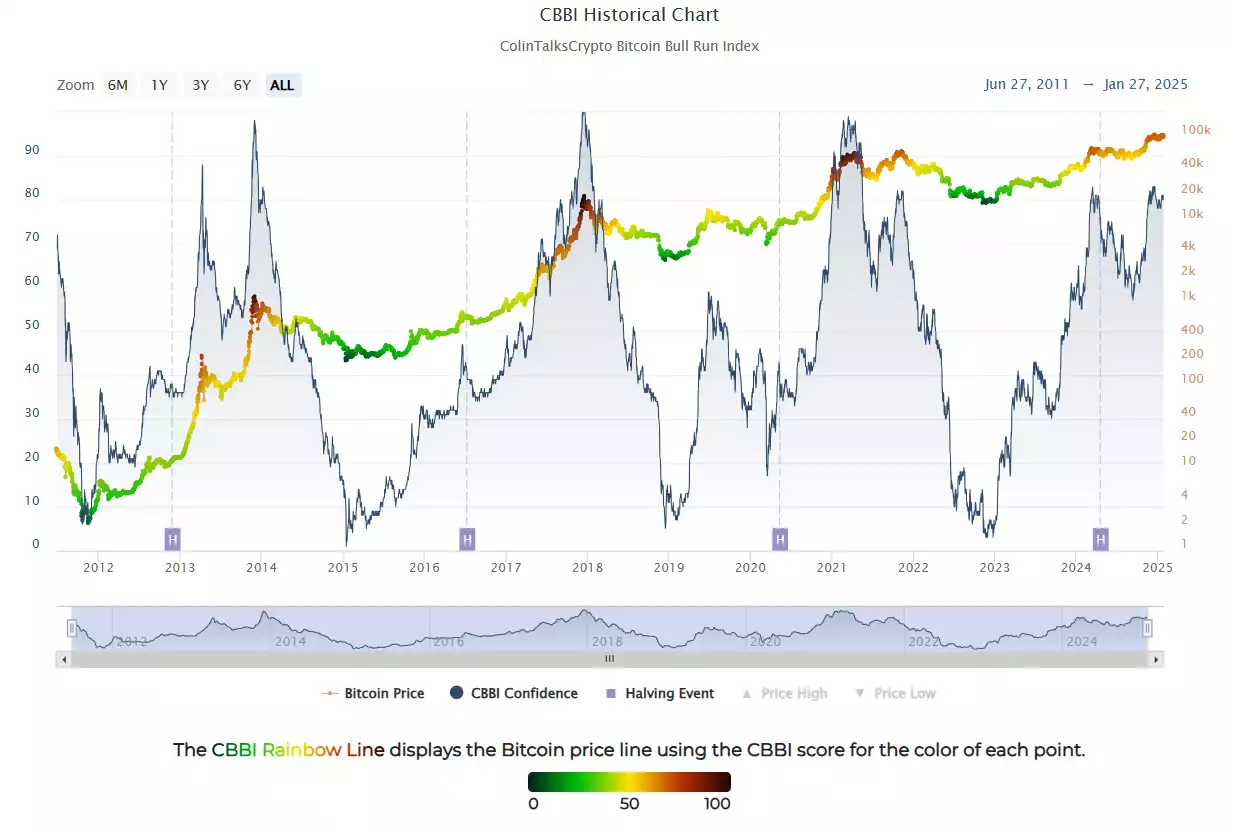
The conglomerate CVD metric paints a picture similar to the other tools, signalling that yes, we are at elevated prices, but we have not yet seen the typical top signals. Now, an important thing to note is that people probably think these top signals are too easy. However, during the moment, it doesn't feel that way, as a narrative is typically appended to appeal to the masses and create mass hysteria to convince people the top is not in. This doesn't always have to happen. However, a broad-based assumption is that it will happen because you have to ask yourself why the market always tops with an extreme level of greed? This is due to a narrative and green candles which convince retail to pile in at all the highs. When the smarter investors know the best time to accumulate was during the bear market as global liquidity was starting to reverse.
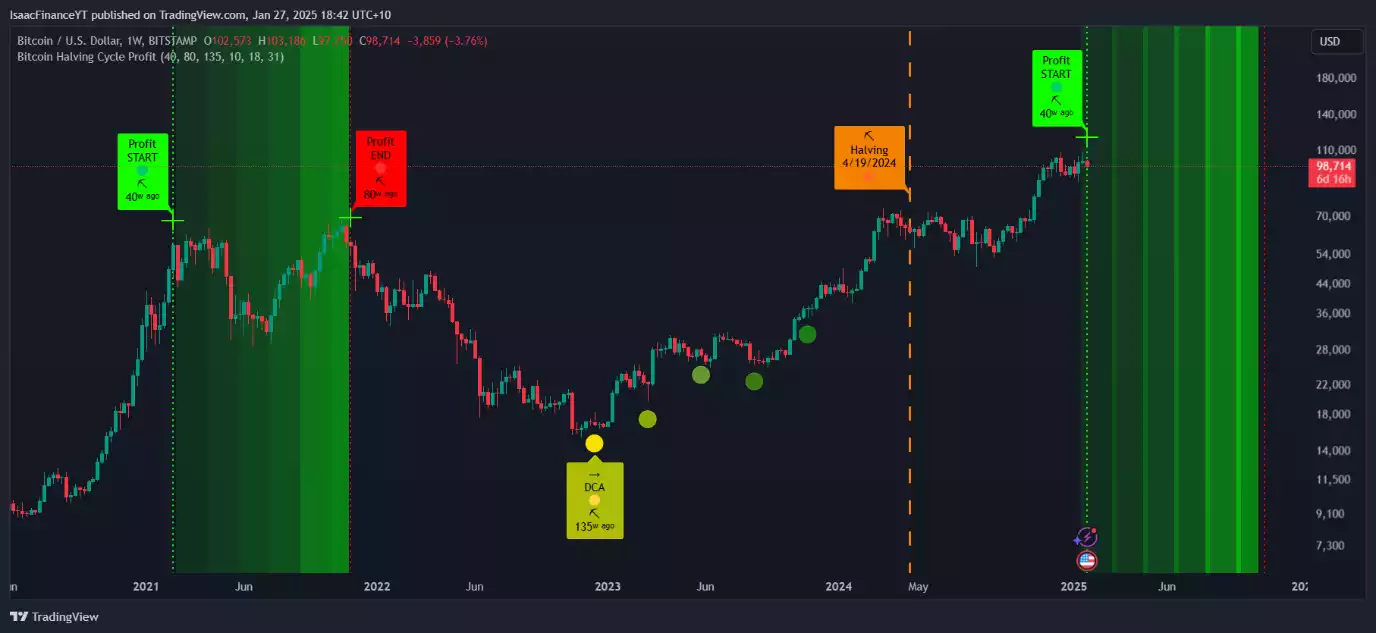
Now onto an indicator where the metric shows the times to DCA buy and to DCA sell according to four-year cycle theory. Now what we see is that we have enter the first band where the bias must shift from a Perma bull to an investor ready to find pitfalls in the market to sell into. During this phase we will hear things such as “the super cycle”, “its going up forever” and things along that line, however that will probably not happen, here are a few reasons why, long term holders always sell during this time so why would we believe otherwise, next thing - do institutions really want to buy all-time highs and in the area of price discovering? Likely we see the same pattern playing out and Bitcoin topping within this region. Now regarding the draw down we see that will be reserved for later updates as we approach that time but as of now, from now on we be more learning towards ‘the top is coming’ oppose to being very certain we keep going up, that being said there are still indicators showing that the Bitcoin market is still bullish and may continue to make new highs in 2025.
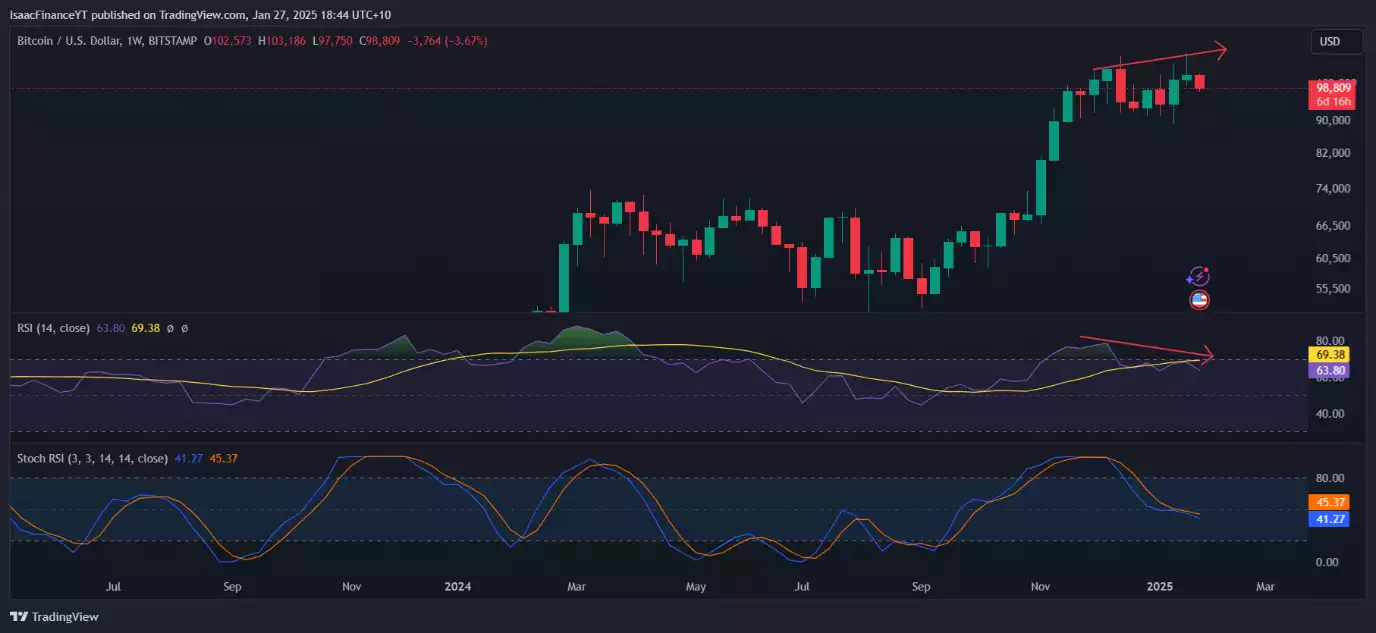
On the weekly RSI chart, a few notable points stand out, with the most prominent being the RSI divergence. However, this isn't a standard divergence, as it stems from wicks, which are typically not considered due to their nature as failed auctions at the highs of the range. Nevertheless, we will factor it into the analysis. Now, on the stochastic, it's telling a slightly different story, that maybe we are about to find a bottom. It's hard to say that considering we have seen a rejection at the highs and are back into the range. It's also less convincing because it's not in the lower band but rather sitting in the midline, meaning there is a lot more room for it to run lower.
The volume profile is painting a picture that may show we are going to be ranging for longer than people anticipate, likely a few weeks. As the DeepSeek black swan event has taken some liquidity out of the Mag-7, we have also seen BTC plummet back into the range. This is denoted by acceptance back into the value area high. The next stop is the range POC, which should offer support locally. The 80% rule applies to this also and would suggest we are heading to the value area low, which is around the $90k level.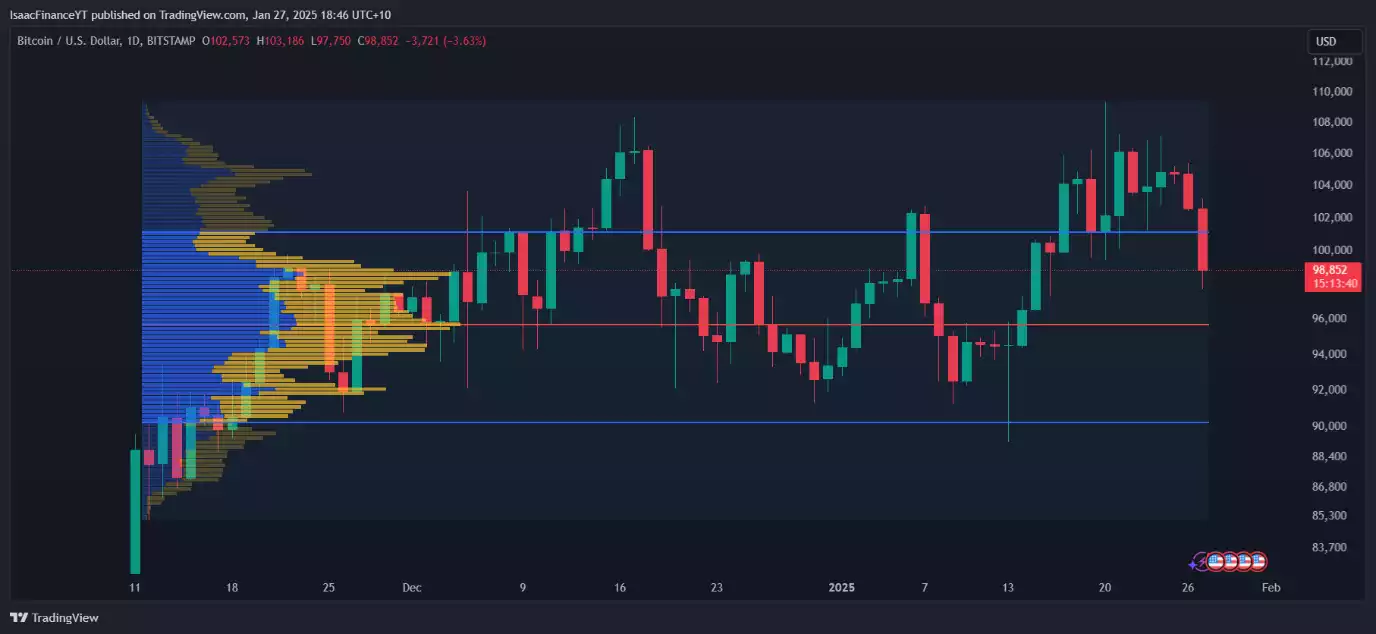
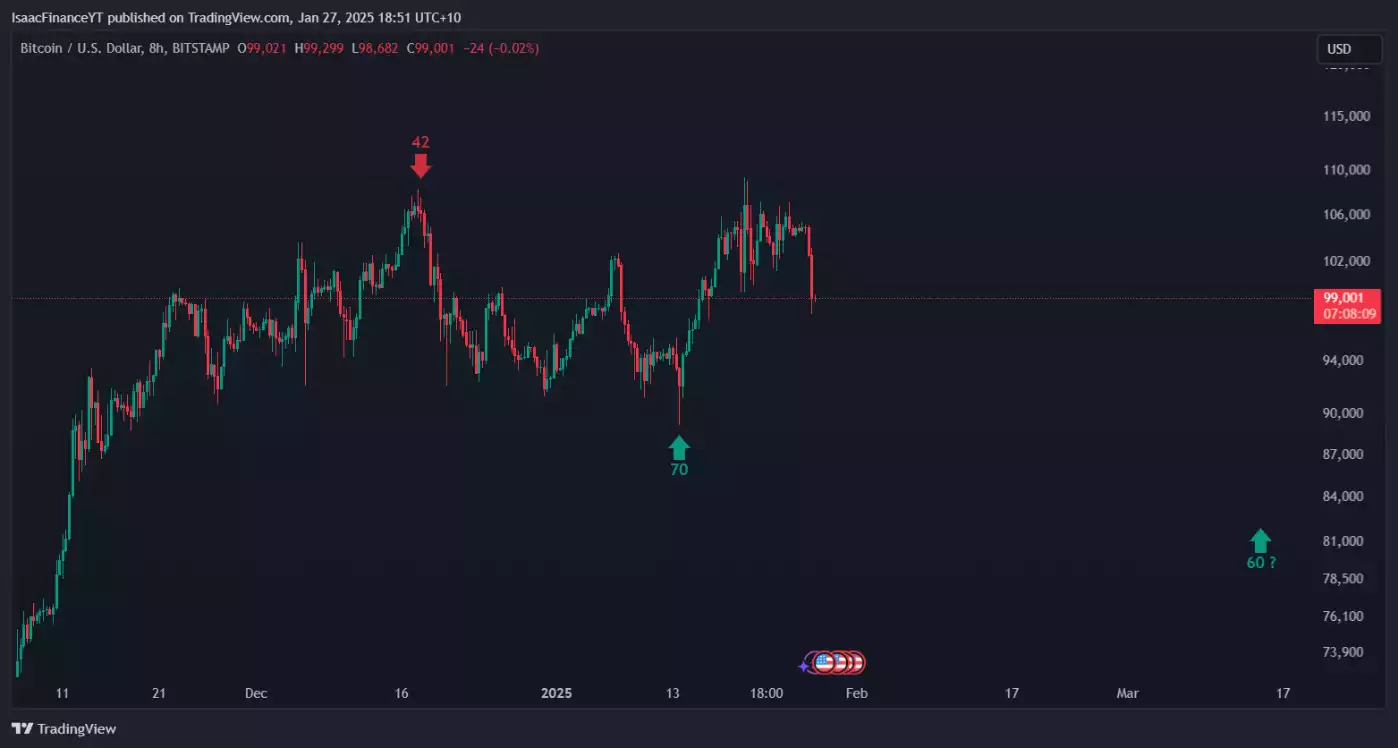
The 60-day cycles are showing to what seems to be a left-translated cycle, which may mean we have 40 days of downward/sideways chop before we see price start to accelerate again. This is all very bullish and sets up for an extremely good 2025 once we find the daily cycle low support.
Watch the most recent video presentation of Bitcoin Analysis: Beyond the Block where we share some of these explanations in a panel format, and join the discussion on our YouTube Channel here:
We will return with a more detailed analysis of everything Bitcoin next month, including more market analysis, on-chain metrics, sentiment, and technical analysis…
Isaac Ho | Independent Research Analyst
The Ainslie Group
x.com/IsaacsDevCorner