Bitcoin Report – October 2024
October 29, 2024
Today our Independent Research Analyst, Isaac Ho from the Ainslie Research Team, brings you the latest monthly deep dive specifically on Bitcoin – including market analysis, on-chain metrics, sentiment, and technical analysis. He highlights some of the key charts that were discussed and analysed by our expert panel in the latest Beyond the Block episode and expands upon his work with some additional insights. We encourage you to watch the video of the original presentation if you haven’t already.
Over the past month, Bitcoin’s price action has been quite eventful. We’ve seen major moves both downwards and upwards, and we may have found a bottom in this range as Bitcoin looks to be setting itself up to hit all-time highs relatively soon.
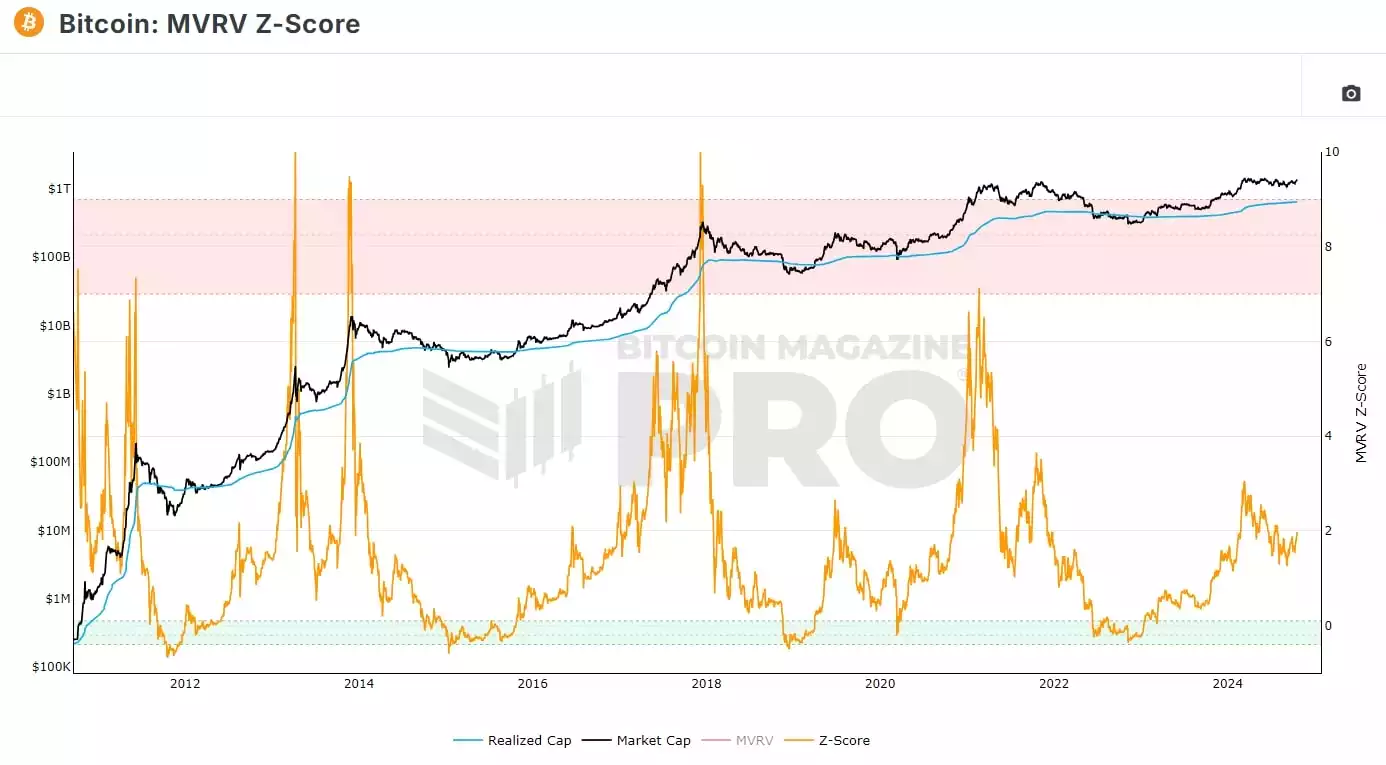
MVRV (Market Value to Realized Value) Ratio
The MVRV ratio, this cycle resembles the 2019 cycle, though the timelines don’t align exactly; as they say, history doesn’t repeat, but it rhymes. We expect Bitcoin to reach a Z-score in the range of five or above, suggesting we need to see a euphoric upward move. This would detach the MVRV ratio from the realised price to the market price. Historically, when the Z-score reaches six or seven, it has marked the cycle’s top. Whether this will involve a sharp move, as in previous cycles, or a gradual rise, remains to be seen, but we should have a clearer picture in the coming months as Bitcoin is expected to move with the liquidity cycle.
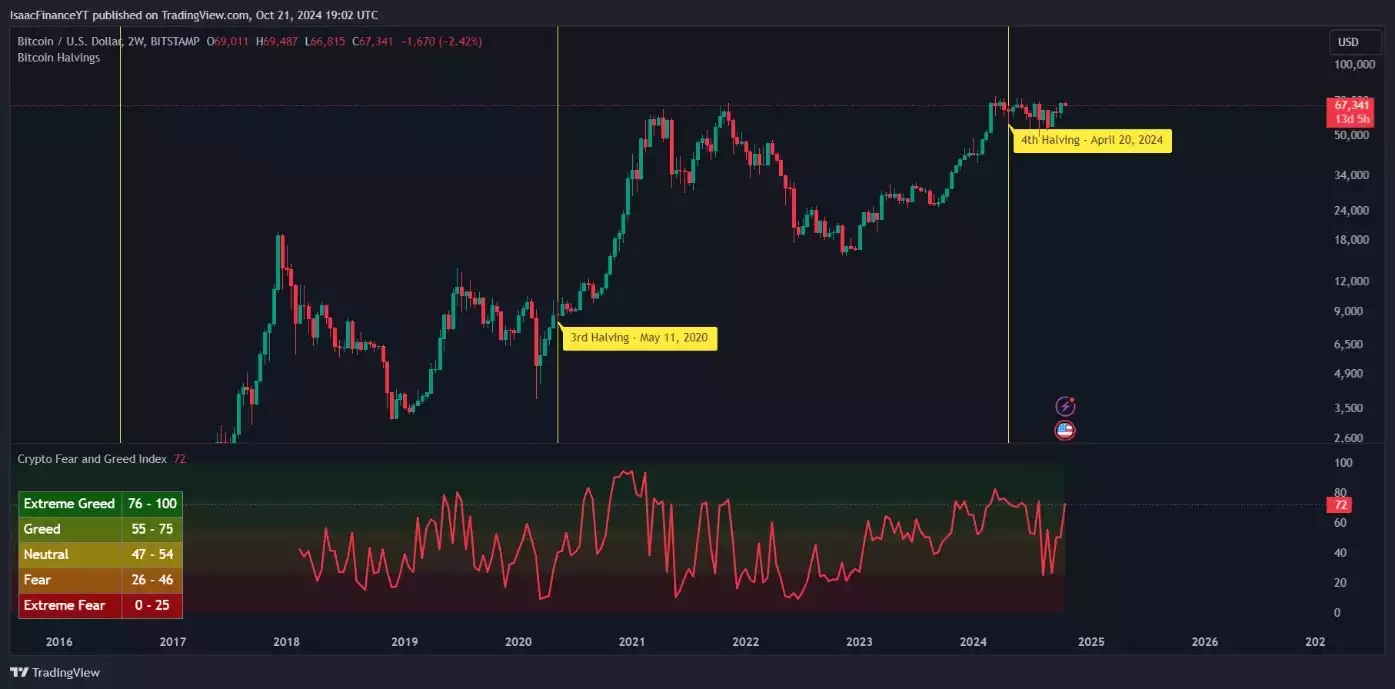
Macro Fear and Greed Metric
The macro fear and greed metric is showing significant choppiness, generally indicating investor paralysis where decisions are difficult, leading to hyper-volatile ranges and large emotional swings. Each vertical line signals a halving period. It’s typical for Bitcoin to range before experiencing a euphoric rise. We may be lagging slightly, but it’s important to remember that previous highs were reached before the last halving. Overall, the outlook for the coming months appears bullish.
Short-Term Sentiment
Recently, short-term sentiment saw fear hit extreme levels, followed by a large price bounce—typical behaviour for short-term indicators that scan online forums and Reddit. Online sentiment is a powerful short-term fluctuation indicator. Currently, we’re at a greedy sentiment level, so it may be wise to watch for resistance here. However, since this is a short-term indicator, resistance may be minimal, especially if we’re breaking out of this range.

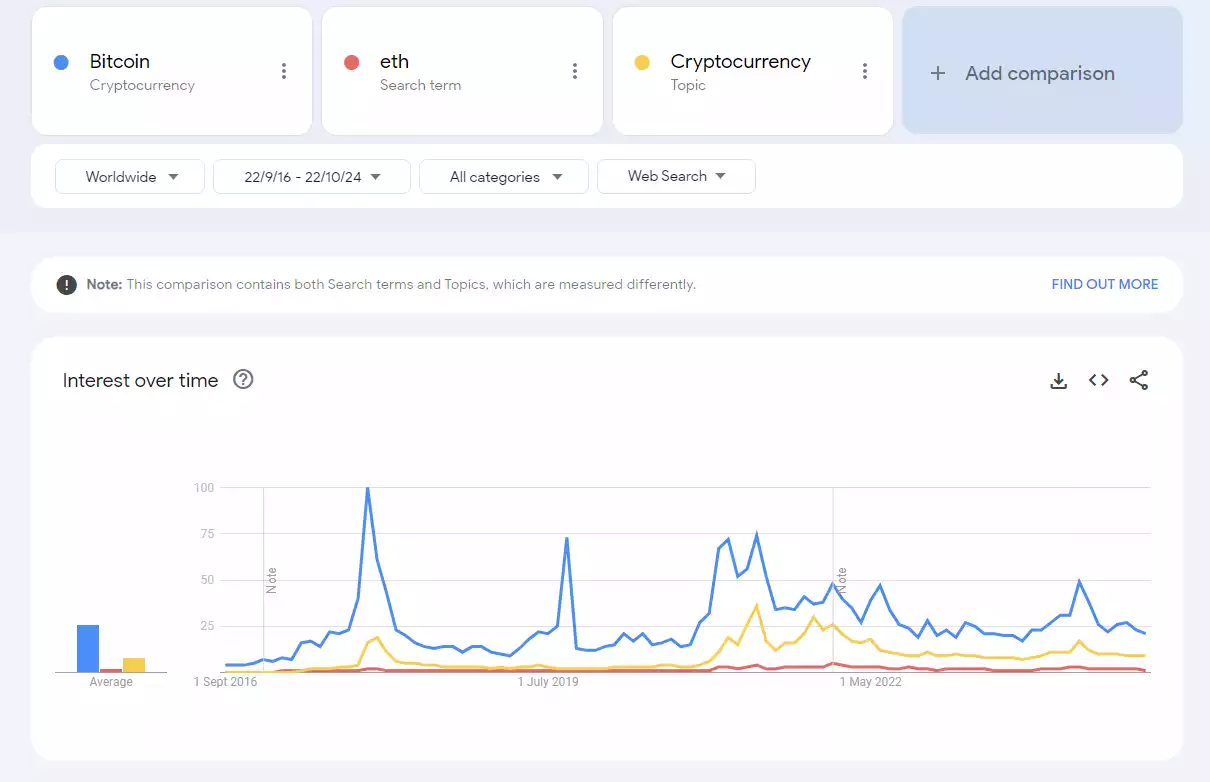
Google Trends
Google Trends is showing a lack of interest in Bitcoin and crypto-related terms. This can be seen as either bullish or bearish. However, most view this as bullish since Bitcoin’s price is near all-time highs while retail interest remains low, suggesting retail investors may have been “washed out.” Bitcoin’s value is now largely driven by more dedicated supporters, potentially providing a stronger base to launch when retail interest inevitably returns.
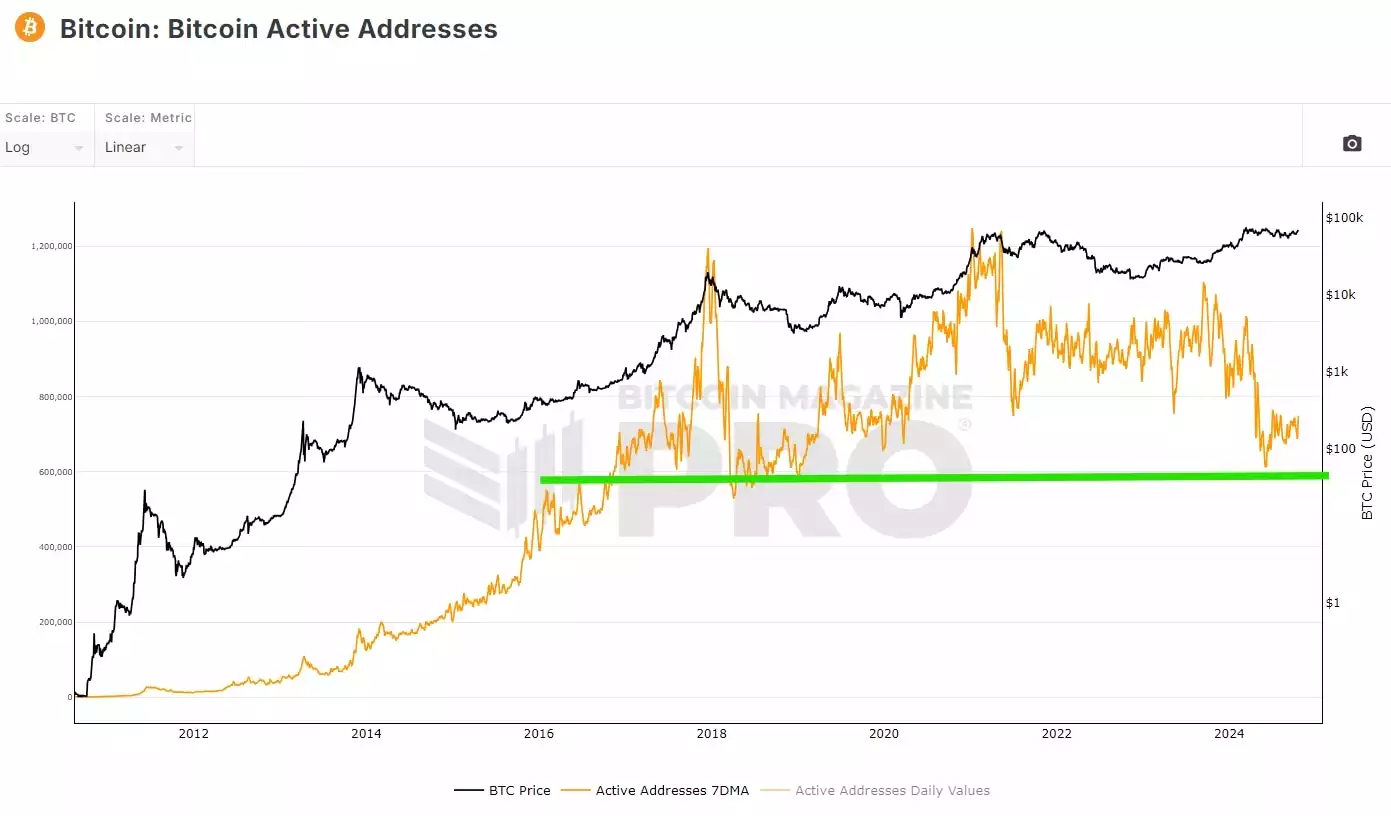
Active Addresses Metric
The active addresses metric, which we follow closely, seems to have found a bottom, followed by a small bounce. This indicator is useful for gauging when the market is overheated and for identifying potential bottoms. A bottom may have been established, and we could expect the next leg up within the next few months, if not sooner. The key is to remain on the market’s side, and this metric helps guide that decision.
Bitcoin Cycles Indicator
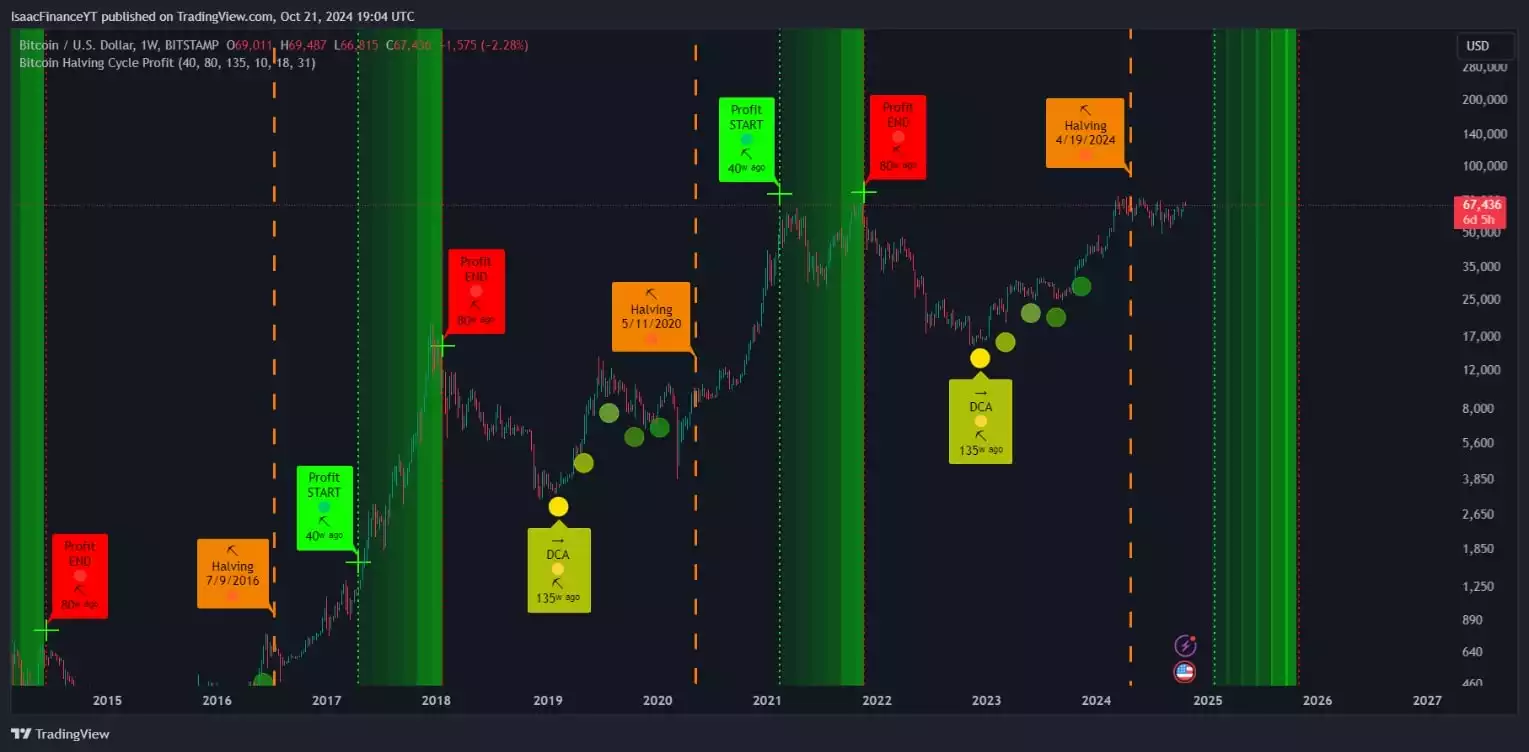
This Bitcoin cycle indicator will become more important later in the bull run as we enter the green brackets. This is the point to shift from a long to a short/sell bias, and instead of trying to pinpoint an exact exit day, we can use this area to dollar-cost average (DCA) out of the market. This approach aligns with the four-year cycle pattern and the liquidity cycles. We are currently in a transitional stage, but it will be essential to adjust strategies in the coming months to years.
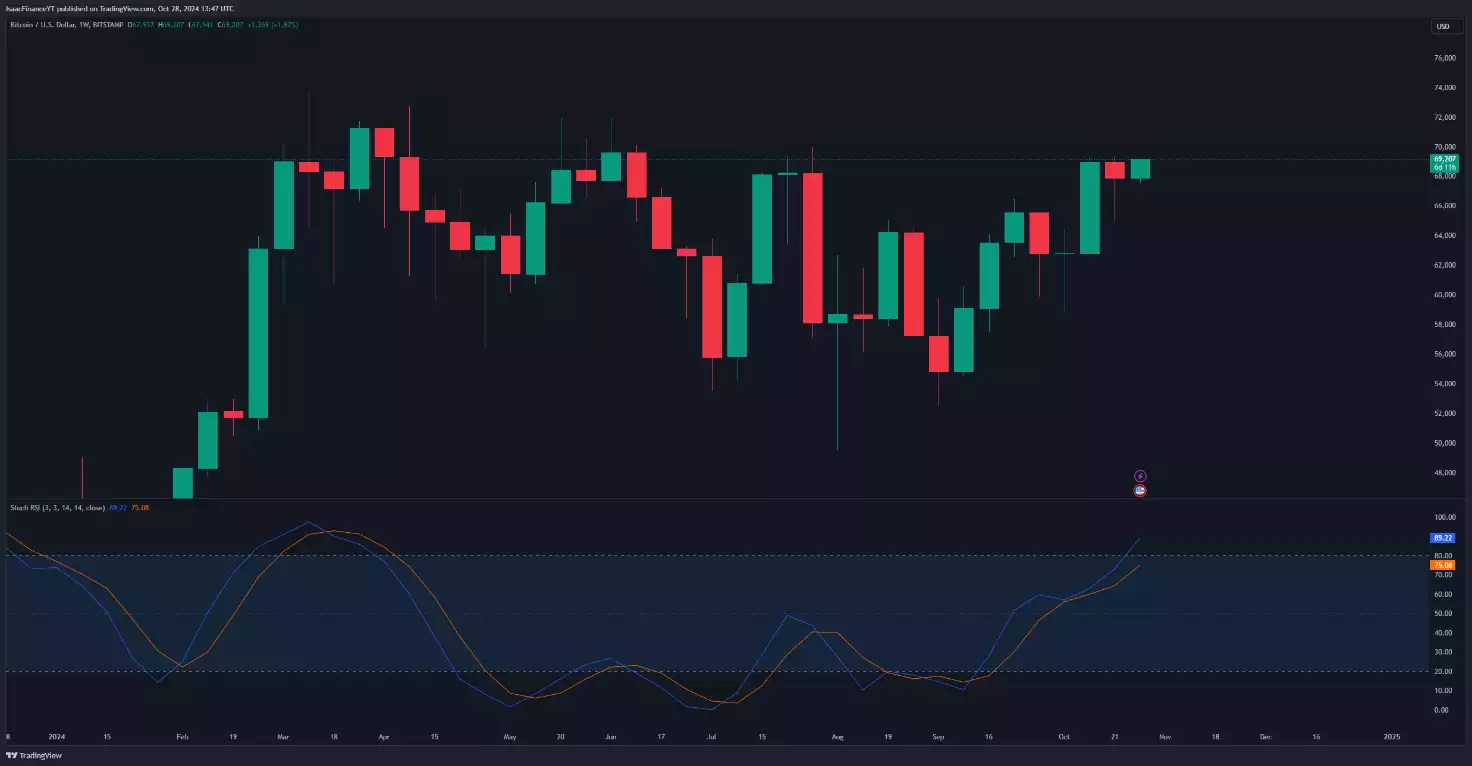
Weekly Stochastic
The weekly stochastic chart shows that the market is still quite overheated. However, in the case of a true breakout, this level of activity should be expected. The current structure of higher lows and highs is indicative of a bullish market, marking a shift in tone from previous months.
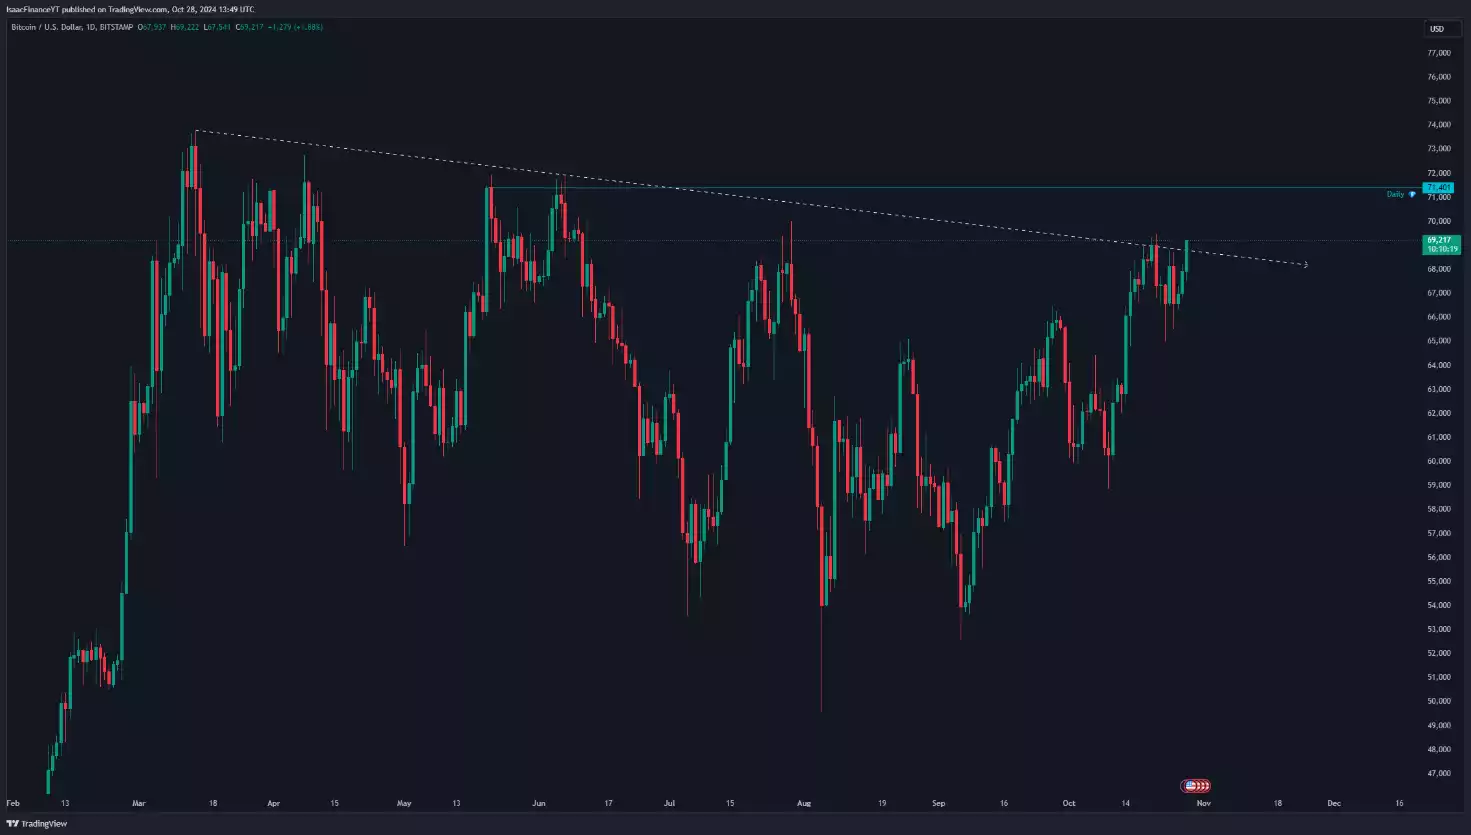
Daily Levels
On the daily chart, a key trendline has provided resistance multiple times. It will be essential to claim this level solidly on a daily and weekly candle close. Failing to do so and falling back into the range would likely indicate a failed breakout. Currently, we’re testing the trendline again, which is a bullish sign.
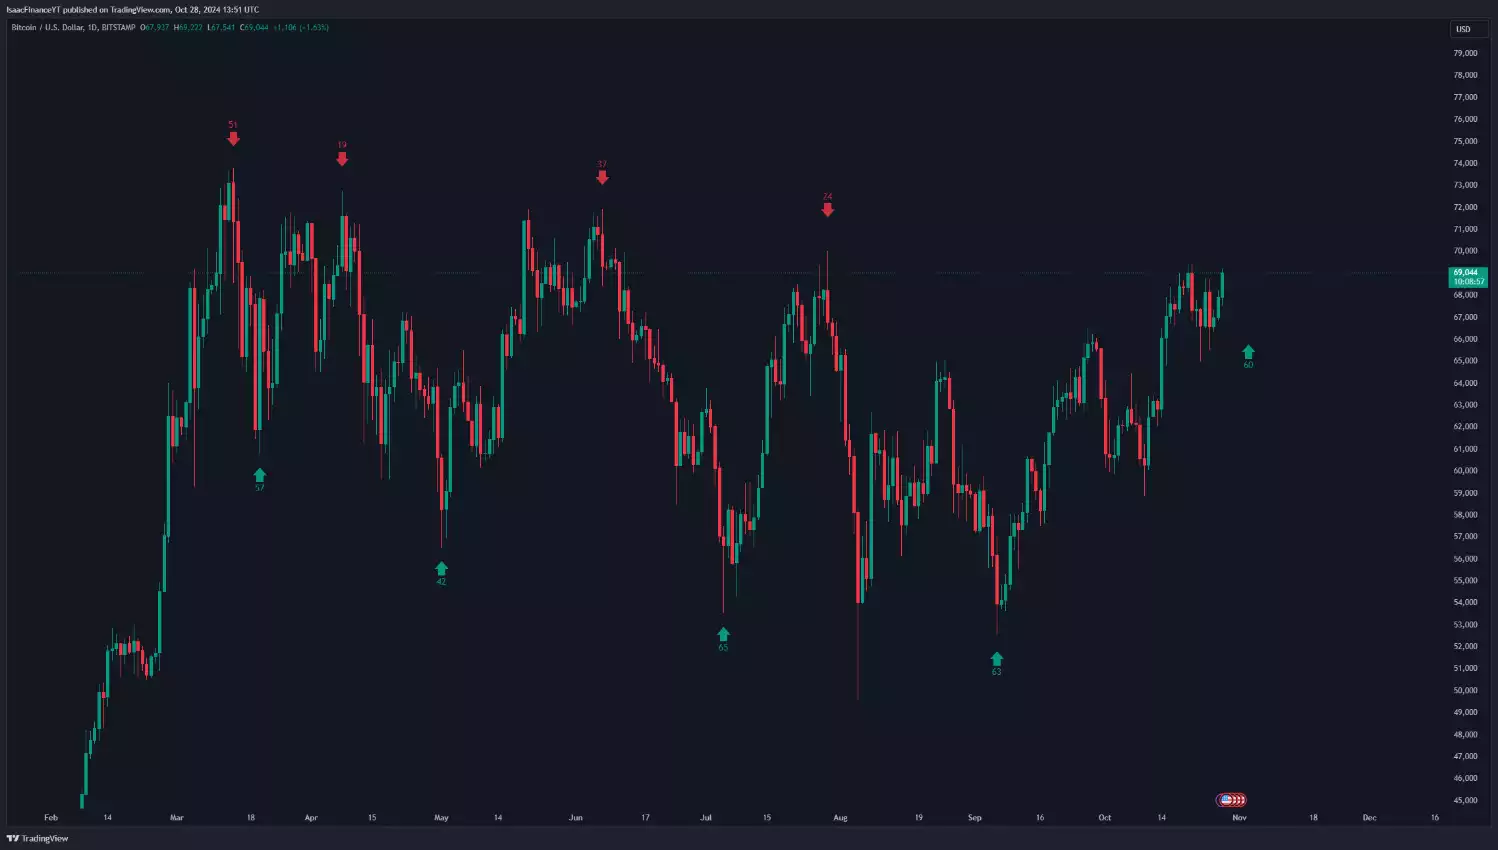
60-Day Cycles
Looking at the 60-day cycles, we appear to be approaching a cycle low, though it’s unclear whether this has already occurred or is imminent. Around this time, a cycle low is typically expected.
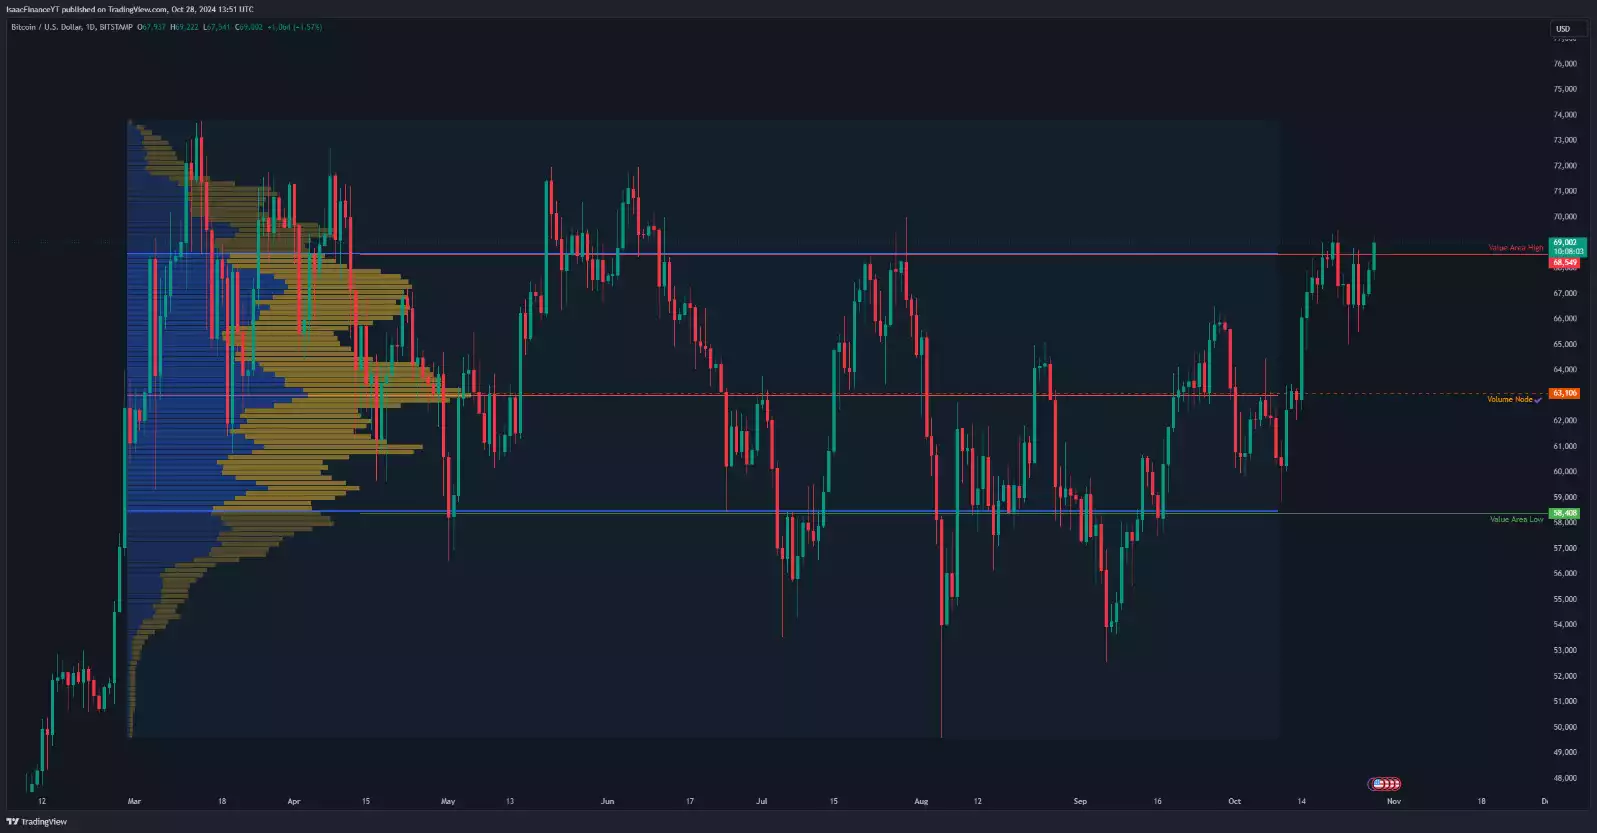
Volume Profile Metric
The volume profile metric shows we are at a resistance level, aligning with the trendline and other indicators. A break above this level and a confirmed claim would be very bullish. If we start trading lower, we will watch for a move to the middle of the range, or the point of control. This could coincide with a cycle low, though it wouldn’t be surprising to see a premature cycle low, deviating by only a few days.
CME (Chicago Mercantile Exchange) Gap
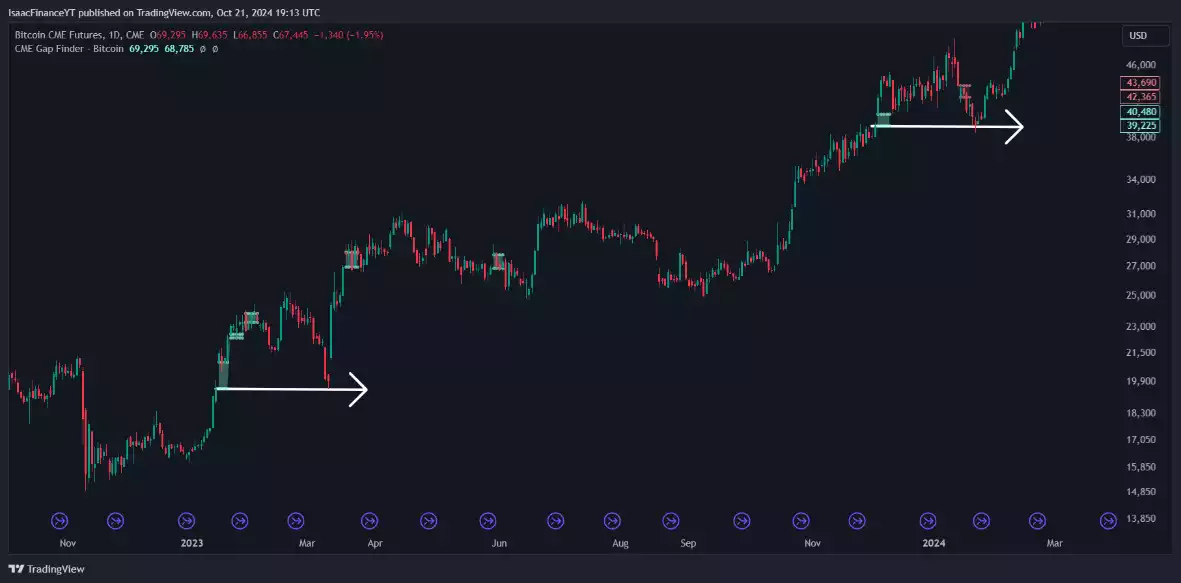
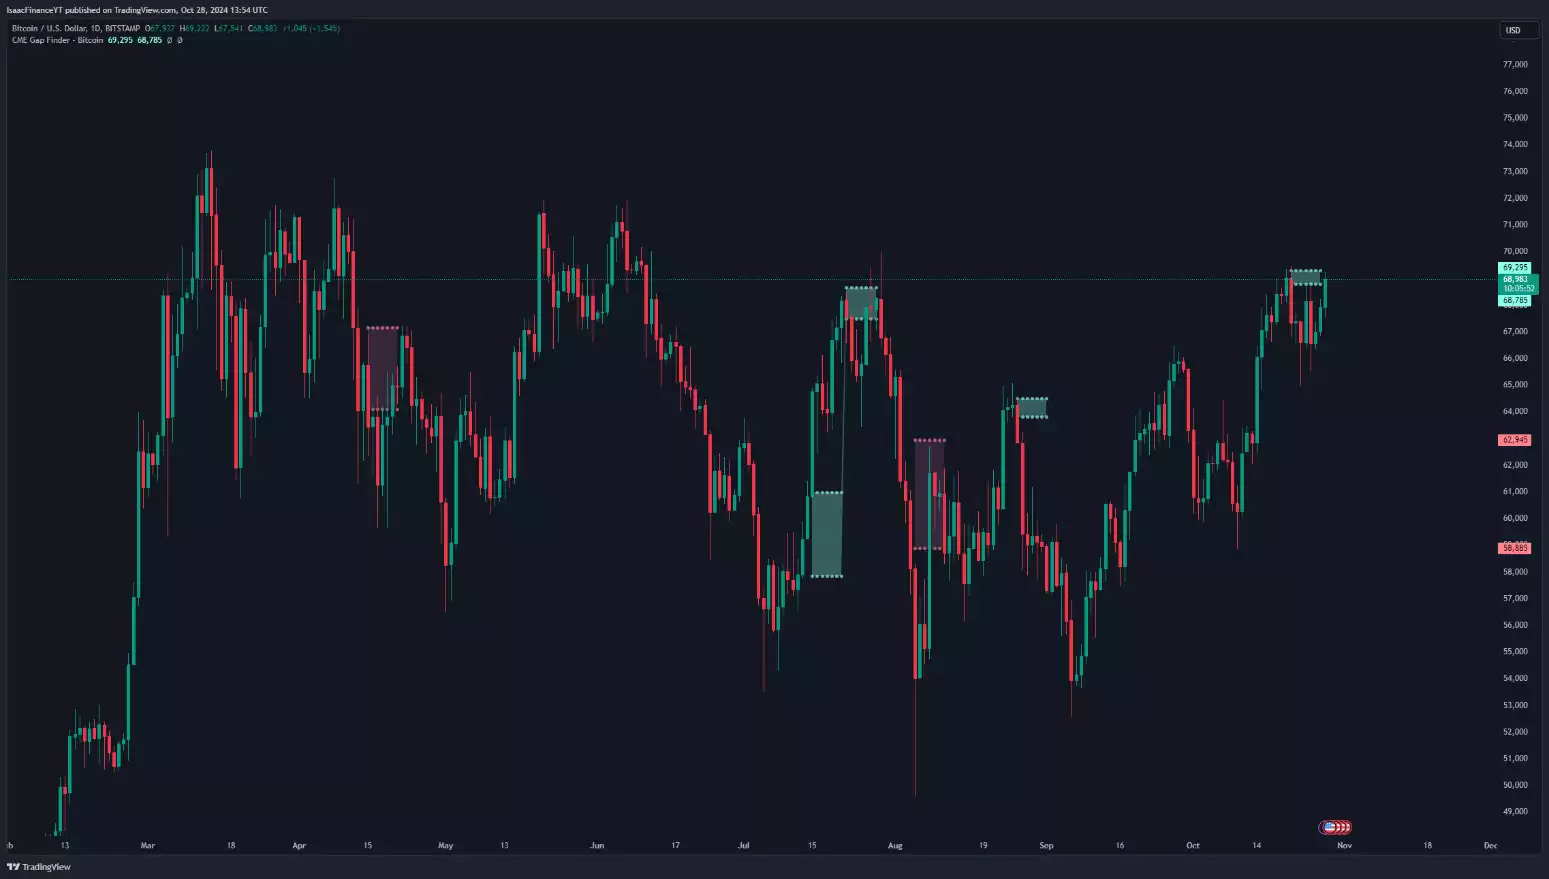
A new addition to the chart pack is the CME chart, which tracks the CME market. A gap forms when the CME market closes, known as the CME gap, which tends to be filled in the future. The gap likely acts as a self-fulfilling prophecy, as traders place stops and orders around these levels, creating liquidity and drawing prices back to fill the gap.
MACD (Moving Average Convergence/Divergence) Weekly
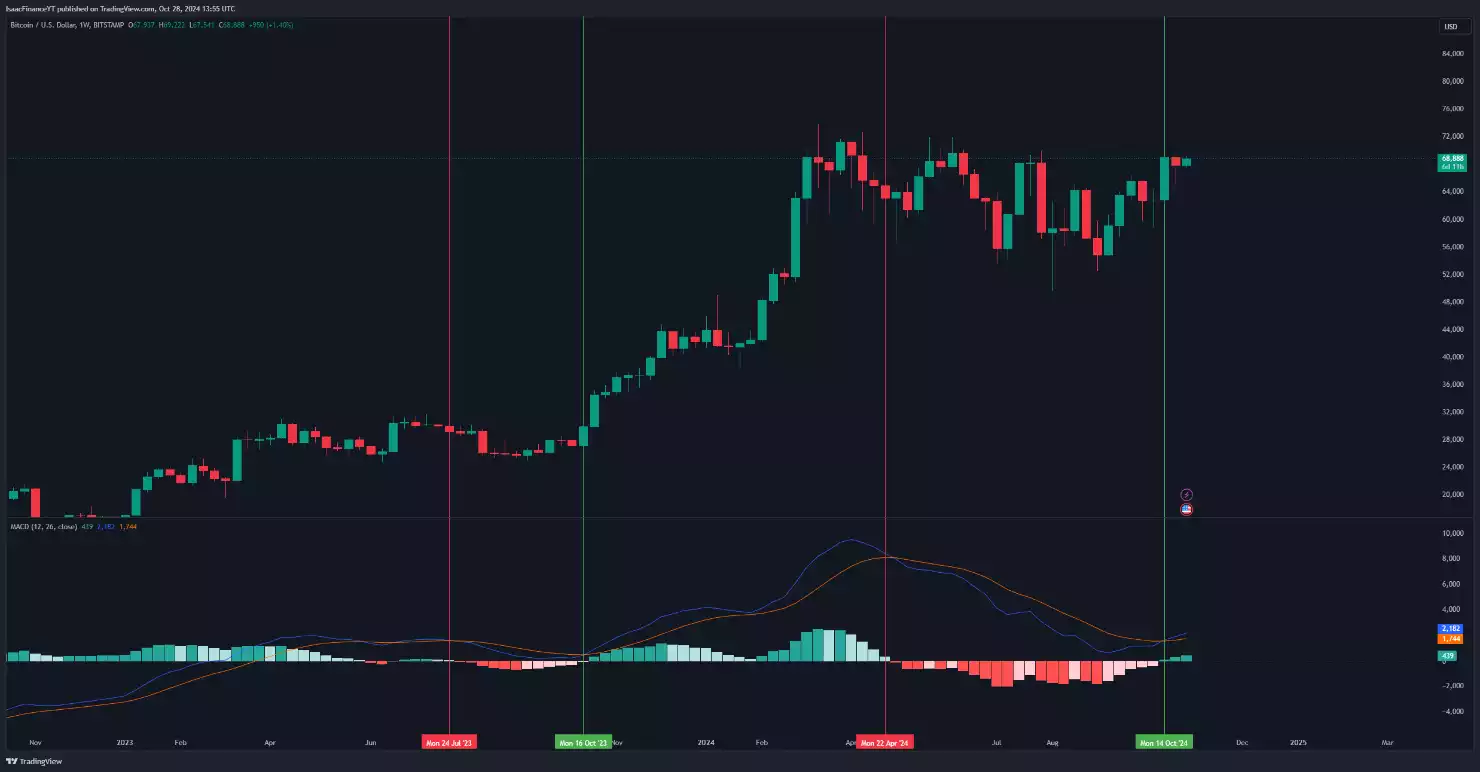
The MACD has recently flipped to a bullish stance. Historically, this has been followed by a significant rise in Bitcoin’s price. Although the move doesn’t usually happen immediately, it has been a reliable indicator.
High-Term Liquidity Levels
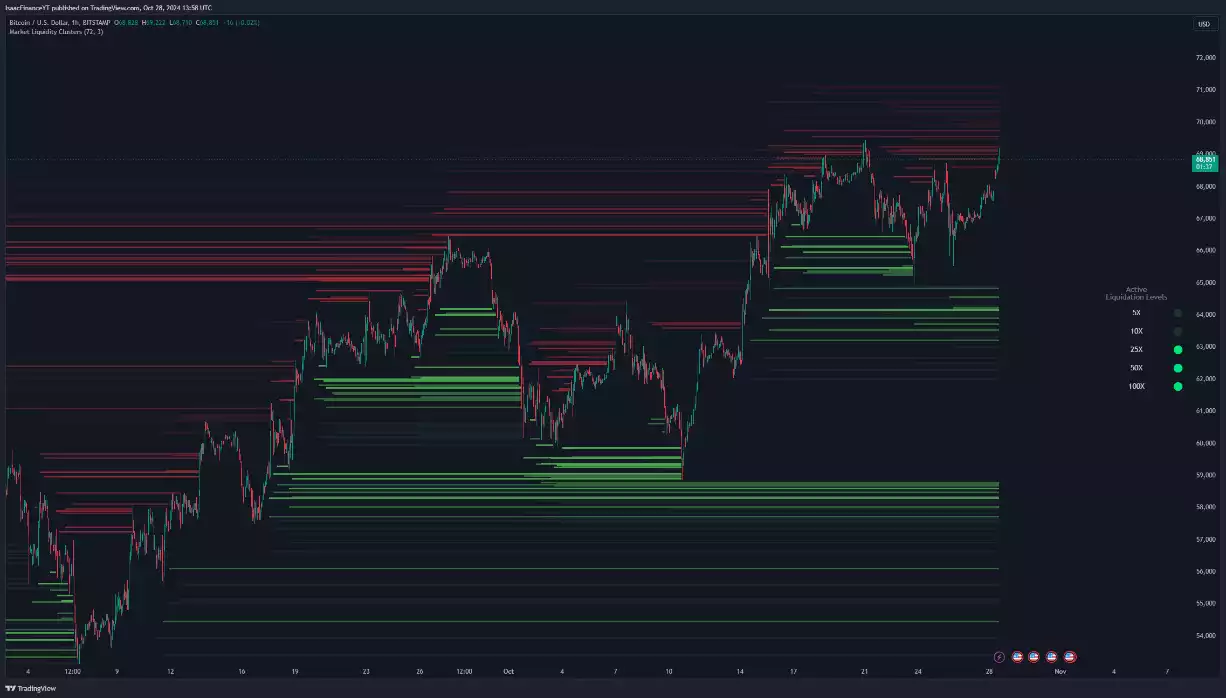
Looking at high-term liquidity levels, there’s a substantial cluster above, with around US$14 billion in short positions. If these are wiped out, it could trigger a large short squeeze, pushing prices much higher. This would further reinforce a bullish structure, increasing interest and driving retail back into the market.

Short-Term Liquidity Levels
Short-term liquidity levels appear balanced, with clusters above and below. This setup may not indicate a clear direction for short-term moves.
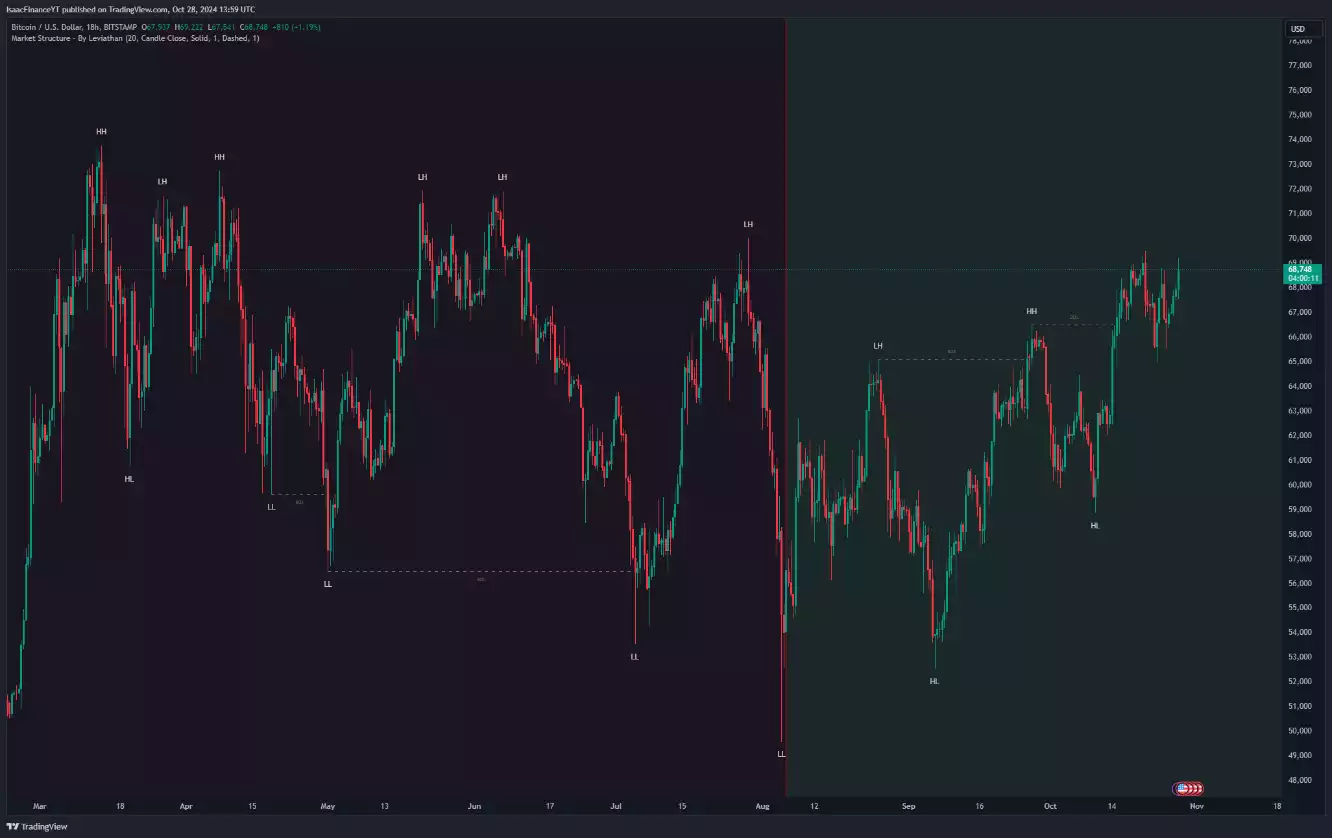
Bar Structure and Bullish Market Structure
The market shows a clear bar structure on the left and a bullish structure on the right. As long as this technical bullish structure holds, it’s likely to lead to an upward impulse followed by a liquidity boost. If liquidity does not follow, it may indicate a false breakout, potentially leading to a range re-entry. Overall, Bitcoin’s price action looks bullish for the coming months, making it an exciting time to monitor the markets closely.
Watch the most recent video presentation of Bitcoin Analysis: Beyond the Block where we share some of these explanations in a panel format, and join the discussion on our YouTube Channel here:
We will return with a more detailed analysis of everything Bitcoin next month, including more market analysis, on-chain metrics, sentiment, and technical analysis…
Isaac Ho | Independent Research Analyst
The Ainslie Group
x.com/IsaacsDevCorner
Share this Article:
Crypto in your SMSF
Top Movers
Get Started Trading Crypto with Ainslie.
Join Thousands of satisfied customers who trust Ainslie for their cryptocurrency and bullion needs.


