Bitcoin Report – November 2024
November 26, 2024
Today our Independent Research Analyst, Isaac Ho from the Ainslie Research Team, brings you the latest monthly deep dive specifically on Bitcoin – including market analysis, on-chain metrics, sentiment, and technical analysis. He highlights some of the key charts that were discussed and analysed by our expert panel in the latest Beyond the Block episode and expands upon his work with some additional insights. We encourage you to watch the video of the original presentation if you haven’t already.
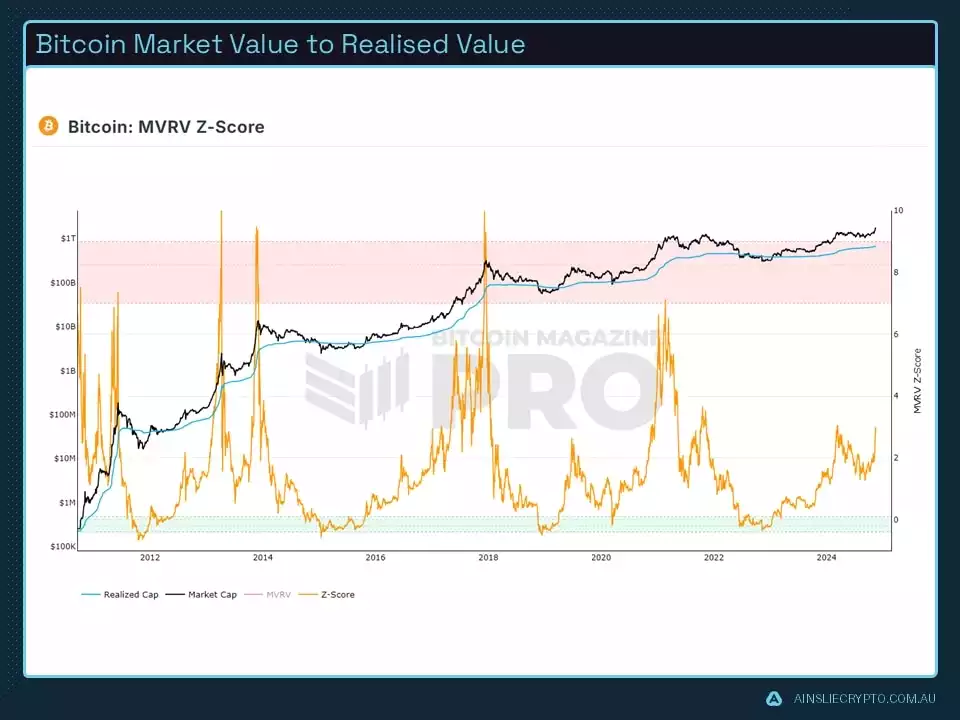
Since the last update, the price of Bitcoin has skyrocketed to nearly US$100k. This has subsequently pushed the MVRV ratio back up to where it was previously at the start of the year. We’ve been discussing the rebasing period for a while, and we are now seeing the outcome of that. The price is significantly higher, yet the MVRV ratio is only at the same level as it was at the start of the year. This is very bullish and suggests that we can rally much further without creating a large deviation. That being said, we have already experienced a substantial increase. Looking at historical data, the MVRV ratio can climb much higher. The initial target being monitored is around the 4.5 region but will be constantly re-evaluated based on the health of the move based on other metrics.
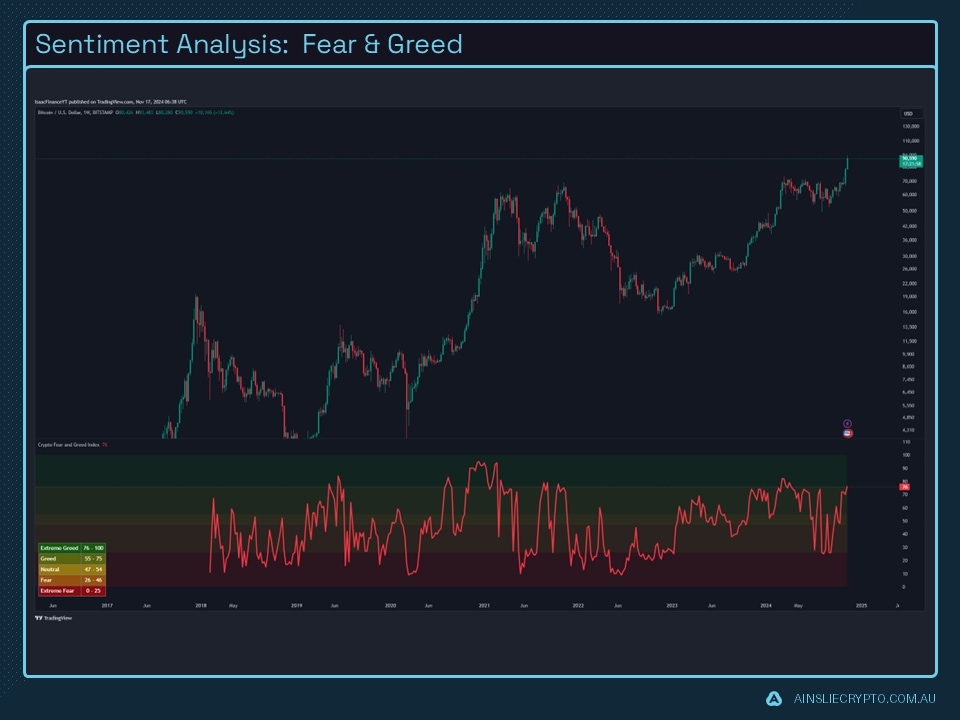
We have observed a very choppy Fear and Greed Index, which has been notably bullish. This is because large swings in sentiment generally indicate that a “washing out” has occurred. Keep in mind that this pattern has persisted for around seven months, so an upside is expected to materialize over time.
What does this mean moving forward? With the Fear and Greed score now back to elevated levels and considering where we are in the cycle, it’s likely to remain high for some time. This doesn’t mean dips won’t occur, but looking at previous cycles and their behaviours, it’s evident that in the latter stages of a bull run, sentiment tends to lean heavily toward greed. This suggests the current elevated sentiment may persist for an extended period.
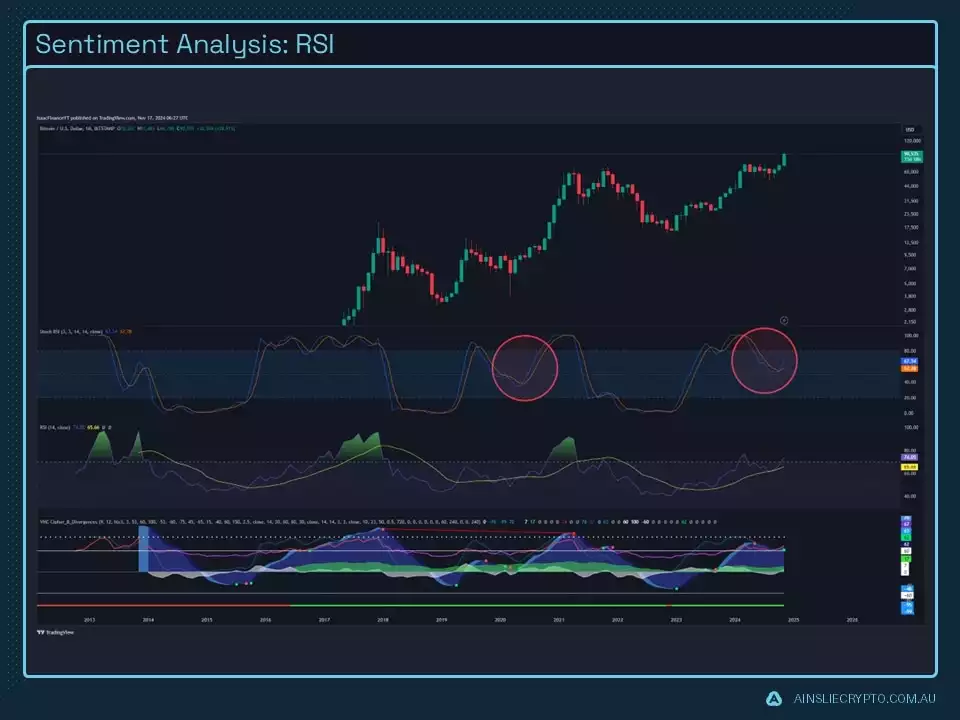
Moving to the RSI cycle chart, it’s evident that we are forming a pattern similar to the 2019 bull run, now in terms of similarity the timelines are different, meaning this cycle is seeing the RSI flip a lot later as opposed to the other cycle, whether this is bullish or a potential warning is yet to be determined, however based on previous cycles it can likely be seen as a bullish Stochastic cross over which is currently offering some large price gains. If we start to see it roll over again that would signal some bearish momentum and would be very concerning, but as of now, it is on track.
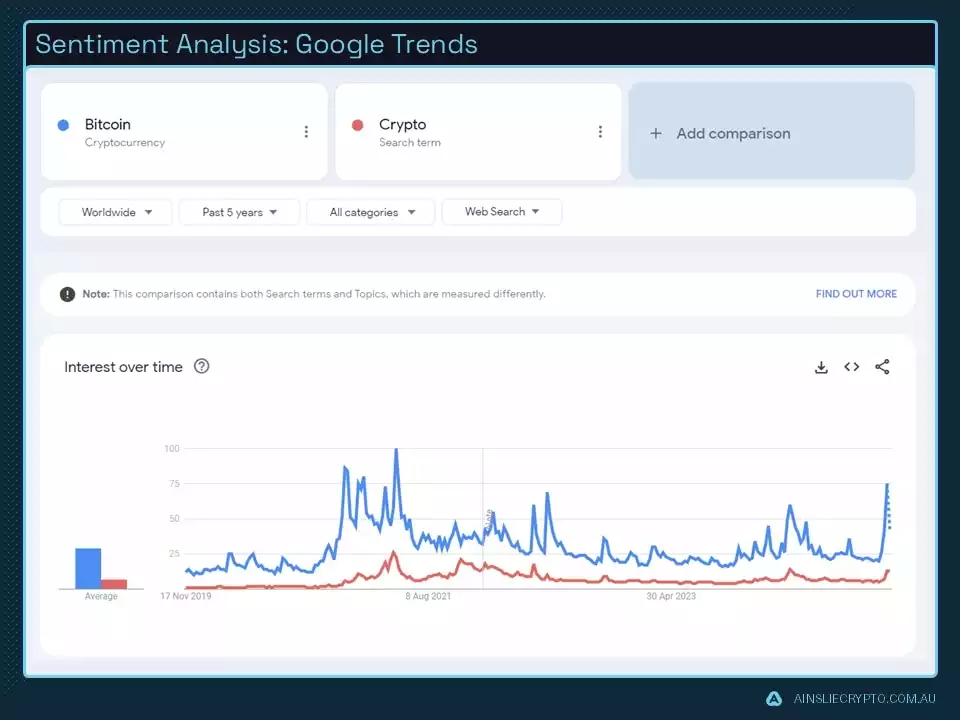
Google Trends has behaved exactly as expected. As the price surpassed all-time highs, we saw a massive increase in retail interest, typically reflected through a surge in Google searches. As we enter the latter stages of the bull market, it’s expected that this interest will hover at a higher, sustained rate. This would indicate consistent engagement from retail investors, similar to what occurred during the last bull cycle.
This sustained retail interest is crucial for driving prices higher, as most smart investors are already positioned. The next major catalyst for higher prices is likely to be mass FOMO (Fear of Missing Out) from retail money.
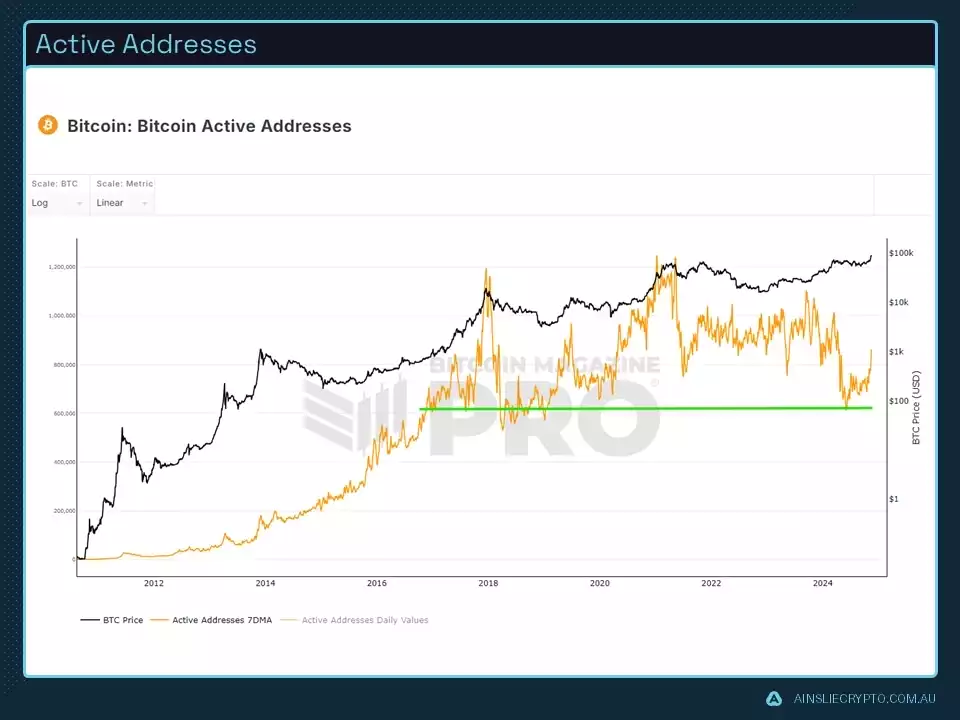
This metric has proven to be quite insightful, offering some very interesting observations. The green support line represents a level where active addresses have typically found support, and we observed this coinciding with the local bottom of this large trading range. Until the bull market ends, we will likely not see active addresses drop below the support line.
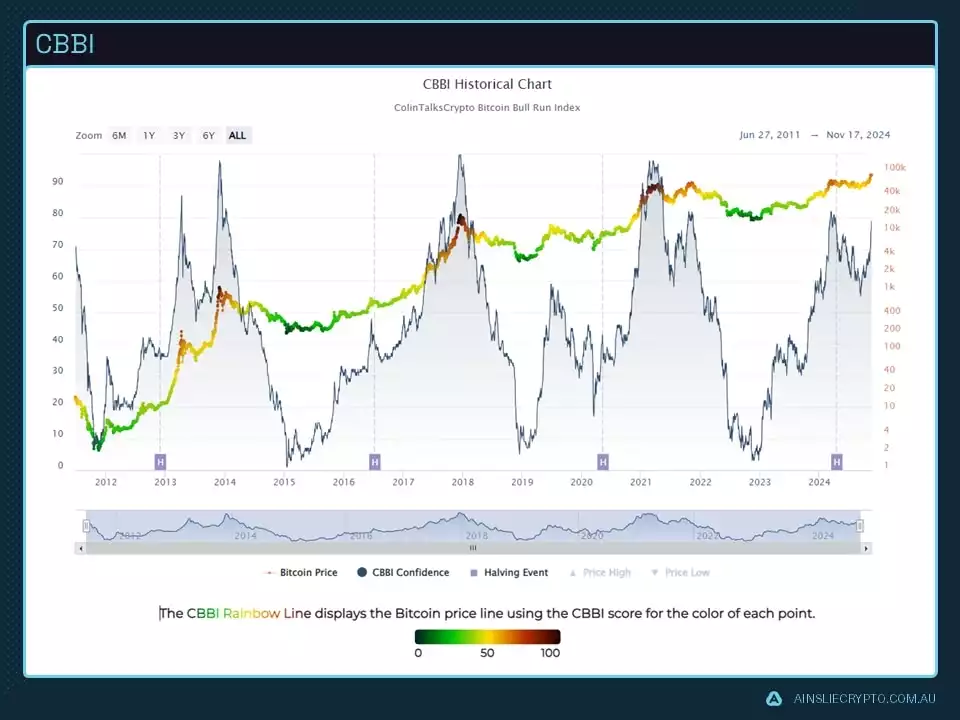
The CBBI metric is in the heated section; however, we are not yet in the 90 region, which is typically when top signals start to present themselves. This may reach the high 95+ range, however, we will likely enter the 90 region toward the end of the cycle. In terms of timing, that will depend on how heated the market becomes.
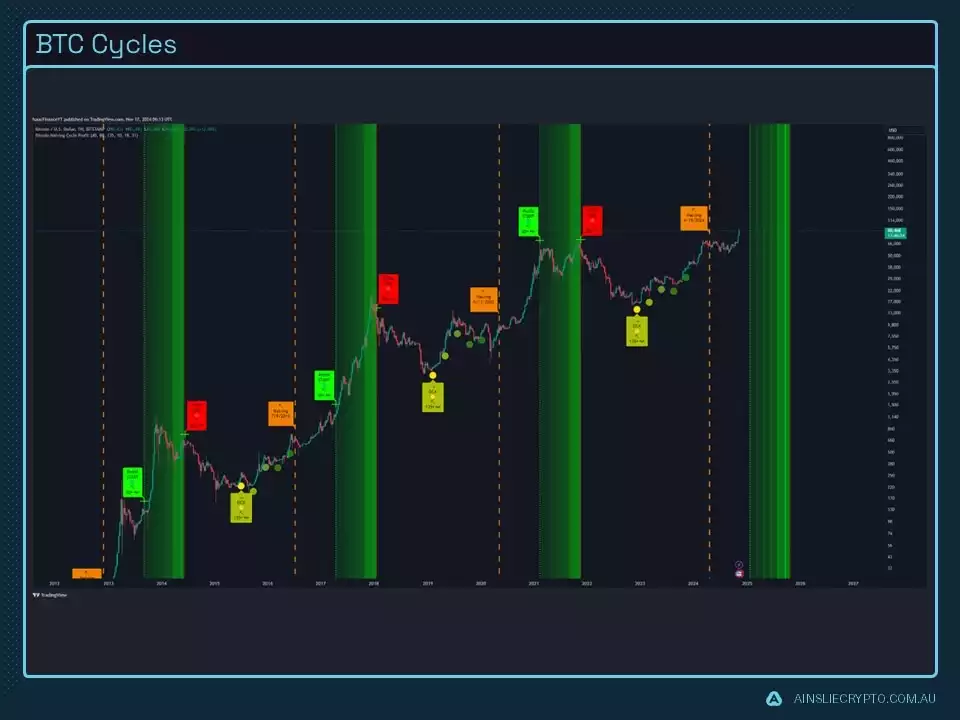
Shifting to the Bitcoin Cycles indicator, we are now at a stage in the market where major price appreciation is expected—and we’ve already started to see this happening. The green zones represent areas where we should shift our bias to a more bearish stance, which typically translates to taking profits or dollar-cost-averaging (DCA) out.
At this point in the cycle, the focus should be on holding rather than buying, as a significant portion of the move has already been missed. The risk of Bitcoin reaching US$100,000 and then experiencing a sharp decline is relatively high. That said, everything seems to be progressing as expected. However, if global liquidity fails to align with Bitcoin’s momentum, we might see a potential top earlier than anticipated, especially if it’s accompanied by a blow-off top scenario.
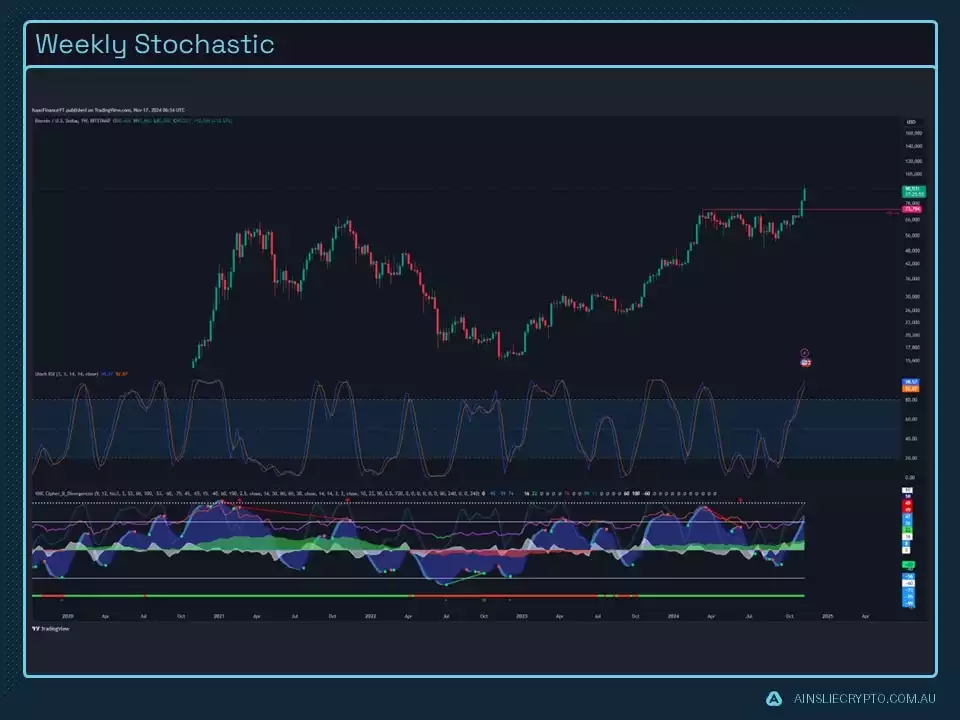
Looking at the weekly stochastic, we are certainly pushing higher. One important observation is that we can remain in the extended upper bands for longer than expected. This behaviour is typical during bull markets and often discourages traders from attempting to time-swing trades based on stochastic flips.
The volume profile clearly shows that we have broken out of the previous range and a bull flag. In hindsight, this breakout seems obvious, although it took much longer than many had anticipated. That said, the pattern is unfolding quite well, and the previous range will serve as a strong support level when the inevitable bear market arrives. For now, it’s blue skies ahead, and the price is surging, leaving that range firmly in the past.

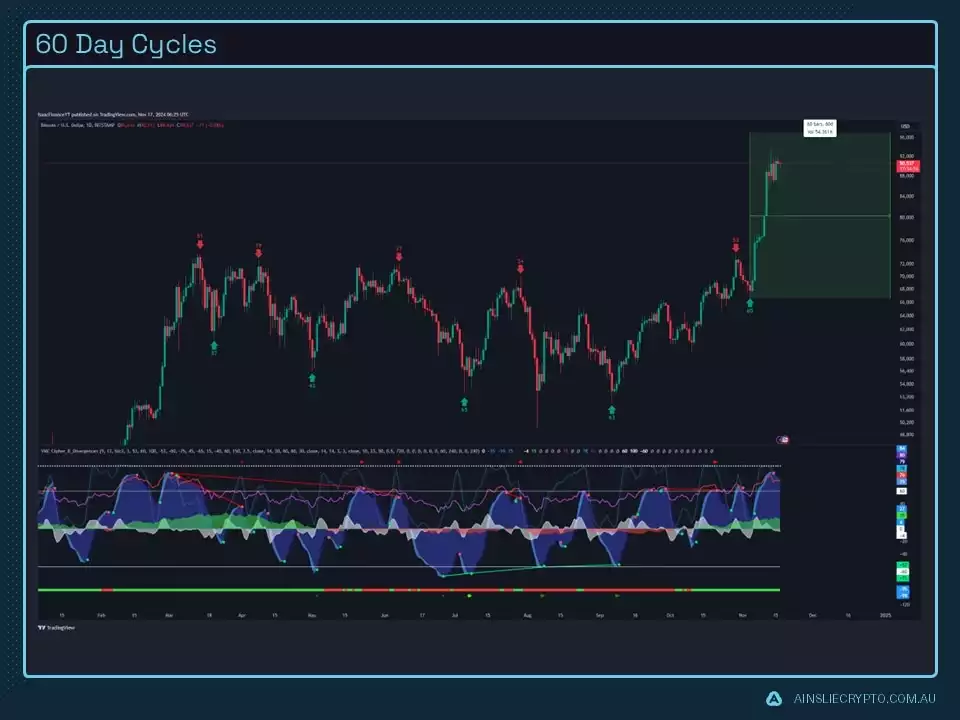
Looking at the 60-day cycle, we’ve experienced a very rapid run-up. There are still many days remaining before we reach the next 60-day cycle peak, which leaves plenty of room for the price to move higher and potentially break the US$100,000 level.
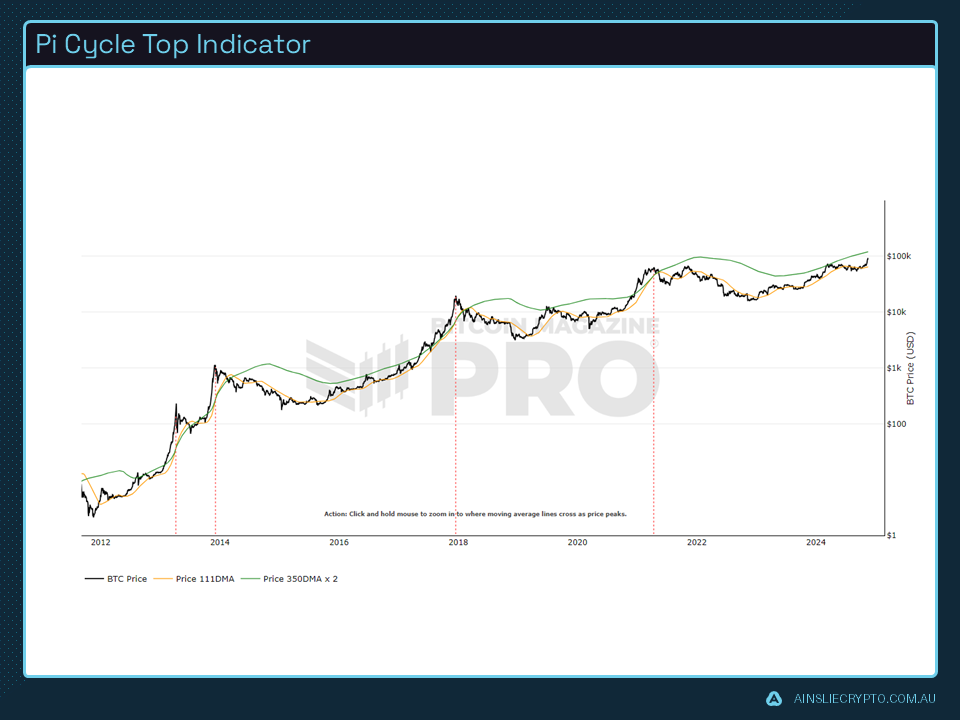
The Pi Cycle Indicator is still not signalling that a top is near. In fact, it remains one of the bullish indicators suggesting there is still significant price appreciation ahead. While it’s unclear whether a Pi Cycle top will be triggered this time, it’s certainly something we’ll be monitoring closely to help time the market’s peak.
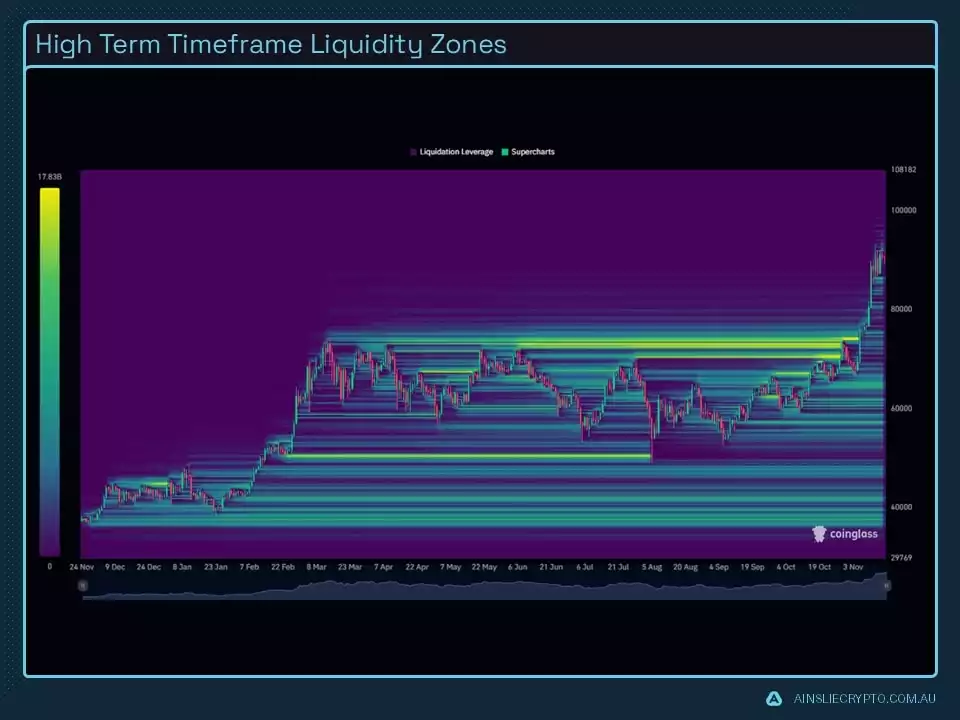
Turning to liquidity, this has been one of the key metrics we’ve relied on extensively. We’ve observed that prices are often drawn to large liquidity nodes, a pattern we’ve seen play out both to the downside and the upside, with these levels being identified in advance. Currently, there isn’t as much liquidity on either side compared to what we saw during the seven-month range. However, there are smaller liquidity bands above and below the current price, with a significant liquidity band around the US$100,000 level. This suggests we might encounter resistance at that key cyclical level.
Watch the most recent video presentation of Bitcoin Analysis: Beyond the Block where we share some of these explanations in a panel format, and join the discussion on our YouTube Channel here:
We will return with a more detailed analysis of everything Bitcoin next month, including more market analysis, on-chain metrics, sentiment, and technical analysis…
Isaac Ho | Independent Research Analyst
The Ainslie Group
x.com/IsaacsDevCorner
Share this Article:
Crypto in your SMSF
Top Movers
Get Started Trading Crypto with Ainslie.
Join Thousands of satisfied customers who trust Ainslie for their cryptocurrency and bullion needs.


