Bitcoin Report – September 2024
September 19, 2024
Today our Independent Research Analyst, Isaac Ho from the Ainslie Research Team, brings you the latest monthly deep dive specifically on Bitcoin – including market analysis, on-chain metrics, sentiment, and technical analysis. He highlights some of the key charts that were discussed and analysed by our expert panel in the latest Beyond the Block episode and expands upon his work with some additional insights. We encourage you to watch the video of the original presentation if you haven’t already.
Over the past month, Bitcoin has remained very stable, with prices staying at relative levels compared to last month. We’ve said this a lot and will say it again: this type of range-bound trading is a rebasing period for Bitcoin. This can be visualised through the MVRV Z score, which denotes the relationship between market price and realised price, acting as a proxy for the average price at which Bitcoin is held.
The more we range, the more Bitcoin is traded at a certain price point. This is why, even though the price is stable, the realised price is still rising (blue line). This is subsequently causing the Z score to fall, resembling a pattern eerily similar to the 2019 bull cycle. They say history doesn’t repeat exactly, but it rhymes.

The CBBI chart combines various metrics, such as moving averages, RSI, and Pi cycle indicators, to gauge market conditions. Historically, a CBBI score of 90 or higher has coincided with the peaks of previous bull markets. Currently, the score sits at 60, indicating that the market is not overly heated. Earlier in the year, when Bitcoin reached an all-time high of around US$72,000, the CBBI briefly suggested a level closer to US$82,000. However, it’s still unlikely that US$72,000 marks the true cycle peak, given the broader macro, technical, and on-chain perspectives.

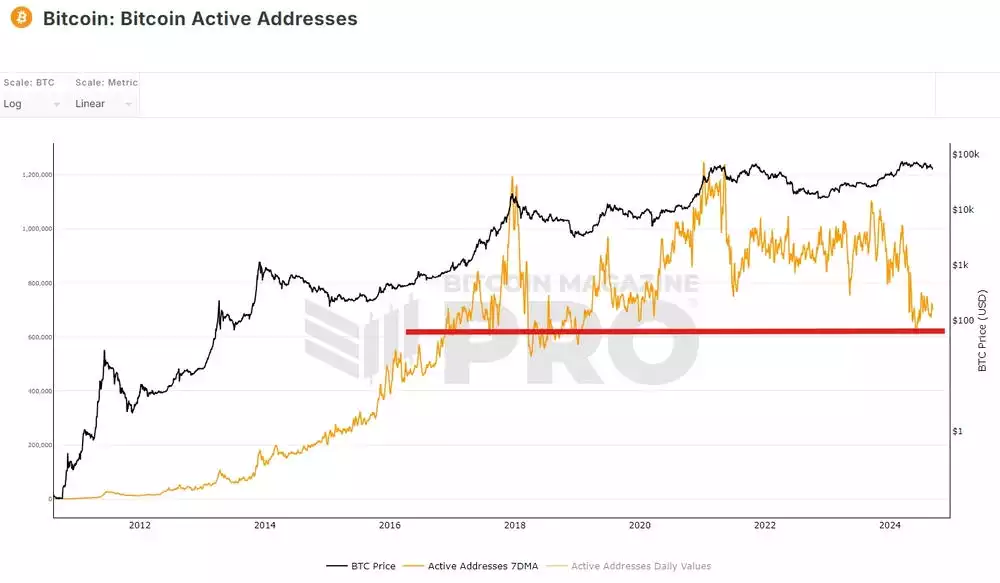
Looking at Bitcoin’s active addresses, we can see that it has potentially found a bottom. We’ve drawn a red support line that seems to have strong support. Whether this is valid is yet to be proven, but this will be a key metric to look at as the market top generally coincides with a large rush of active addresses. Vice versa, when prices are declining or finding a bottom, active addresses are low.
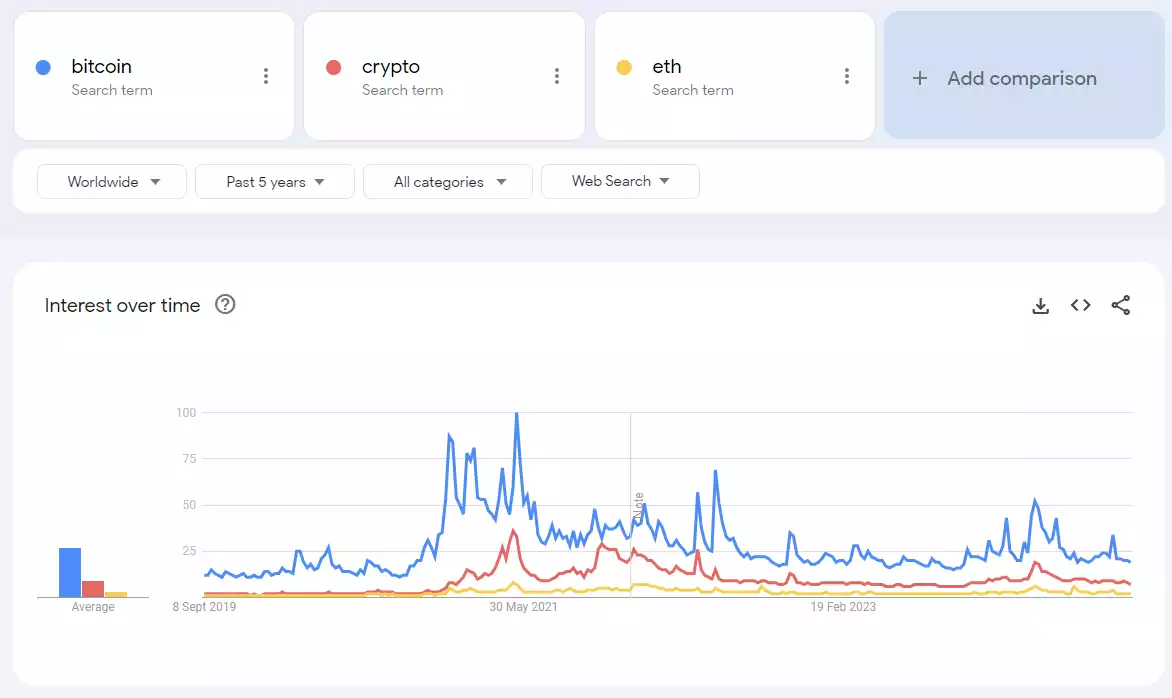
Moving on to Google Trends, the search volume has been lacklustre over the past few months, with little to no interest being shown from retail. The catalyst that could spur this higher is a large increase in Bitcoin price, which will most likely occur in the latter months of this year to the start of 2025 as Bitcoin tracks global liquidity and other major assets like gold, which is ready at all-time highs.
Moving on to the fear and greed index, it’s very clear that we have experienced very choppy readings over the past months. Unlike the previous cycle, where there was one singular large increase in fear followed by a more linear increase to the euphoric stage, what we have seen with the current price action is a very choppy fear and greed metric. This often represents a rebasing zone, washing out weak hands and setting up for the next leg higher. Going off the halving periods, Bitcoin tends to consolidate a few months after before starting to skyrocket higher. If we follow previous cycles, we should be seeing the price increase relatively soon, especially if it tracks global liquidity, as the correlation is very high.

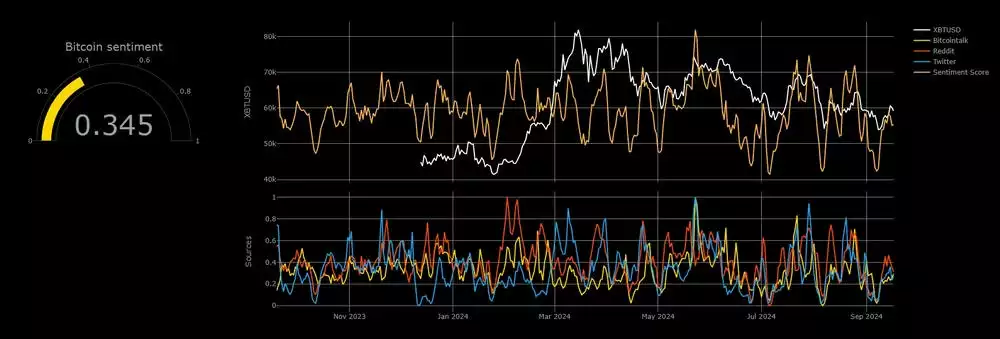
Moving to the short-term sentiment, this metric has proven to be very accurate in predicting the lows and highs of the market on a short-term timescale. We had a very low point a few days ago while recording the video for Beyond the Block. Since then, we have seen a price increase, but nothing stellar. Regardless, this serves as a contrarian play on the short-term periods. Currently, it’s sitting at a very neutral or more bearish level, which leads me to the opinion that we could be potentially pushing higher. However, the market is very choppy and undecided, with most of the metrics pointing to indecision/leaning more bullish.
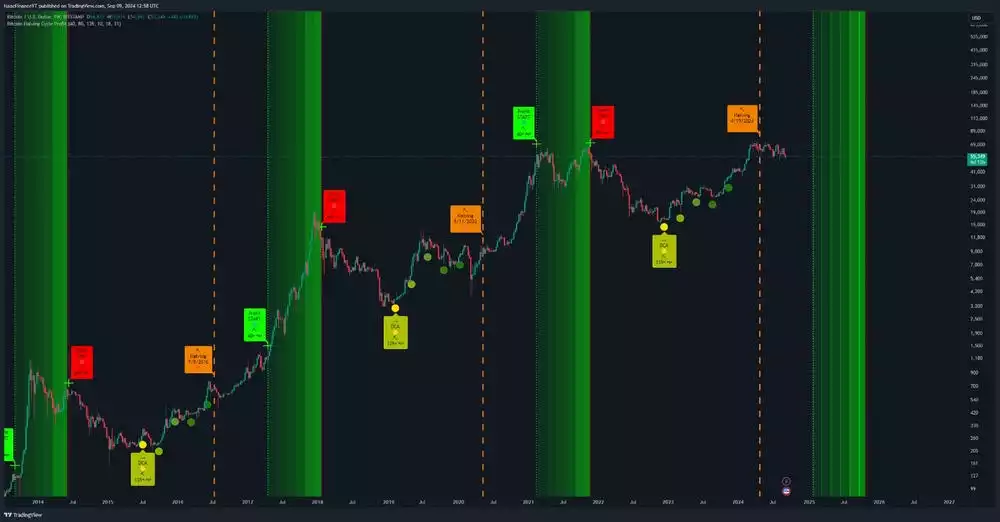
This indicator has been one we’ve brought to every episode. It shows an ideal time that would have been to buy, the halving, and the time to switch to the more bearish outlook. While in this intermediary zone post-halving and pre-market cycle top, Bitcoin tends to skyrocket in this region. We haven’t yet seen that price action, which is a little alarming. However, global liquidity hasn’t yet skyrocketed, which we expect to happen soon. That being said, the green zone will be a level to switch the bias from bullish to bearish.
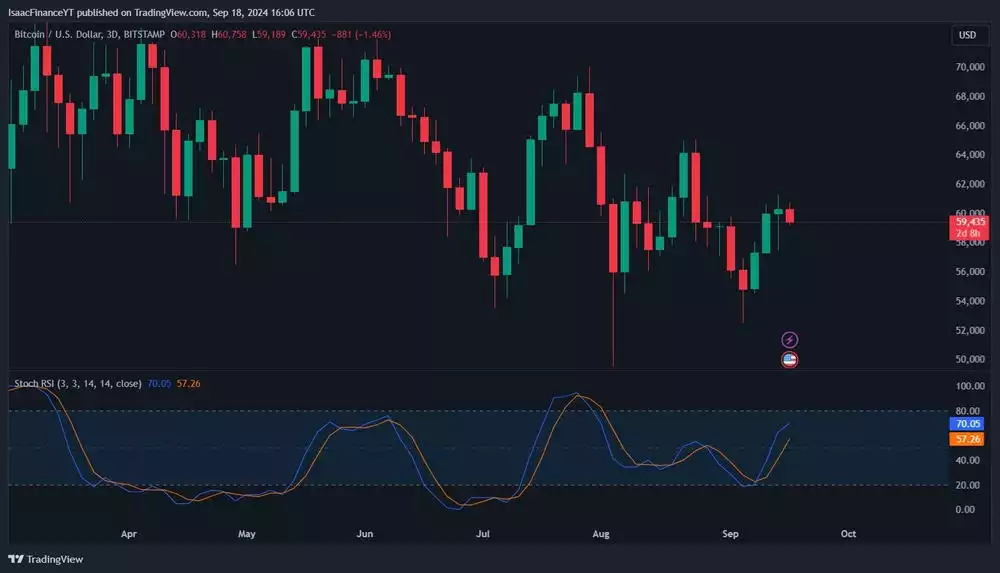
Moving to the weekly stochastic, we can see price has been very indecisive, with the static band in the lower region unable to reach the upper band. This suggests the market is very uncertain and range-bound. It’s hard to formulate a long-term bias, which the weekly usually gives when we are trading in such a manner. That being said, the underlying macro regime is bullish.

The three-day chart shows a clearer picture, but on the smaller time frames, you can see a static followed by a small rise, now potentially reversing on the other side. With the current price action behaving as it is, these indicators are not overly helpful, so we will not be putting much weight on them.
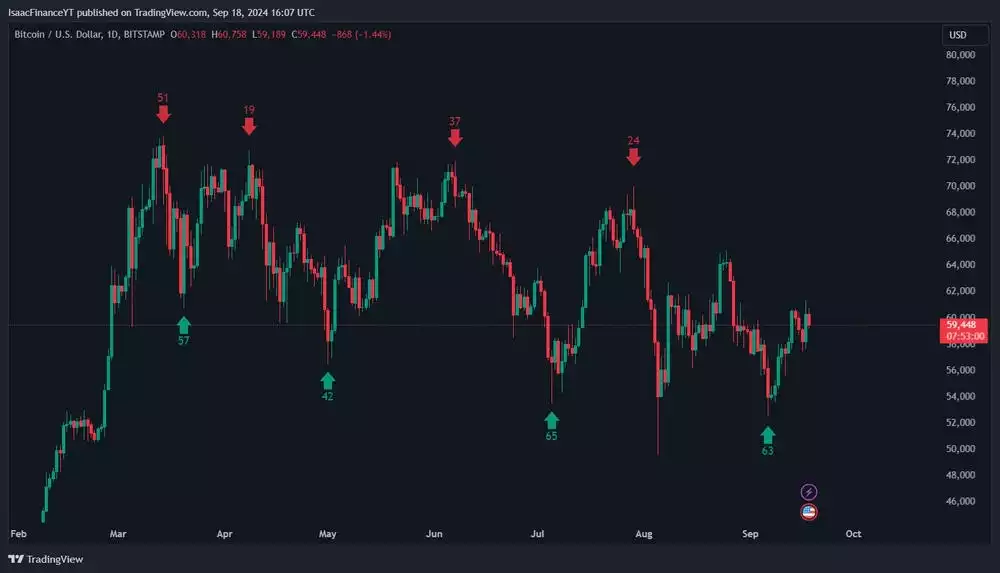
The 60-day cycle offered a nice little trade so far. Whether the 60-day cycle offers much more upside potential is still undecided. However, we do seem to be forming a bullish flag, also known as a bull flag, which tends to contract on a diagonal angle. This cycle might not run up to the all-time highs but rather track back down to contract this bullish flag for the next 60-day cycle.
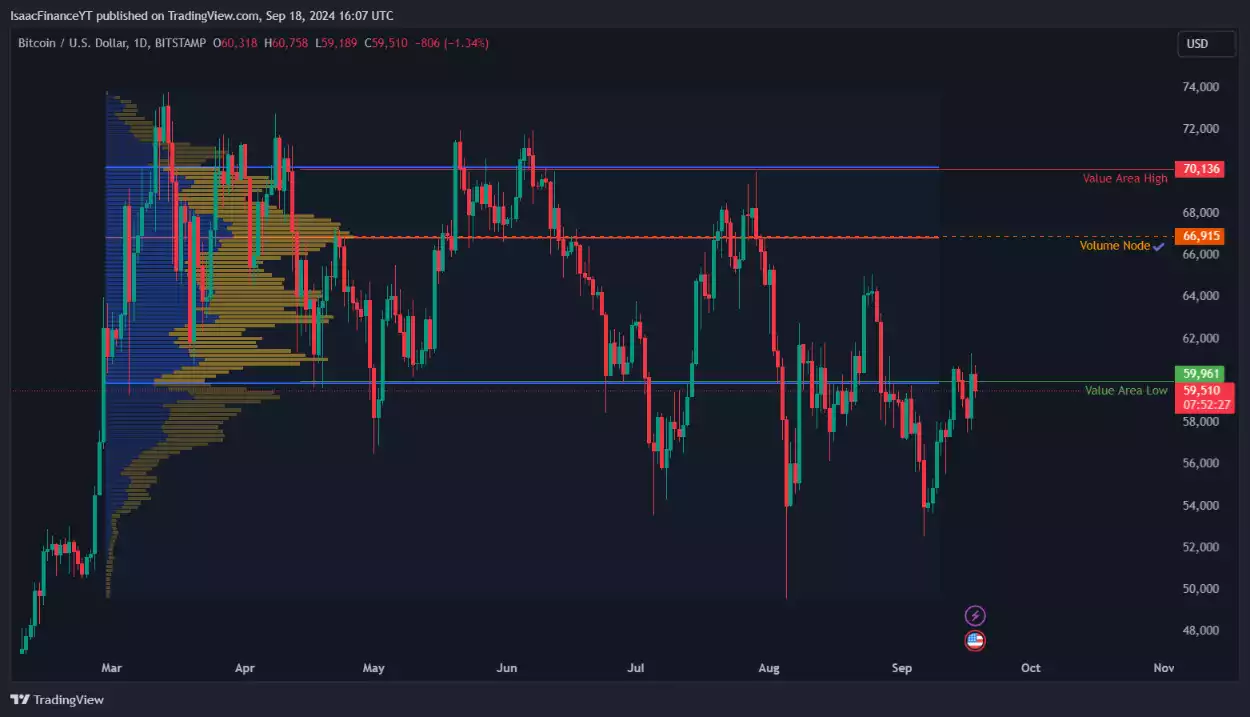
The volume profile has proven to be a very useful technical tool, providing insight if we are in or out of previous ranges. Currently, we are finding resistance on the value area low of the range we have been in since around March at the start of this year. Almost a year-long range getting acceptance back into this range will be bullish, which will need to involve daily closes above the value area low. If we do not see that but rather see a rejection at this level, that will be midterm bearish with the expectation of lower prices. That still doesn’t change the global liquidity backdrop but rather delays Bitcoin’s potential growth.
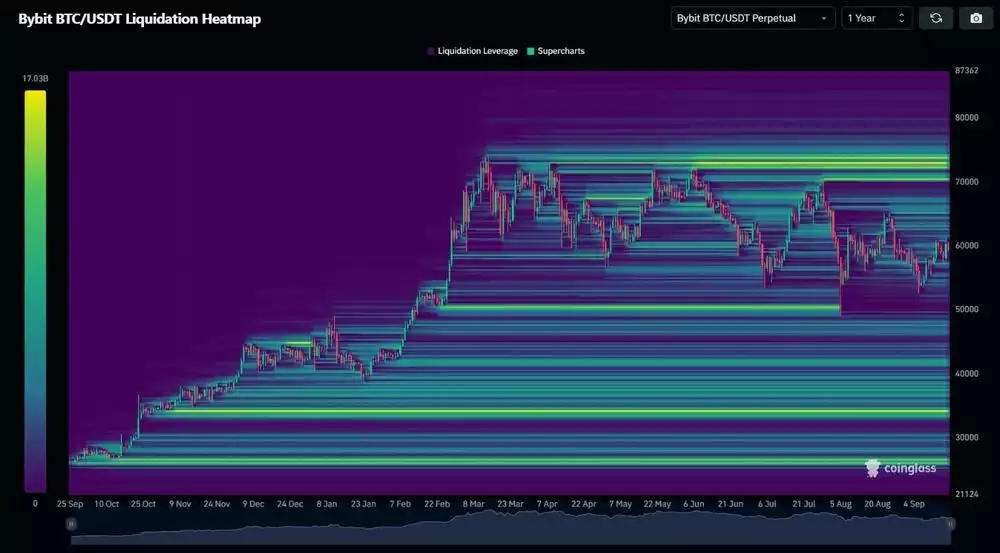
The liquidity heat is showing something we haven’t seen in a while, which is a very illiquid zone with no major liquidity levels to the upside or downside on a closer price range. Rather, the liquidity levels are at an all-time high level or looking down lower to the US$40,000 region. So, the magnet is definitely on the upside, and with the global liquidity the backdrop may be pushing higher, the fear and greed index fearful, and people very uncertain of where the market is heading, we could be taking out the liquidity at US$74,000 and continue to shoot for higher prices as we go into 2025. Until then, we can only speculate with the tools we have, which all seem to suggest a similar story. Check out the latest Beyond on the Block episode to get all the information on this month’s update.
Watch the most recent video presentation of Bitcoin Analysis: Beyond the Block where we share some of these explanations in a panel format, and join the discussion on our YouTube Channel here:
We will return with a more detailed analysis of everything Bitcoin next month, including more market analysis, on-chain metrics, sentiment, and technical analysis…
Isaac Ho | Independent Research Analyst
The Ainslie Group
x.com/IsaacsDevCorner
Share this Article:
Crypto in your SMSF
Top Movers
Get Started Trading Crypto with Ainslie.
Join Thousands of satisfied customers who trust Ainslie for their cryptocurrency and bullion needs.


