Bitcoin Report – June 2024
June 18, 2024
Today our Independent Research Analyst, Isaac Ho from the Ainslie Research Team, brings you the latest monthly deep dive specifically on Bitcoin – including market analysis, on-chain metrics, sentiment, and technical analysis. He highlights some of the key charts that were discussed and analysed by our expert panel in the latest Beyond the Block episode, but also expands upon his work with some additional insights. We encourage you to watch the video of the original presentation if you haven’t already.
Following last month’s update, we haven’t observed any dramatic change in the MVRV Z score. However, the realised price is steadily rising, indicating significant trading and exchange of hands within the price range of US$74k to US$65k. This can be viewed as bullish, as the market is establishing a new value area below the previous all-time high, which should act as strong support once breached to the upside.
Another key insight is that we haven’t yet entered a phase of euphoria typical of previous cycles. This is expected at this stage in the 4-year cycle, but we should start to anticipate some volatile and upward-trending market action in the coming months. That said, we may not see explosive growth but rather gradual, consistent capital flows similar to ETF flows. Essentially, retail investors might not enter as aggressively as in previous cycles, and demand may be more ETF-driven, with more institutional bodies entering the market.
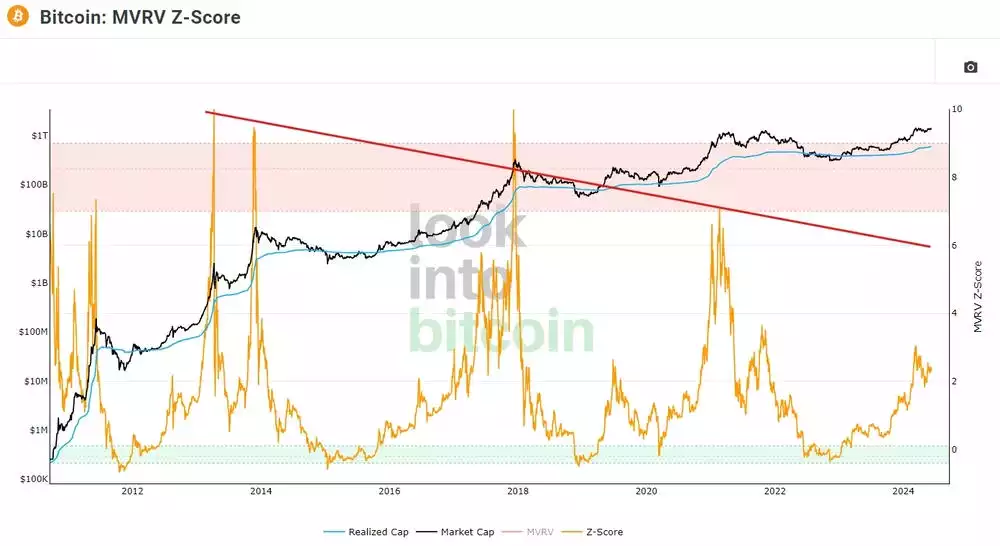
The combination chart indicates that we are cooling off and are in the post-halving consolidation phase. This is typical after every halving period, where the market ranges for 2-3 months before the onset of extreme price appreciation, marking the latter half of the bull run. Currently, we are sitting at a score of 70, which is expected at this price range.
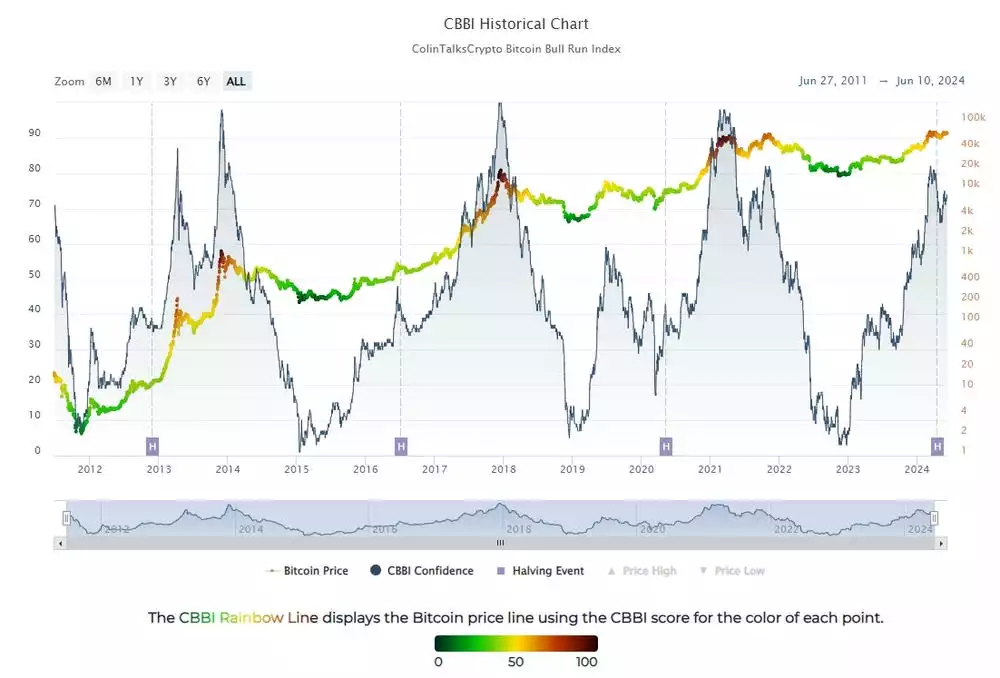
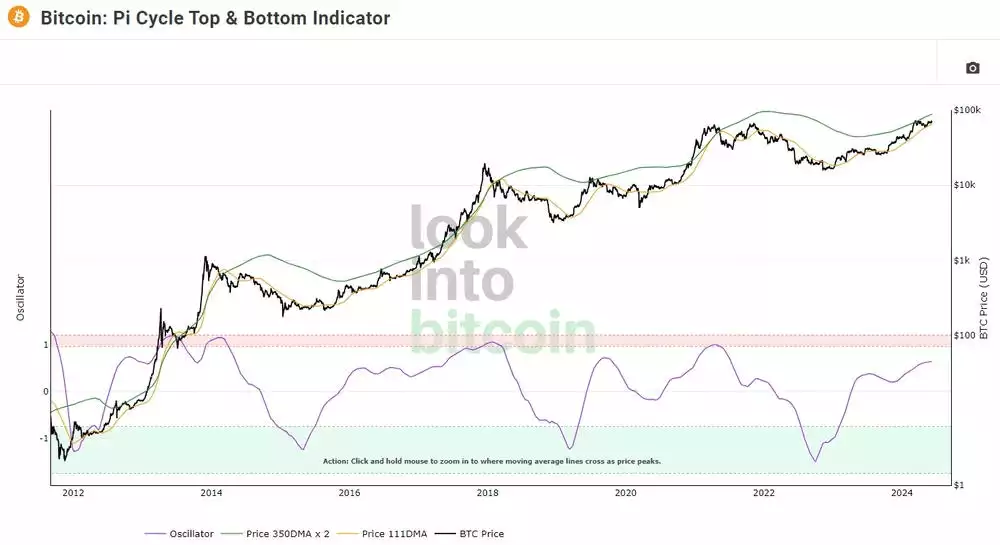
The Pi Cycle indicator suggests that we are nearing the time for a significant price increase, as the green and yellow lines are starting to converge. This observation aligns with our timing analysis, which we will explore further in this article. The oscillator captures this trend perfectly, illustrating periods of undervaluation and overvaluation.
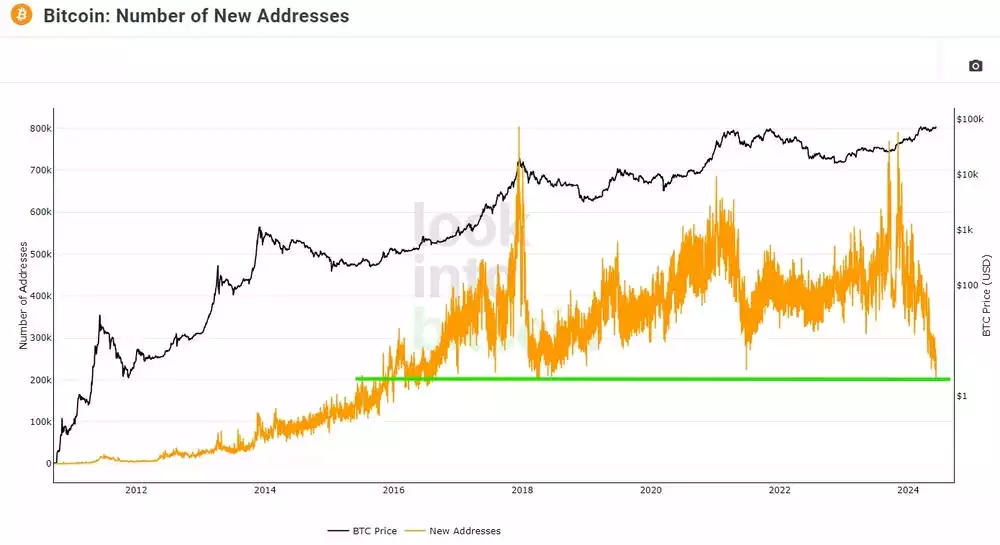
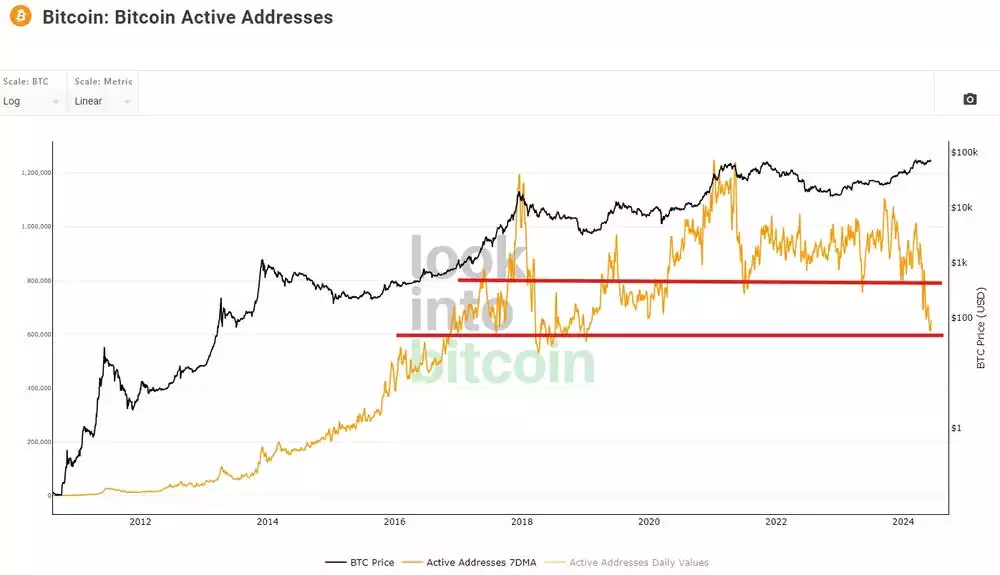
The address metric indicates that the number of new addresses is on the decline, potentially signalling a market bottom at the current price. The chart shows exponential growth in new addresses from Bitcoin’s inception to 2018. Since then, we have seen consolidation, with address growth peaking at around 800K, suggesting a slowdown in adoption. However, the price can still increase significantly.
It’s important to note that ETF demand will not appear in this metric, as ETFs do not need to create new addresses to purchase Bitcoin. Essentially, this chart reflects interest in Bitcoin: when the market is heated and interest is high, the number of addresses increases; conversely, when the market is in decline and interest wanes, the number of addresses decreases.
The same observation applies to the active address chart. It visualises on-chain activity, reflecting the level of interest based on how many market participants are actively trading and moving funds around the blockchain.
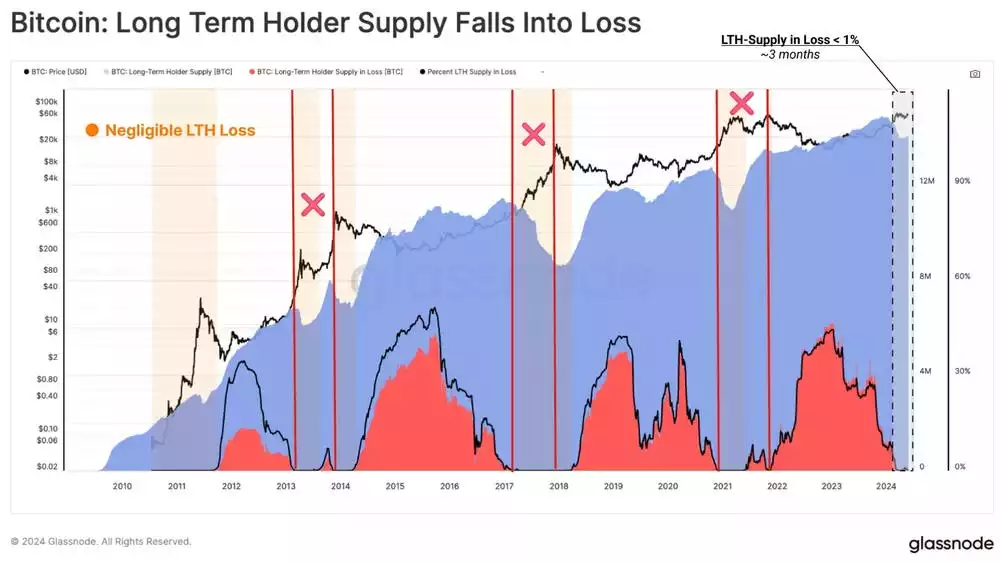
The long-term hold supply chart indicates that a significant number of long-term holders are currently seeing substantial profits. This suggests that the market top might occur within the next 6 months to a year, placing it around mid to late 2025. The start of the red line represents when most holders are in profit, and the end marks the market peak, typically lasting 6 months to a year. During this peak phase, we often see significant euphoria and long-term holders beginning to take profits, signalling a potential market top.
At that point, it’s crucial to shift from a bullish to a more bearish bias. Currently, we are just entering this phase, so it’s not yet time to change strategies. However, it is something to monitor closely as the market progresses.
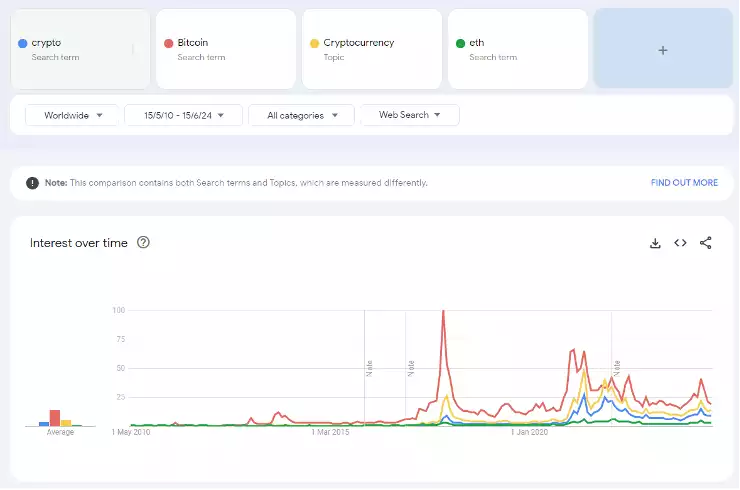
Google Trends data shows a significant decline in interest, with levels returning to those seen before the ETF introduction and the all-time high. This is bullish most likely because the price has remained strong, especially considering our current position in the 4-year cycle. The key question on every analyst’s mind is what will bring retail investors back into the market.
This resurgence could be driven by several factors, but a major catalyst might be retail investors starting to view Bitcoin as a genuine hedge against both consumer inflation and asset price inflation. Notably, the only assets that have outperformed the global liquidity influx are tech stocks and Bitcoin.
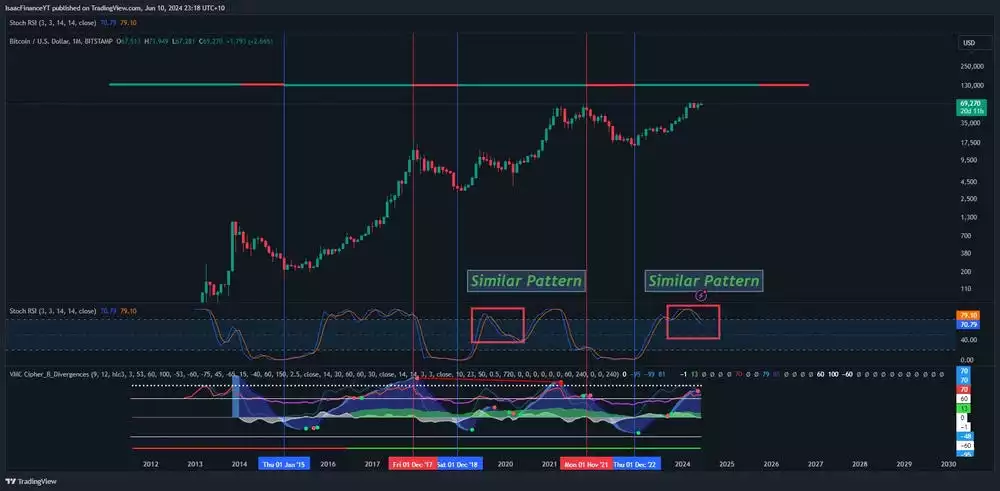
Below is a chart highlighting the Bitcoin cycles, with the market phase in green and the bear market phase in red. Currently, we are in the midst of the market cycle, right in the middle, and are seeing a similar pattern emerging in the stochastic RSI, which is down trending. While this can be viewed as bearish, it could also be seen as potentially bullish.
It’s anticipated a pattern similar to the 2017-2018 bull market, where the stochastic RSI continues to trend downwards for a few more months before reversing towards the latter end of this year, leading into a euphoric phase next year. This expectation aligns with the outlook for more consolidation, as discussed in the recent episode of ‘Beyond the Block’.
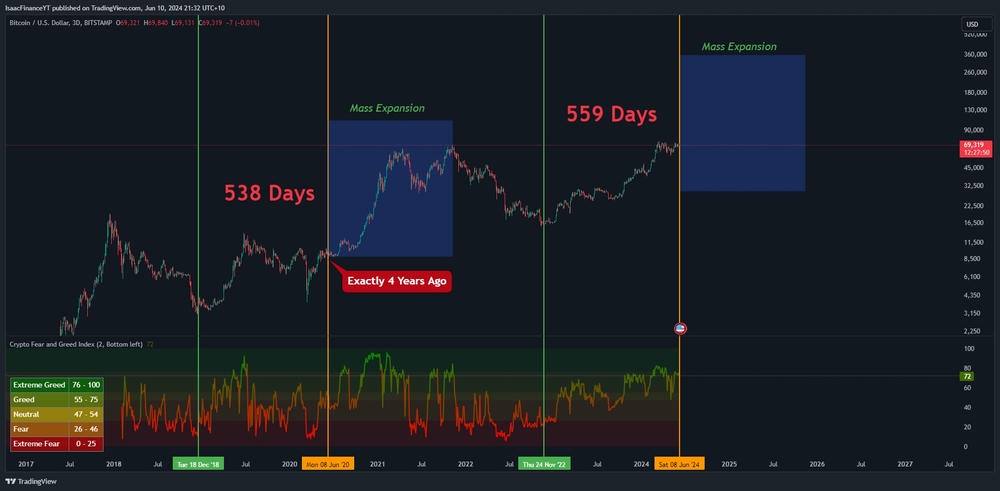
Moving on to sentiment, the longer-term sentiment index indicates that we are still in an overheated region. However, as seen in previous cycles, this overheated state can persist for an extended period. Currently, we are in the mass expansion phase, so in the coming months, we can expect either consolidation or a dramatic price increase.
Looking back at the last cycle, four years ago, we experienced a few months of consolidation followed by significant expansion as equity increased and various metrics pushed upwards. A similar mass expansion is anticipated now, with the macroeconomic backdrop looking bullish for the next year. However, the euphoric growth might not be as intense because people are no longer confined to their homes and receiving stimulus checks. Nevertheless, monetary policy easing and equity measures by governments and central banks will continue to inject money into the system.
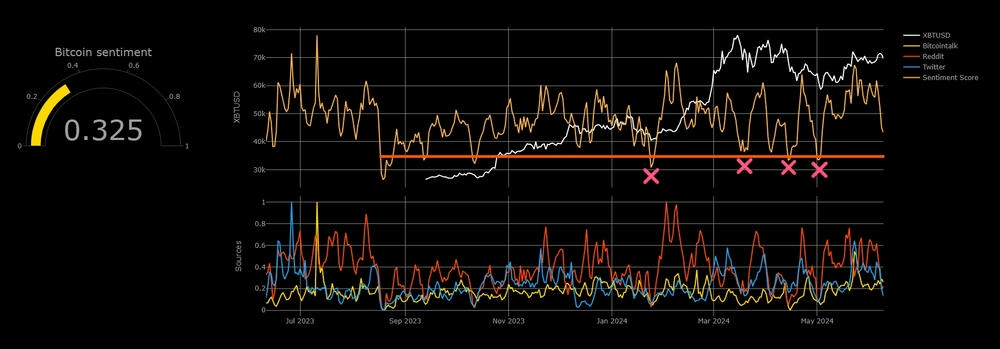
Short-term sentiment indicates that we may have entered a market low recently, potentially signalling a reversal in the coming days. This observation is based on the 60-day cycle pattern. As discussed in the video, specific price targets, such as the US$65K region, are crucial. Once this metric hits a low on the index, we should expect a reversal.
Additionally, the red crosses on the chart, such as example 5, highlight points where the index has crossed below a critical threshold. This typically signifies a very bearish sentiment on platforms like Twitter, Reddit, and various crypto forums, which often marks a local bottom. This analysis pertains to the short term and should be kept in mind.
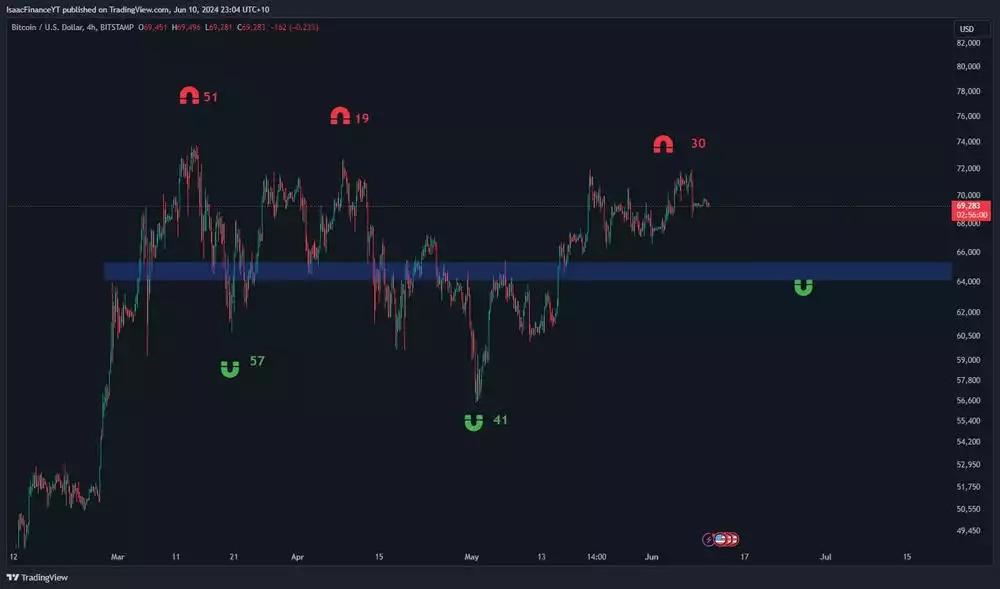
As at the time of writing, the Bitcoin price stands at US$69,283. Based on the analysis of the 60-day cycles, it is possible the market cycle top for this period has been reached. Based on this a potential downtrend moving towards the blue box region that has been highlighted may be seen in the near future. This area is significant as it aligns with Fibonacci retracement levels (0.618 and 0.5), as well as general support and resistance lines.
If the price reaches this blue box region, it could potentially form a head and shoulders pattern, with a projected target range of around US$85,000 to US$90,000. While I don’t solely rely on patterns, this is something to take into consideration. However, there is a stronger argument that leans towards consolidation or downtrend until we reach the low of this 60-day cycle.
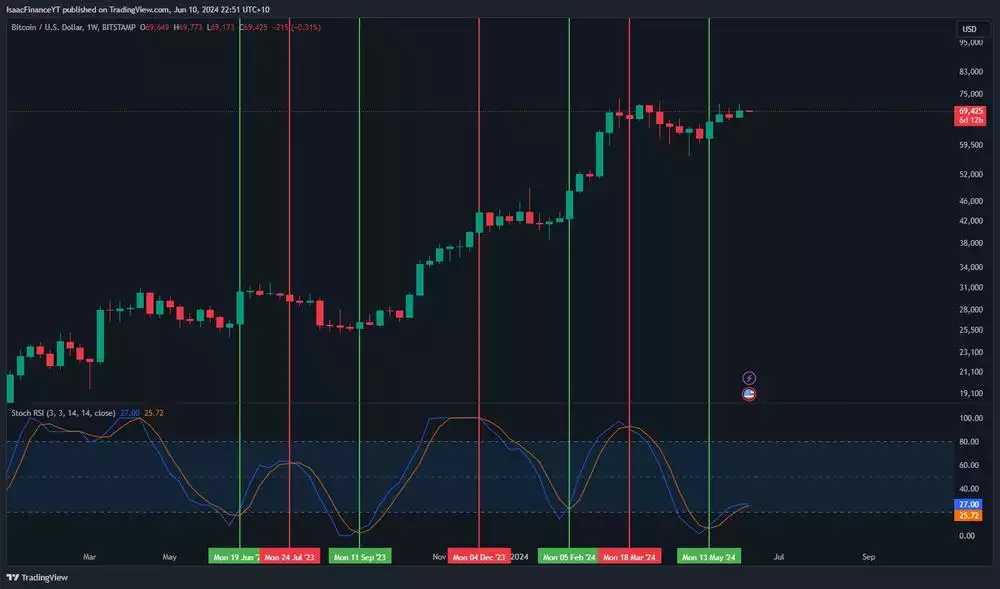
Moving on to the weekly stochastic RSI, we recently observed a green flip, which was discussed and anticipated in the last episode, though it didn’t materialise as expected. Targets of US$72,000 were mentioned, and we have since reached that level. Following this achievement, the stochastic RSI is now peaking, and a period of consolidation is predicted.
This flip isn’t the most bullish as it typically suggests a return to higher regions is unlikely in the near term. Therefore, we could expect to see some consolidation or potentially a move lower towards the cycle low for a second attempt at reaching higher levels in the stochastic RSI.
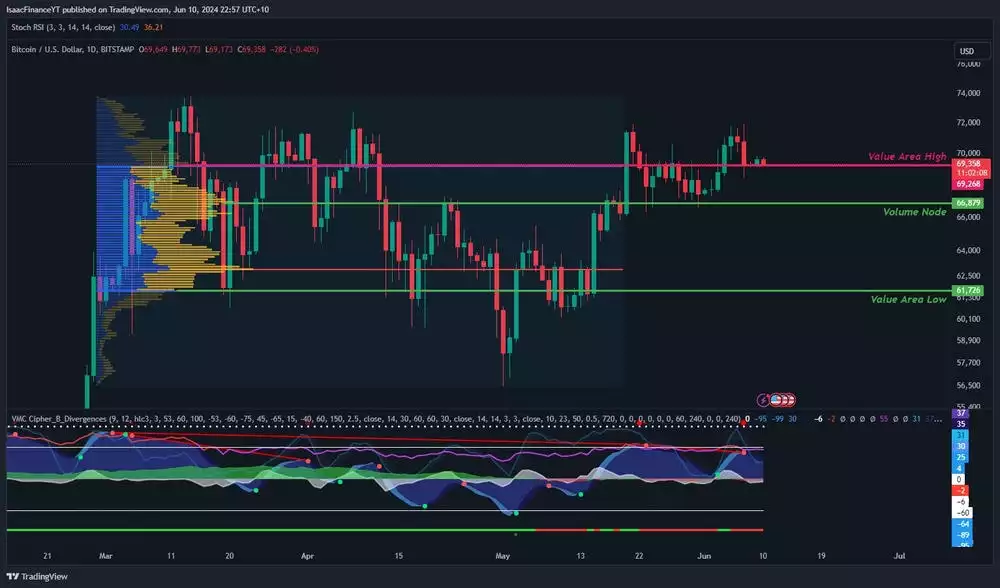
Moving to the daily levels, its anticipated that the price to consolidate between the high and low of the volume value until we approach the target range of US$65,000 to US$66,000, which aligns with the expected 60-day cycle low. At that point, we would reassess and take appropriate action based on the market conditions.
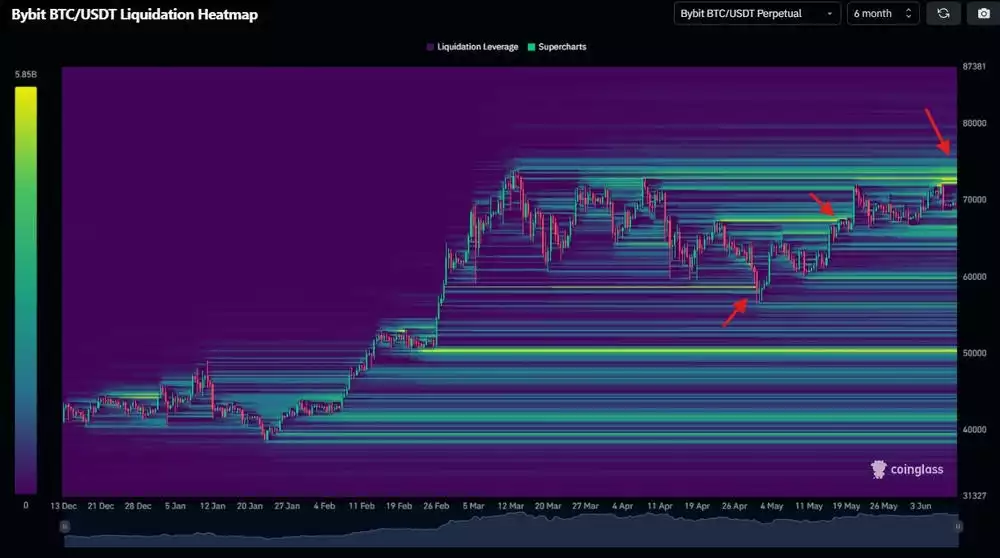
Moving to the liquidation heat map, we observe significant liquidity positioned towards the upside, indicating potential for a short squeeze. Additionally, there is liquidity noted on the lower wicks around US$66,000. Based on this analysis, these liquidity points are expected to be tested, potentially leading to a move towards the expected low around US$65,000 to US$66,000, marking the beginning of a new 60-day cycle.
Watch the most recent video presentation of Bitcoin Analysis: Beyond the Block where I share some of these explanations in a panel format, and join the discussion on our YouTube Channel here.
We will return with more detailed analysis of everything Bitcoin next month, including more market analysis, on-chain metrics, sentiment, and technical analysis.
Isaac Ho | Independent Research Analyst
The Ainslie Group
x.com/IsaacsDevCorner
Share this Article:
Crypto in your SMSF
Top Movers
Get Started Trading Crypto with Ainslie.
Join Thousands of satisfied customers who trust Ainslie for their cryptocurrency and bullion needs.


