Bitcoin Report – August 2024
August 29, 2024
Today our Independent Research Analyst, Isaac Ho from the Ainslie Research Team, brings you the latest monthly deep dive on Bitcoin – including market analysis, on-chain metrics, sentiment, and technical analysis. He highlights some of the key charts that were discussed and analysed by our expert panel in the latest Beyond the Block episode but also expands upon his work with some additional insights. We encourage you to watch the video of the original presentation if you haven’t already.
Since the last update, the market has done a lot; however, we are at the same relative price. The most notable event that took place and shook the market was the Japanese carry trade. This not only affected the crypto market but also triggered a large sell-off in the stock market. This was then followed by a parabolic correction back to the highs.
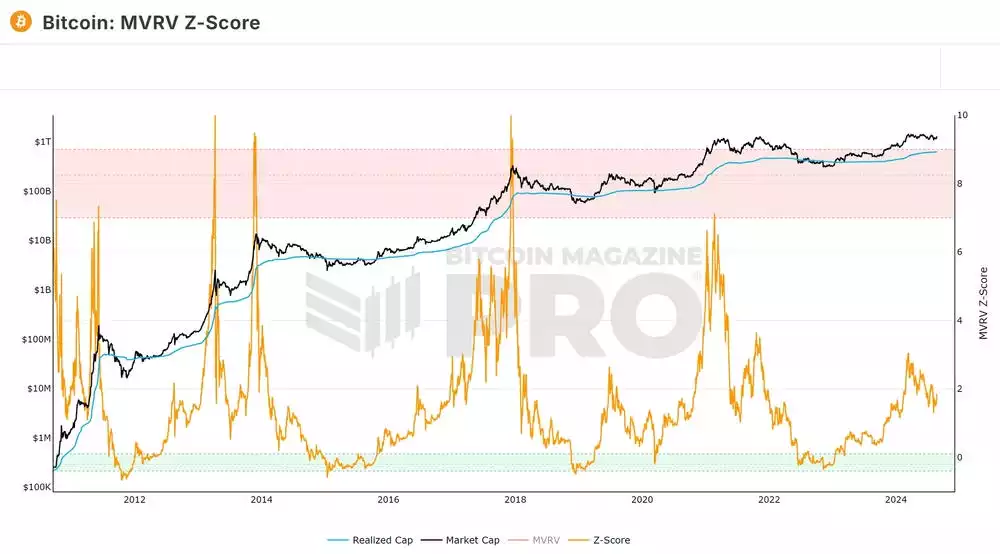
Now, back to BTC. Looking at the MVRV ratio, we can see that the average cost basis of each Bitcoin has been rising. This is measured by the blue line, the realised price. Another orange line is the relationship between the market price and the realised price. What we can see is that the MVRV Z-score is trending down, similar to the last bull market, however, the timing is slightly different. Generally, when we see a market top, the MVRV score will rise rapidly, creating a euphoric thrust up to a deviation score higher than six. Every bull market has exceeded that by a long shot. The way prices are currently behaving suggests that the market top is not in, especially when considering the macro backdrop from a global liquidity standpoint, which is a major driver for risk-on assets.
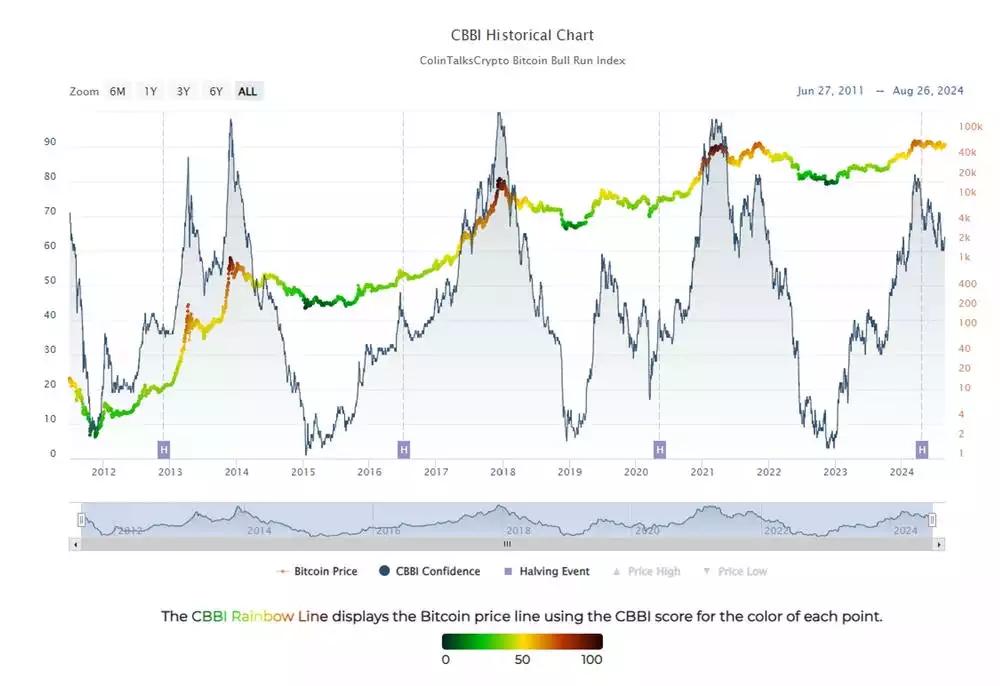
The CBBI chart is a conglomeration of many different metrics, from moving day averages to RSIs and Pi cycle metrics. This chart has a good track history of picking the tops of each bull market. When the CBBI score reaches 90 or higher, we usually see this as the top. So far, we’re sitting at a score of 60, suggesting the market is not heated. However, it is important to note that at the start of the year, when Bitcoin hit an all-time high of around US$72,000, we did reach a level of around US$82,000. That being said, US$72,000 being the cycle high is quite unlikely from both the macro, technical, and on-chain outlook.
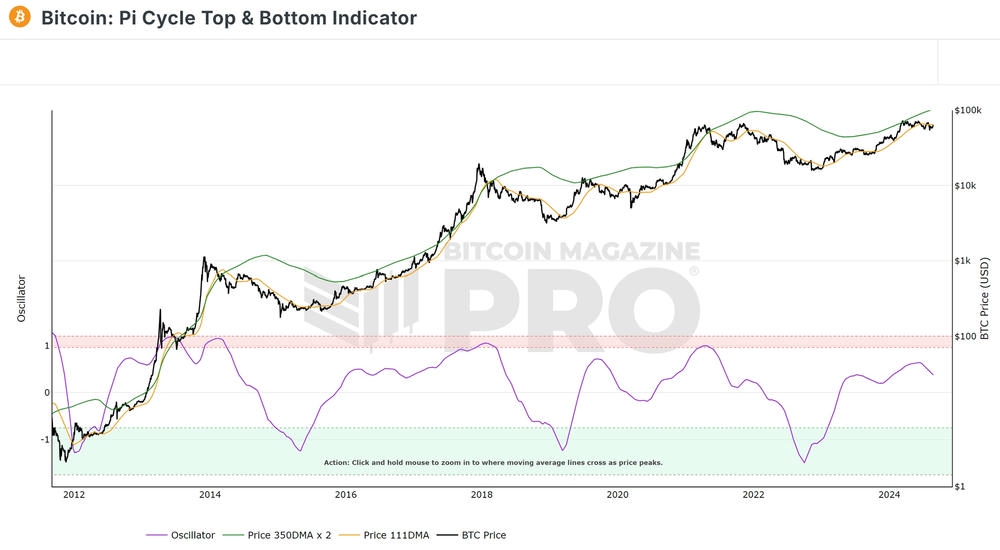
Nothing has particularly changed in the Pi cycle metric. We are still waiting for the same thing to happen, which is when the yellow line crosses over the green line, suggesting the top is in. What we’ve currently seen over the past few weeks to months is that the price slightly deviated out of the yellow line, which doesn’t happen often in the bull market. However, we have reclaimed and are trading within a safe range. One could expect the price to start appreciating more rapidly going into the latter half of this year.
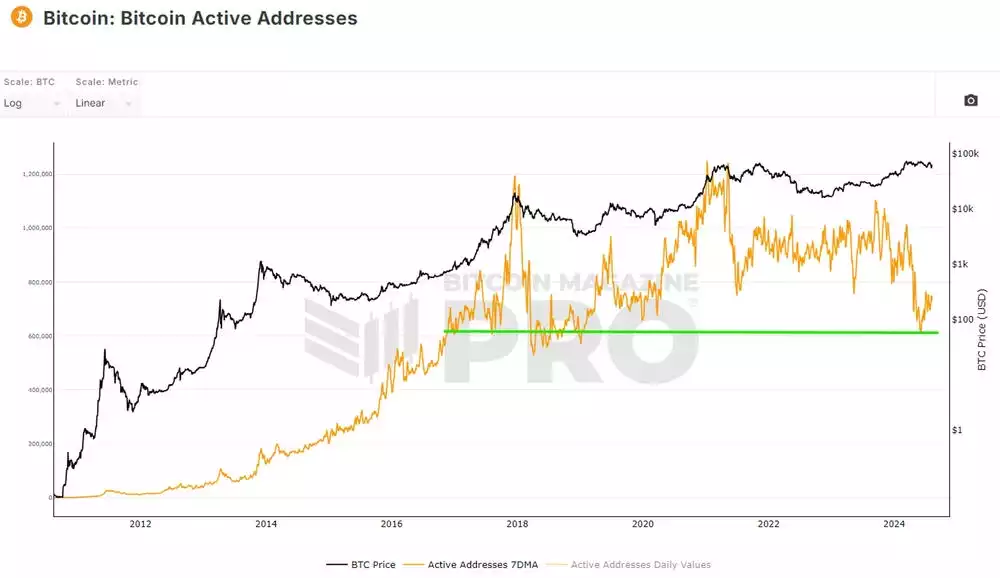
Bitcoin active addresses have appeared to find a low. It’s hard to look at this chart from a technical perspective, however, we’ve pointed out a green line of support, which we will be on the lookout for. The reason is we’ve seen previous bounces from this level, and that has generally signalled a market low. Whether this metric provides useful insights is yet to be determined, but so far it has shown value as a tool to look at and is worth monitoring as we approach the end of the year if this is when retail enters at scale.
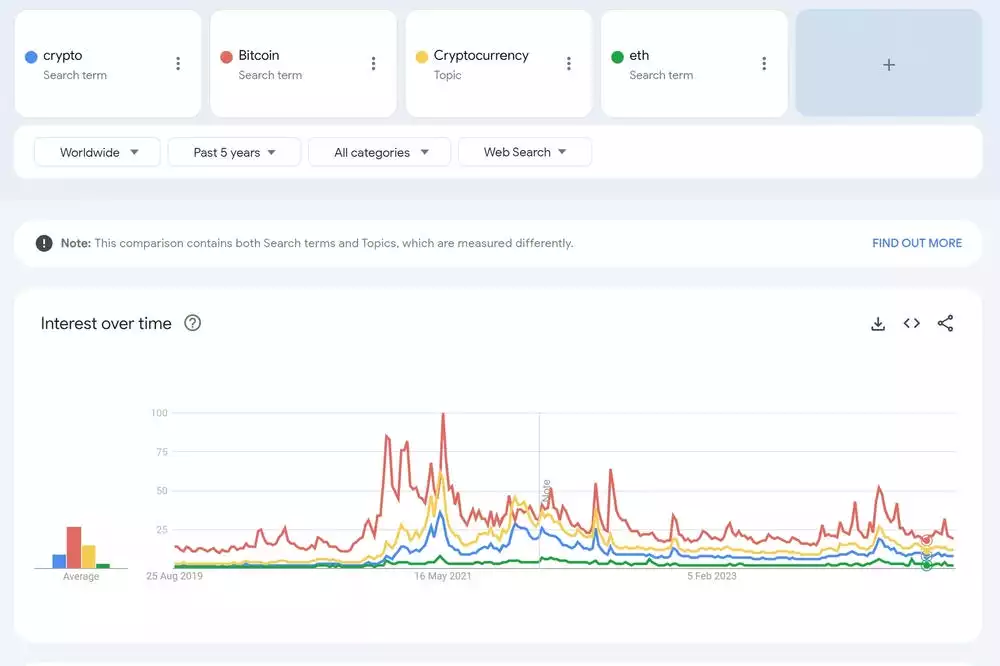
Google Trends is a key metric to look at in terms of gauging sentiment around retail, we’re still in the doldrums. Market interest is low; however, the good thing is that prices are maintaining their value while retail is low. This can be viewed as a bullish indicator, as when retail starts to chase Bitcoin again, they will realise the price is much higher than they expected, which may cause FOMO. From that point, you would expect to see Google Trends and search terms increase.
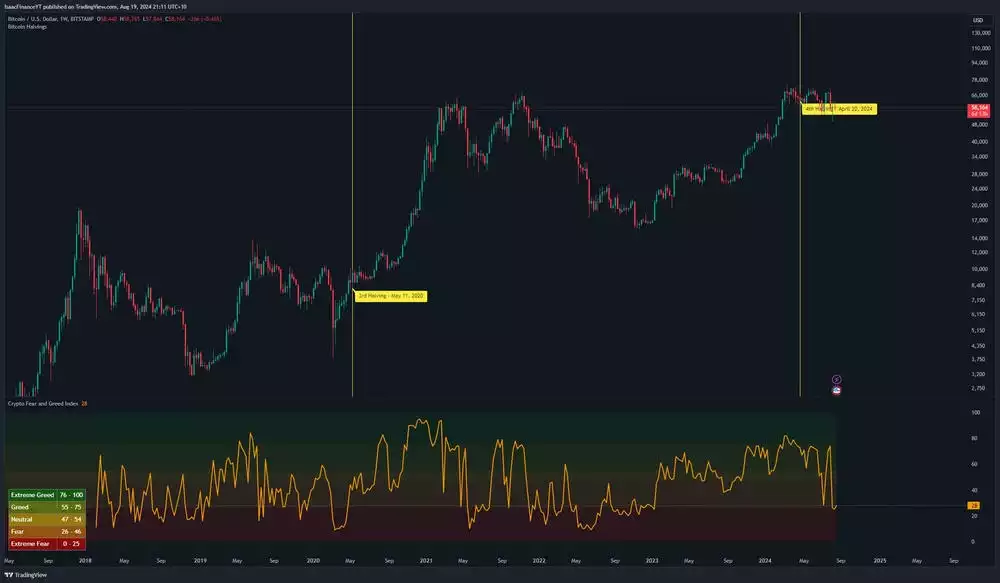
The macro Fear and Greed Index took a large hit on the news of the Japanese carry trade unwinding. Since then, we’ve seen a rebound back up to more neutral levels around the halving stage. There tends to be a black swan event each cycle; the last cycle was COVID-19, and this cycle we had the Japanese carry trade.
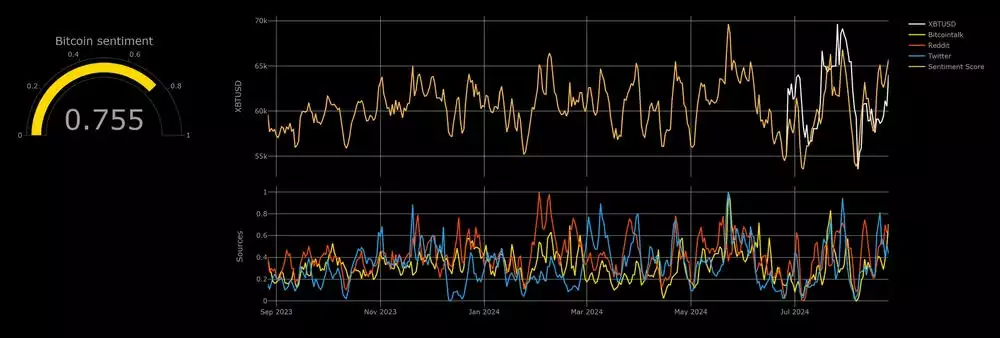
On to short-term sentiment: we are chopping in and out of greed and fear. As of today, we are sitting in more greed. That being said, this isn’t a good metric to be looking at for the longer-term plays but rather the more day trading swing trades.
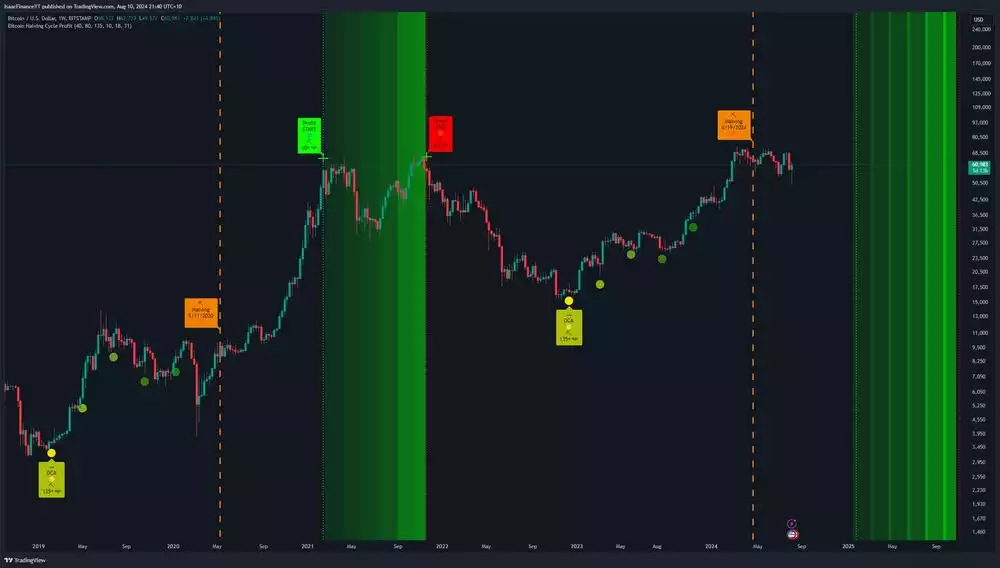
We’ve spoken about this chart a fair bit in the Beyond the Block episodes and I think it’s an important chart to note. It highlights the power of the four-year cycle and the take-profit zones shown in green. When we reach the green box, we need to switch our bias from bullish to bearish. This shouldn’t be used as a sole indicator, as many things can flip from bullish to bearish.
The weekly stochastic is trading in the middle of the bands. Usually this signals fair valuation, and rather than expecting extreme moves to the upside or downside, it suggests more consolidation. This is for the short term, of course.
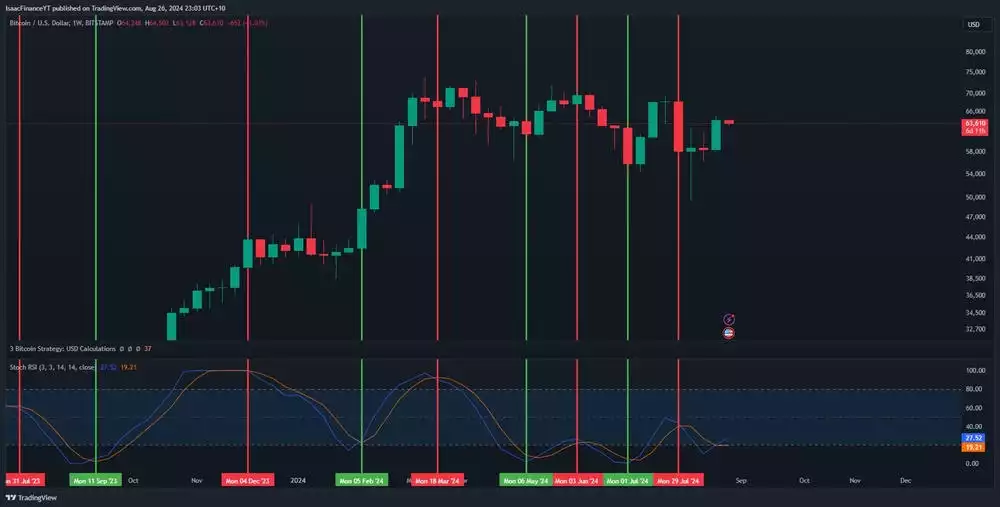
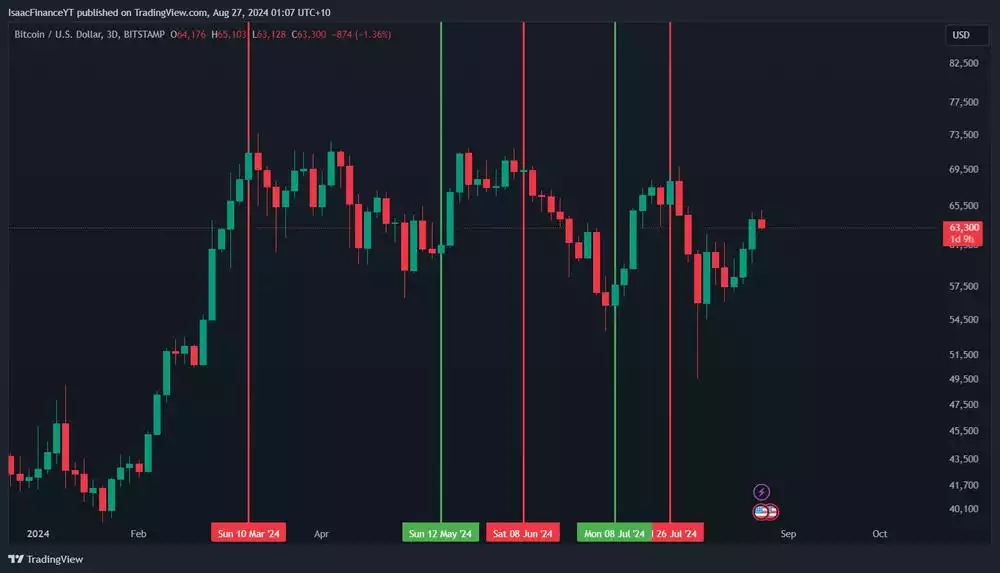
The three-day stochastic is a similar image. We’re not expecting anything extreme, but rather sticking within this range until the next 60-day cycle low appears. In addition, we likely experienced a premature daily cycle low hitting around 30 days, so more time is needed to consolidate.
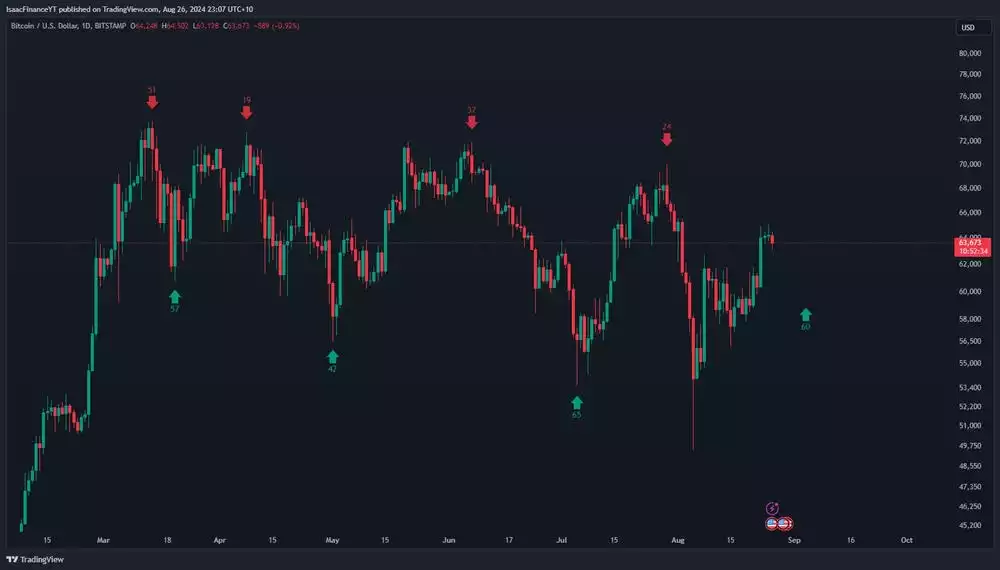
Here is an in-depth view of the 60-day cycles. We can see the chaos from earlier in the month forced the price down to break the prior low and take out the US$52,000 liquidity zone we spoke about in the previous videos. Since then, we have seen a dramatic price increase, reclaiming the range again and defying this 60-day cycle. This puts us in a much more challenging position from an analysis standpoint, making it very hard to predict what is going to happen in the short term.
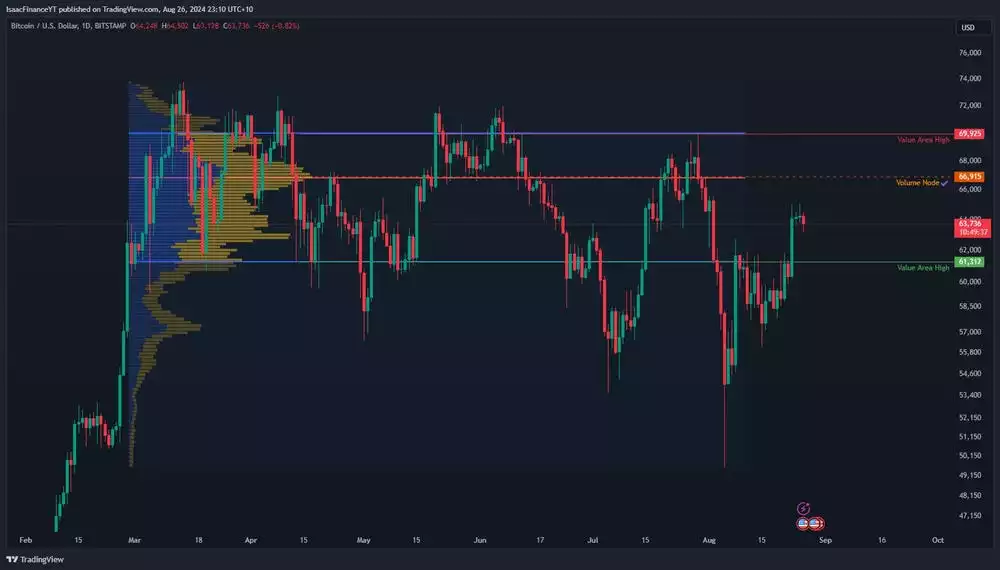
Moving to the volume profile, we found resistance at the value area low and have since claimed acceptance back into the range. This can be seen as a bullish sign as long as we hold the value area low. You could view these zones as demand and supply for the current trading range. If we do trend higher, a big resistance will be the value point of control, sitting at around US$67,000.
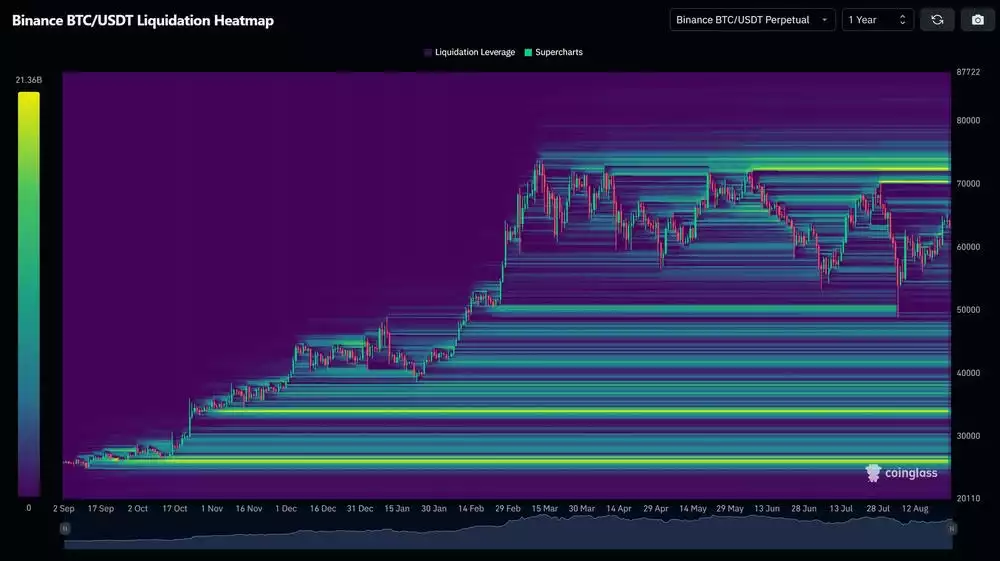
Onto liquidity: since the last update, the major liquidity block has been cleared, leading to a large price increase. Now it seems the only liquidity that stands out is to the upside, as the lower levels would break fundamental Bitcoin downtrend percentages if we hit those levels. Typically, you expect to see 30% drawdowns in a bull market, which we had this month. This makes everything even more bullish, and in the coming months, we could expect to see prices increase and take out those levels, primarily the US$72,000 region. This is also coupled with the macro backdrop of global liquidity increasing, which has a close-knit relationship with risk-on assets and their appreciation.
Watch the most recent video presentation of Bitcoin Analysis: Beyond the Block where I share some of these explanations in a panel format, and join the discussion on our YouTube Channel here.
I will return with another detailed analysis of everything Bitcoin next month, including more market analysis, on-chain metrics, sentiment, and technical analysis.
Isaac Ho | Independent Research Analyst
The Ainslie Group
x.com/IsaacsDevCorner
Share this Article:
Crypto in your SMSF
Top Movers
Get Started Trading Crypto with Ainslie.
Join Thousands of satisfied customers who trust Ainslie for their cryptocurrency and bullion needs.


