Bitcoin Analysis: Beyond the Block – October 2024
October 24, 2024
Today the Ainslie Research team brings you the latest monthly update on Bitcoin – including the Macro fundamentals, market and on-chain technical metrics and all the other factors currently driving its adoption and price. This summary highlights some of the key charts that were discussed and analysed by our expert panel. We encourage you to watch the video of the presentation in full for the detailed explanations.
Bitcoin and Global Liquidity
Bitcoin is the most directly correlated asset to Global Liquidity. Trading Bitcoin can be thought of as trading the Global Liquidity Cycle, but with an adoption curve that leads to significantly higher highs and lows each cycle. As such we look to buy Bitcoin during the ‘Bust’ phase or liquidity low, then rotate out of it during the ‘Late Cycle’ where liquidity is over-extended and downside protection is required (our preference is to rotate into Gold). When correctly timing and structuring the rotation, it is possible to significantly outperform ongoing monetary debasement. The Bitcoin cycle low was in November 2022, and since then the returns have been unmatched by any other major asset.
Where are we currently in the Global Macro Cycle?
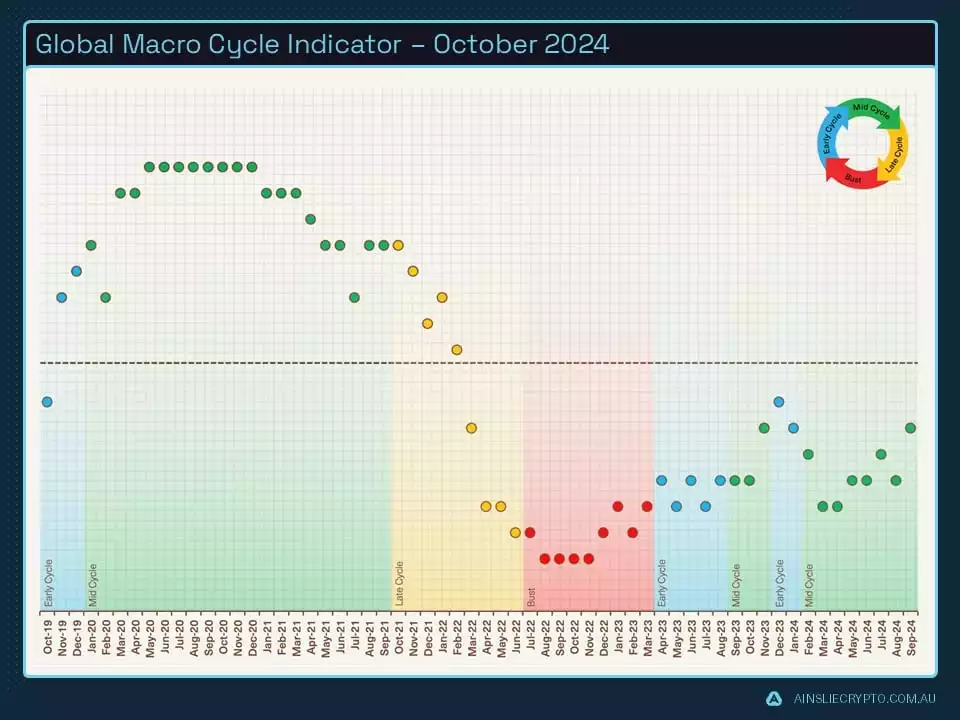
This month we have another positive data point for our Global Macro Indicator showing that we are still firmly in the ‘Mid Cycle’ which is an excellent environment for risk assets and Bitcoin. Another positive is the indicator is still below the neutral line which tells us we have a considerable amount of time left before this macro cycle ends. Our best guess at this stage is mid to late 2025 for a market top.
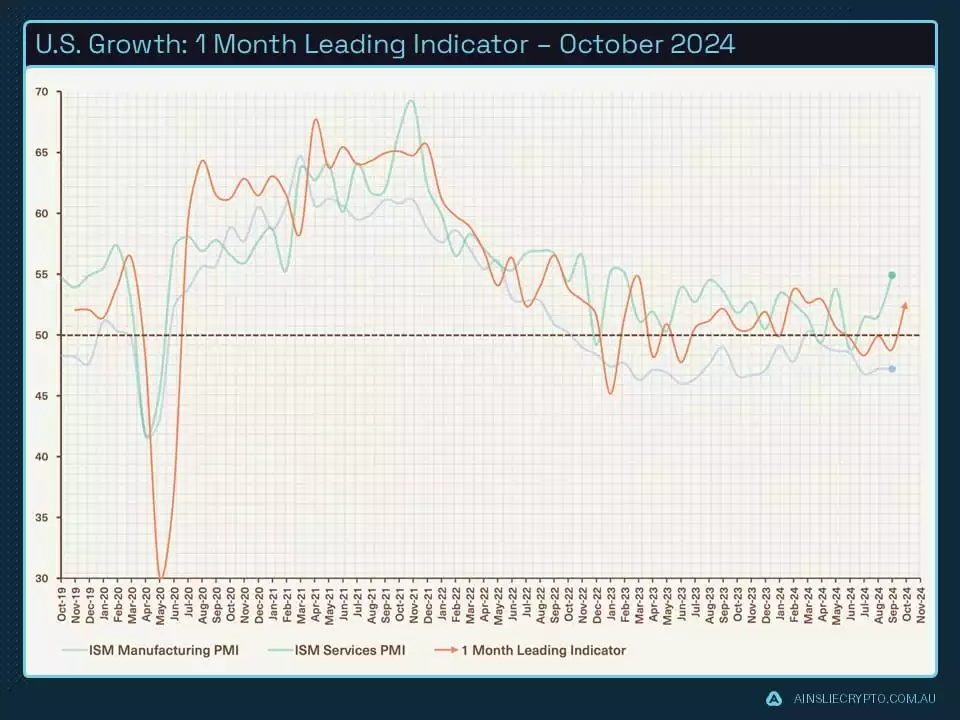
U.S. economic growth, as measured by the ISM data, is a useful tool to forecast the trajectory of the economy moving forward. Services have started to show some strength while manufacturing has continued to lag. As we said last month, we were not too concerned with the 1-month leading indicator pointing below neutral as the business cycle was expected to continue being ‘not too hot and not too cold’.
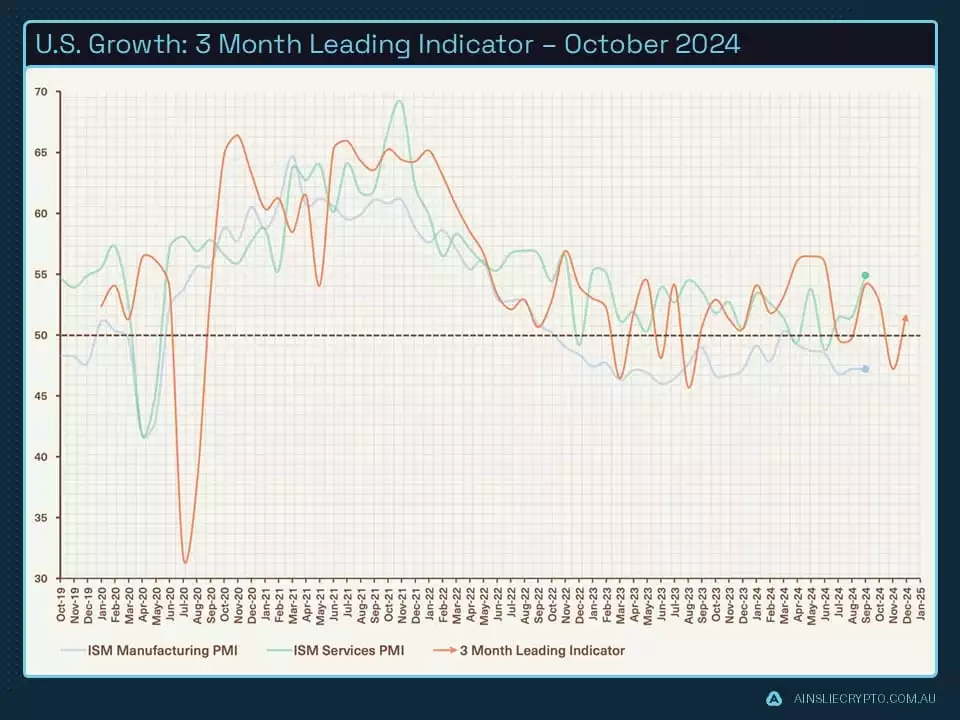
The 3-month indicator, which incorporates new orders less inventories has dropped significantly back into contraction from a rise in inventories. The 3-month leading indicator is pointing in the right direction. U.S. Q2 GDP was revised to 3% growth, even with a lagging manufacturing sector. It is possible that manufacturing is having less of an impact on the U.S. economy with services playing a larger role in the future, certainly something we will be keeping an eye on.
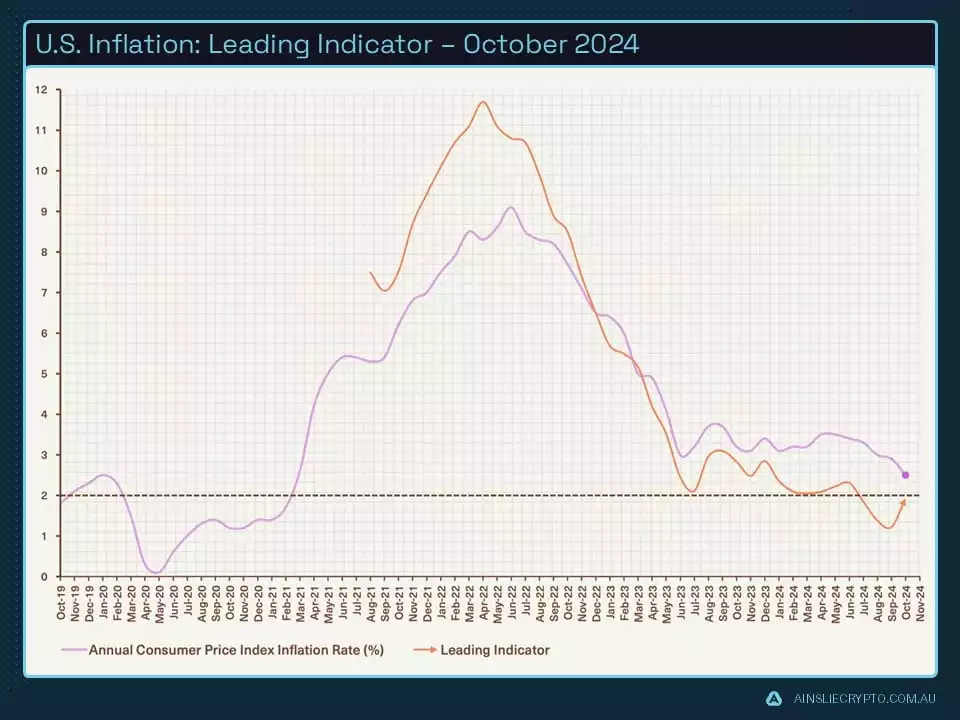
Our inflation lead indicator reached a new low last month but has bounced and is heading towards the official rate. We knew our data point would eventually converge, though it has kept us well in front of the curve while everyone else was screaming for higher inflation. We will slightly change our tune here and suggest that inflation will start to pick up over the next 3-6 months, nothing like post covid but it is hard to see inflation staying low in the U.S. when the Fed has started cutting rates into a reasonably strong economy.
Where are we currently in the Global Liquidity Cycle?
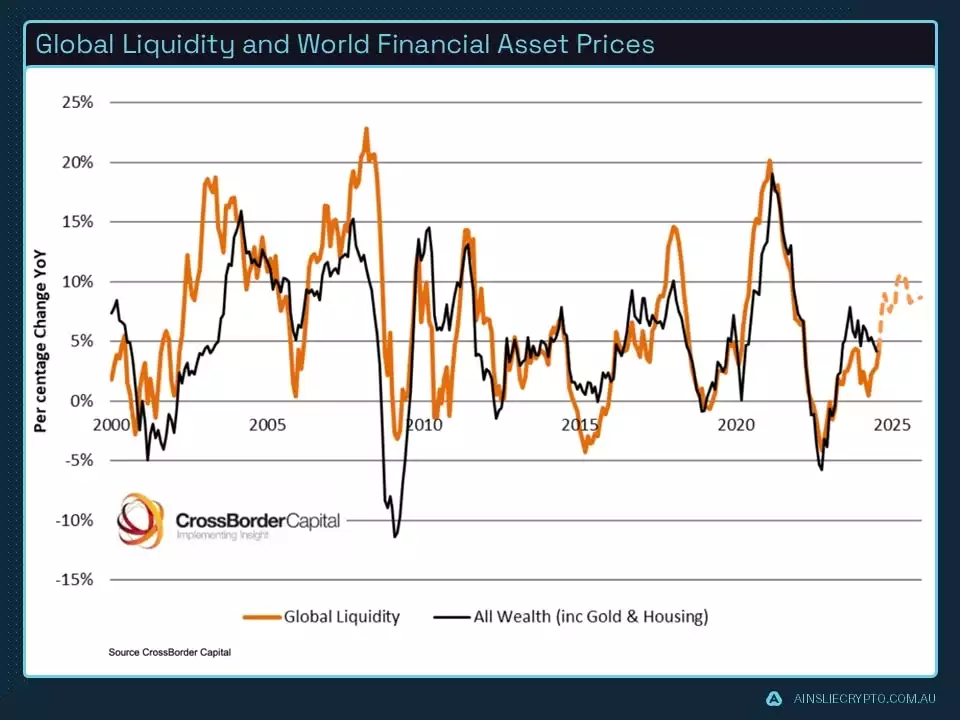
Global Liquidity leads the movement of World financial assets, so this is the indicator we look most closely at to determine where the opportunities are to take advantage of Bitcoin’s cycles.
Below is a chart of the correlation between liquidity and world financial asset prices. As the world becomes more indebted and financialised, asset prices and the economy become increasingly correlated to liquidity cycles. If we can predict the direction of liquidity, we can predict the direction of asset prices and coincidently the strength of the economy.
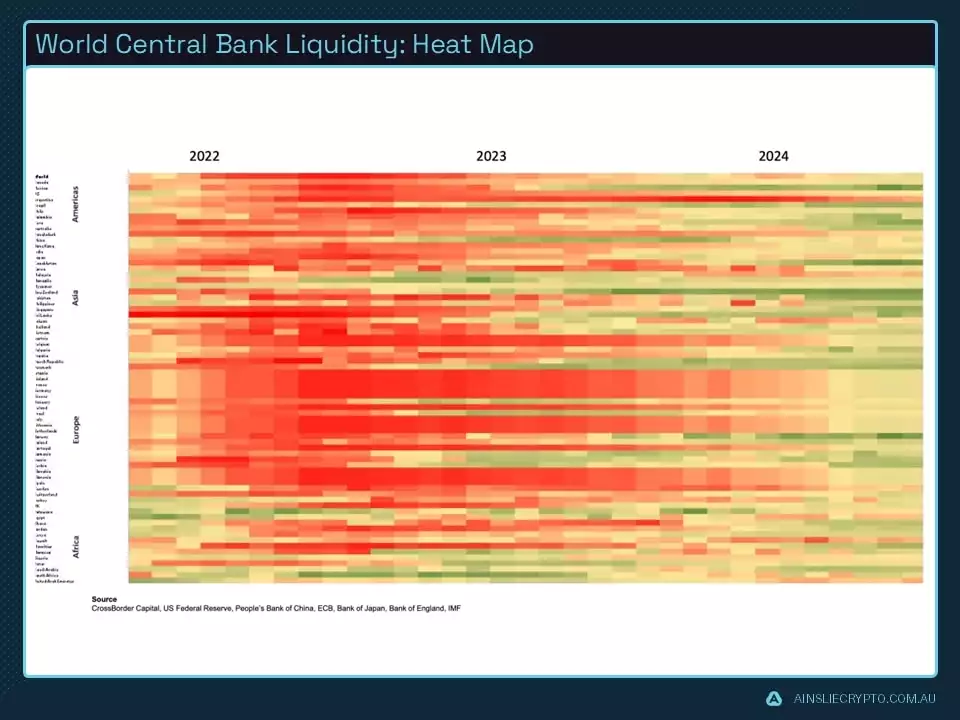
The percentage of Central Banks easing has continued from last month which is again showing up clearing in our liquidity heat map. We forecast that Central Banks will continue to lower rates and provide liquidity injections in one form or another for the foreseeable future.
Last week the ECB cut rates another 25bps, Canadian inflation is dropping, and it is expected rates will be cut again. After a pause last month, the BOE are expected to cut again in November and the market is now pricing in a 90% chance of a 25bps cut from the Fed in November even after a Q2 GDP revision of 3% and decent jobs data.
This is an opportune time to remind our readers that Central bank balance sheets and interest rates are not the be-all and end-all of the Global Liquidity index, particularly in a world of fiscal dominance over monetary. Though it certainly provides an indicator of intent from officials going forward.
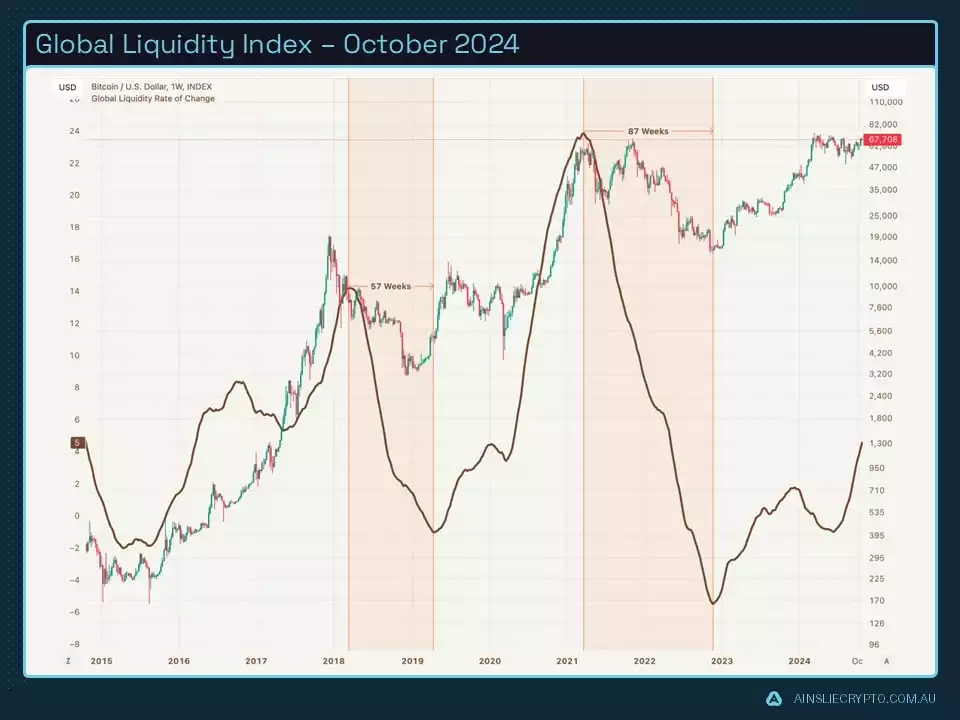
Our Global Liquidity Rate of Change is our new favourite. We know that liquidity is still in the early to mid-phase of expansion and with the help of this chart, we are well prepared for the liquidity turning point when it is time to take chips off the table. The chart also gives us an excellent inflection point at the bottom of the liquidity cycle when it’s time to start allocating to Bitcoin again. That will be a 2025 and 2026 story.
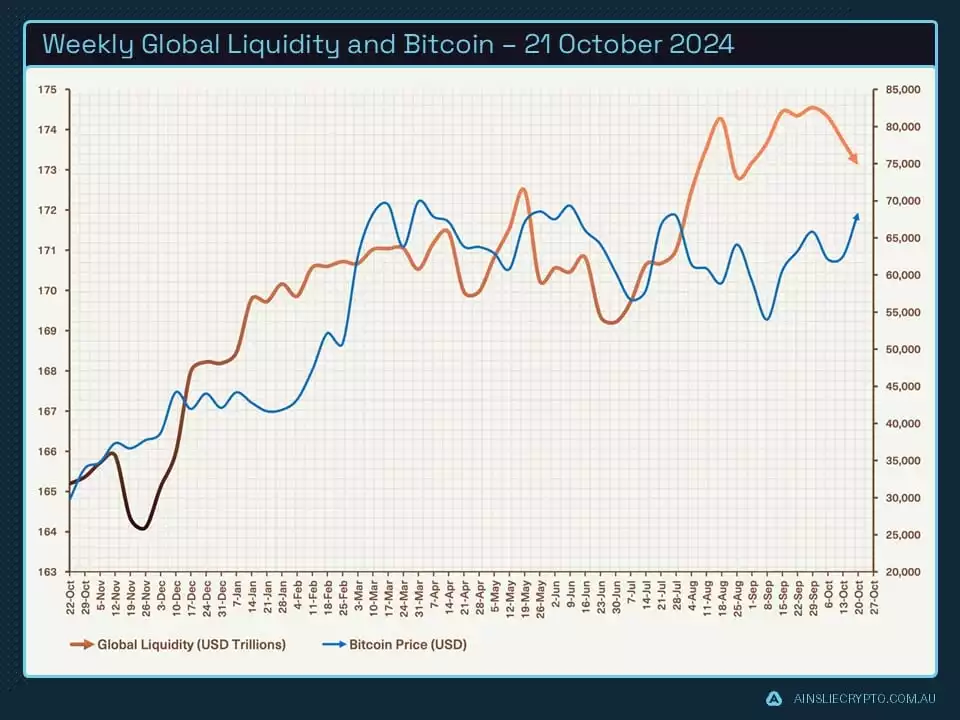
Our final macro chart for this month shows the closing of the alligator jaws. We had previously predicted Bitcoin would play catch up with liquidity, well we were half right. At the time of writing, Bitcoin is trading around US$67k while we are also experiencing a slight dip in liquidity on the weekly level. It is important to remember these weekly liquidity snapshots can be a little volatile, we are certainly expecting a clearer rise in liquidity into the end of the year and early 2025.
You may not be interested in politics, but politics is interested in you.
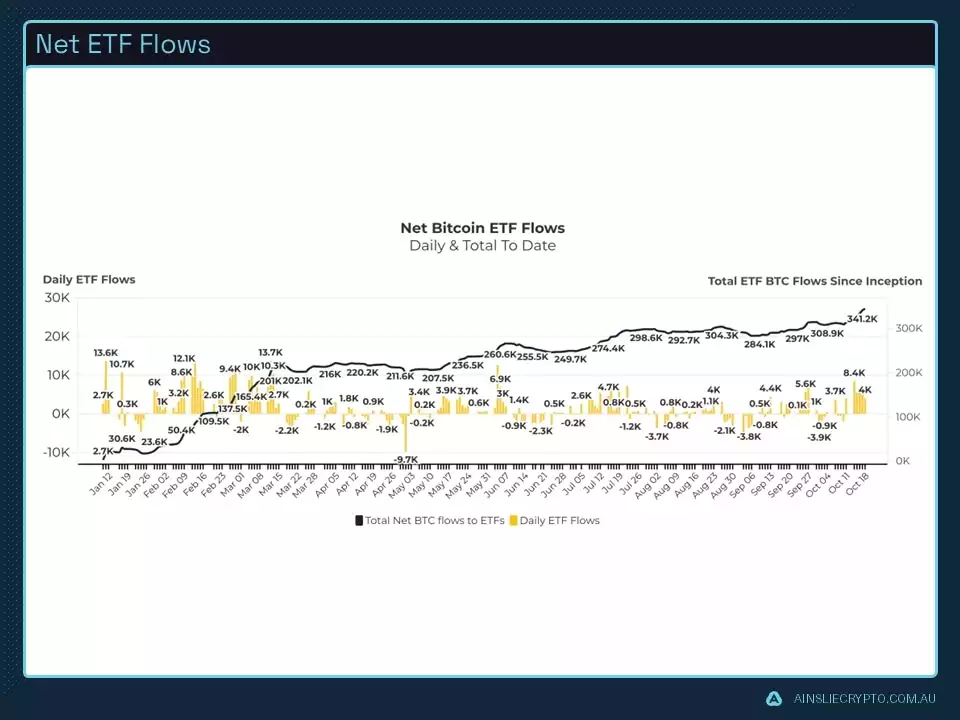
Flows into ETFs started the month slowly but accelerated last week with over 1 billion dollars in new coins captured. Most readers are probably wondering why the price of Bitcoin has not exploded after such significant flows. We remind the readers of the basis trade where hedge funds will buy the physical ETF but short a CME futures contract which is a net neutral on the price. Last week was an excellent time to execute this trade with the bullish price action and futures premiums moving out. Of course, some of those flows will be investors outright buying Bitcoin without a hedged position, however, we maintain these ‘long only’ flows will really take off once Bitcoin breaks all-time highs.
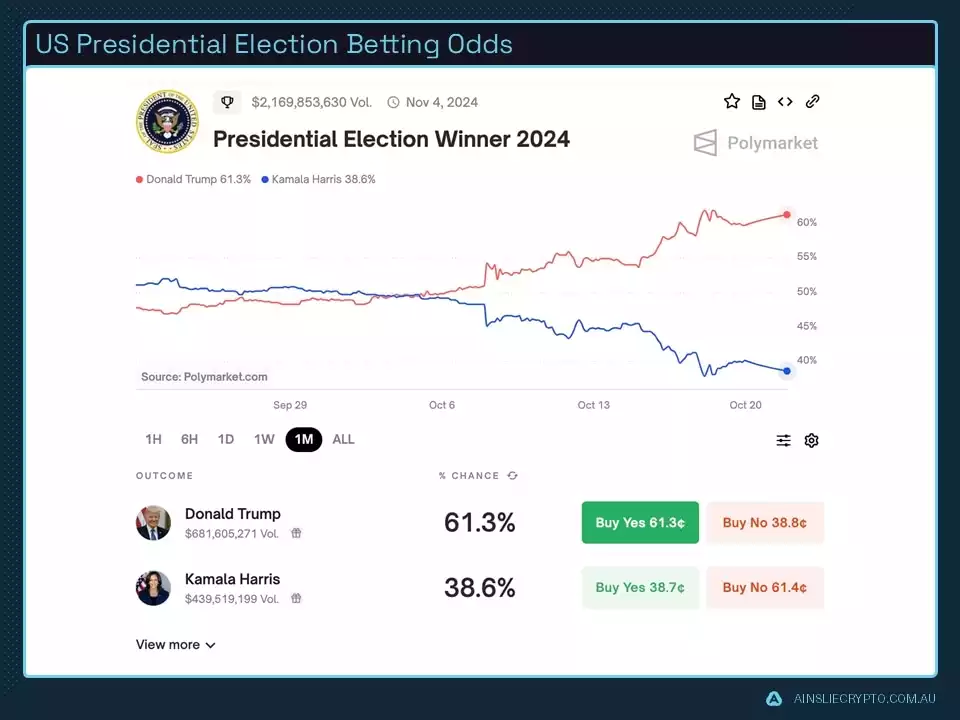
While we rarely discuss politics or elections for that matter, it is hard to not find ourselves drawn into the soap opera that is the 2024 U.S. election.
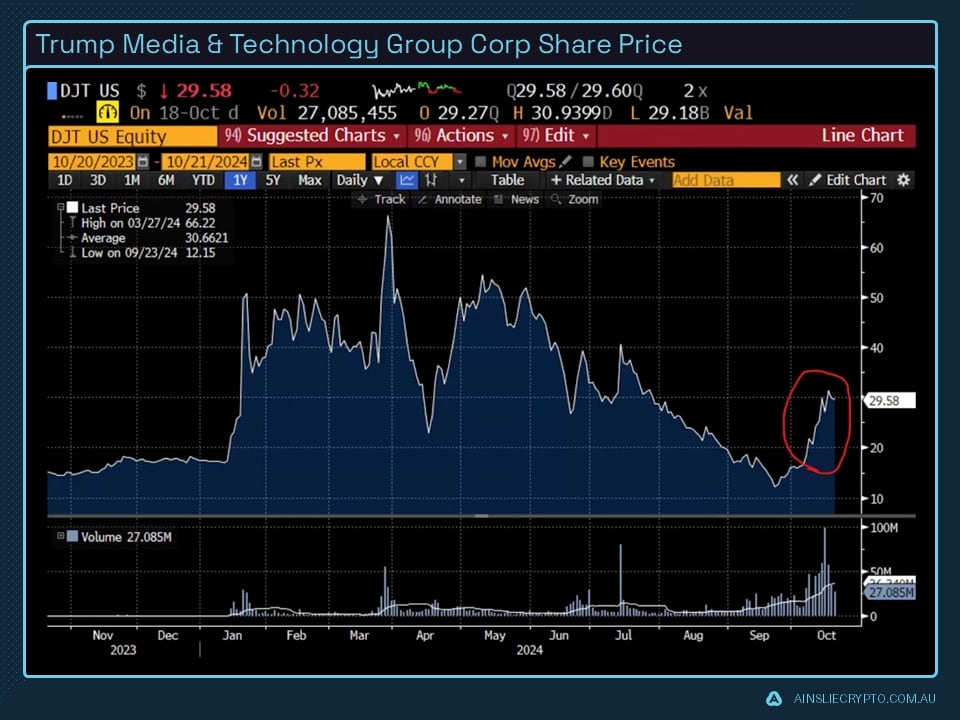
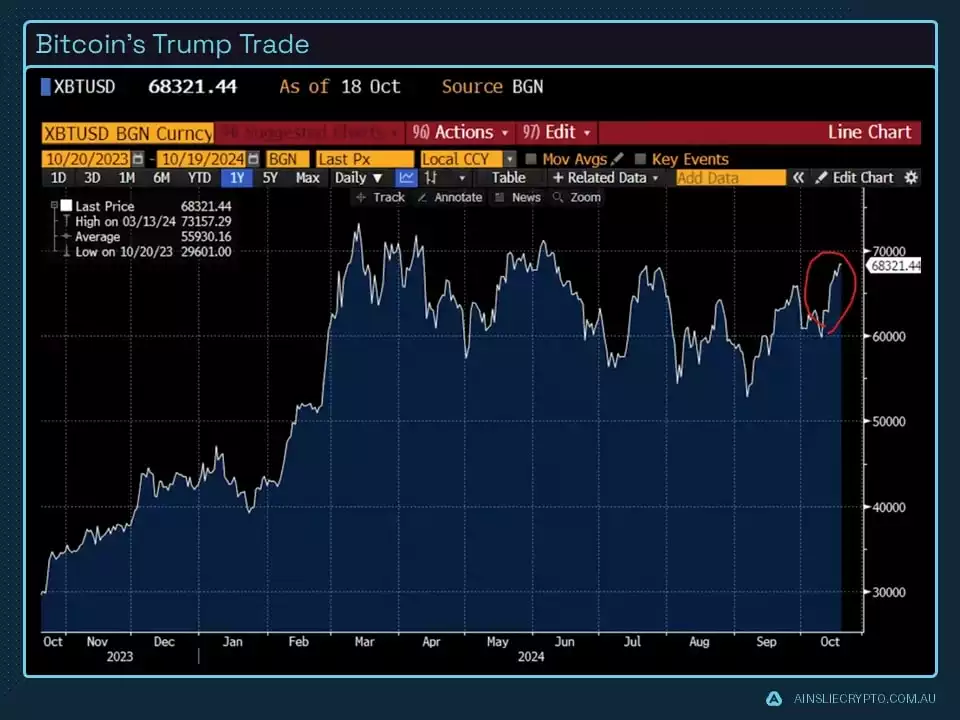
The following charts illustrate what we are calling the ‘The Trump Trade’ which has recently had a high correlation to the likelihood of Trump winning in the betting markets. Why do we look at betting markets instead of poles? While poles can certainly indicate how each party is doing in popularity, betting markets are where real people put real skin in the game with dollars.
Trump’s media and technology company has had a sharp rise during October reflecting his election odds. Obviously, a Trump win would be a tailwind for his company, however, the recent price action has more to do with the Republican’s policy towards lowering corporate tax rates and loose regulation.
Regarding Bitcoin’s rise, recent policy from Trump and the Republican party is a more favourable regulatory environment towards Bitcoin and crypto. From the Republican party’s page, ‘We will defend the right to mine Bitcoin, and ensure every American has the right to self-custody of their Digital Assets, and transact free from Government Surveillance and Control’. With an estimated 52 million Bitcoin and crypto holders in the U.S., a positive regulatory environment for Bitcoin and Crypto is likely not a bad policy to attract single-issue voters.
This is in stark contrast to the Democrats who have been seen to be particularly hostile towards the industry. An example would be earlier in the year when a piece of legislation to allow banks to custody Bitcoin and Crypto passed both the House and the Senate, only to be vetoed by President Biden at the last minute.
While correlation is not always causation, it’s clear that the Bitcoin market structure has changed for the better, making what looks like a higher high and a higher low. Does Bitcoin see a more favourable regulatory environment on the horizon? Time will tell. What we are almost certain of is volatility in all markets will pick up as the election fast approaches.
Conclusion
After making it through September which is usually a very tough period for Bitcoin and other risk assets seasonally, we look forward to the end of the year as the most bullish time for assets. No doubt the next couple of weeks will have its volatility no matter who wins the U.S. election and while we believe a Trump win would be good for Bitcoin in the short term, long term it does not matter who wins. Government deficits will continue to rise, debt will continue to rise, and therefore the supply of money and liquidity will continue to rise. Through the last 3 election cycles 2012, 2016 and 2020, Bitcoin has always performed substantially well in the following months no matter what party won, though we suspect Bitcoin’s appreciation at these times has more to do with seasonality and liquidity more than anything else.
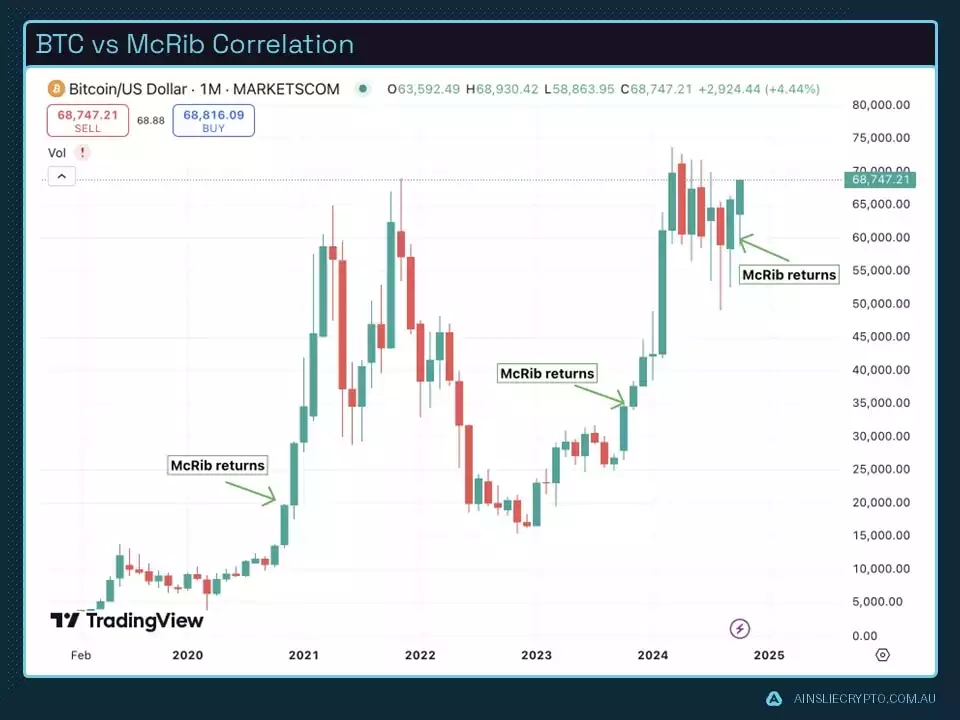
To finish on a less serious note regarding correlation and causation, McDonalds has brought back the McRib burger which historically has been an excellent indicator for gangbuster Bitcoin price action. Arriving just in time!
Watch the full presentation with detailed explanations and discussion on our YouTube Channel here:
Until we return with more analysis next month, keep stacking those sats!
Joseph Brombal
Research and Analysis Manager
The Ainslie Group
Share this Article:
Crypto in your SMSF
Top Movers
Get Started Trading Crypto with Ainslie.
Join Thousands of satisfied customers who trust Ainslie for their cryptocurrency and bullion needs.


