Bitcoin Analysis: Beyond the Block – May 2025
Posted on 22/05/2025 | 1656 Views
Today, the Ainslie Research team brings you the latest monthly update on Bitcoin, including the Macro fundamentals, market and on-chain technical metrics, and all the other factors currently driving its adoption and price. This summary highlights some of the key charts that were discussed and analysed by our expert panel. We encourage you to watch the video of the presentation in full for the detailed explanations.
Bitcoin and Global Liquidity
Bitcoin is the most directly correlated asset to Global Liquidity. Trading Bitcoin can be thought of as trading the Global Liquidity Cycle, but with an adoption curve that leads to significantly higher highs and lows each cycle. As such, we look to buy Bitcoin during the ‘Bust’ phase or liquidity low, then rotate out of it during ‘Late Cycle’ where liquidity is over-extended and downside protection is required (our preference is to rotate into Gold). When correctly timing and structuring the rotation, it is possible to significantly outperform ongoing monetary debasement. The Bitcoin cycle low was in November 2022, and since then, the returns have been unmatched by any other major asset.
Where are we currently in the Global Macro Cycle?
Welcome to the May edition of Beyond the Block. Last month, we turned very bullish on Bitcoin as we believed all the bad news was priced in and there would be no recession. We wrote, “There is a high likelihood Bitcoin has made a bottom at US$74,500, with negative sentiment, positioning and volatility reaching extremes. It is worth noting that Bitcoin and other risk assets were not able to make a new low during the trade war escalation between the US and China (raising tariffs to 145%). When the market stops going down on bad news, it's time to pay attention.”
Bitcoin has surged past US$100,000, defying bearish scepticism and validating our bullish outlook. We remain confident in Bitcoin’s potential for further all-time highs in this cycle, supported by our Global Macro Cycle Indicator shifting to the ‘early phase’ amid a favourable liquidity environment. This phase reflects slowing growth and declining inflation, driven by global trade war shocks. A transition to ‘mid-cycle,’ characterised by rising growth and inflation into 2026, is highly probable, maintaining a positive environment for risk assets.
Looking ahead, potential fiscal and monetary policy shifts are poised to drive growth and, eventually, inflation. Notably, Trump’s proposed ‘Big Beautiful Bill’—featuring substantial tax cuts adding US$300–500 billion annually to the deficit—is likely to pass with Republican control of Congress. These tax cuts, targeting lower and middle-class households, should significantly boost growth and inflation over the next 12–18 months.
In Europe, Germany’s shift away from austerity, prompted by economic stagnation, geopolitical pressures, and infrastructure needs, supports growth. In Asia, China’s liquidity injections through open market operations and reverse repo activities underscore the PBoC’s focus on growth over currency defence, further bolstering the global liquidity.

US economic growth, tracked by ISM data, serves as a reliable indicator for forecasting economic trends. Last month, we identified “peak bearishness,” anticipating a rise in economic activity. The pause in the US-China trade war has brought stability and relief, boosting confidence. ISM data suggests the economy has likely bottomed, with a return to expansion expected within the next few months.

Official inflation data is finally aligning with our months-long predictions. Our leading indicator has accurately forecasted US inflation trends, even as others anticipated higher inflation. Currently, our indicator suggests inflation has bottomed and is unlikely to drop further without a major deflationary shock. Looking ahead, we expect our leading indicator to surpass official figures by early next year, driven by stimulatory government policies worldwide, especially in the US.

Where are we currently in the Global Liquidity Cycle?
Since 1970, Global Liquidity cycles have demonstrated their significant impact on financial markets. During periods of low liquidity, markets face risks of currency, banking, or broader financial crises. Conversely, abundant liquidity fuels asset booms, driving robust market growth.

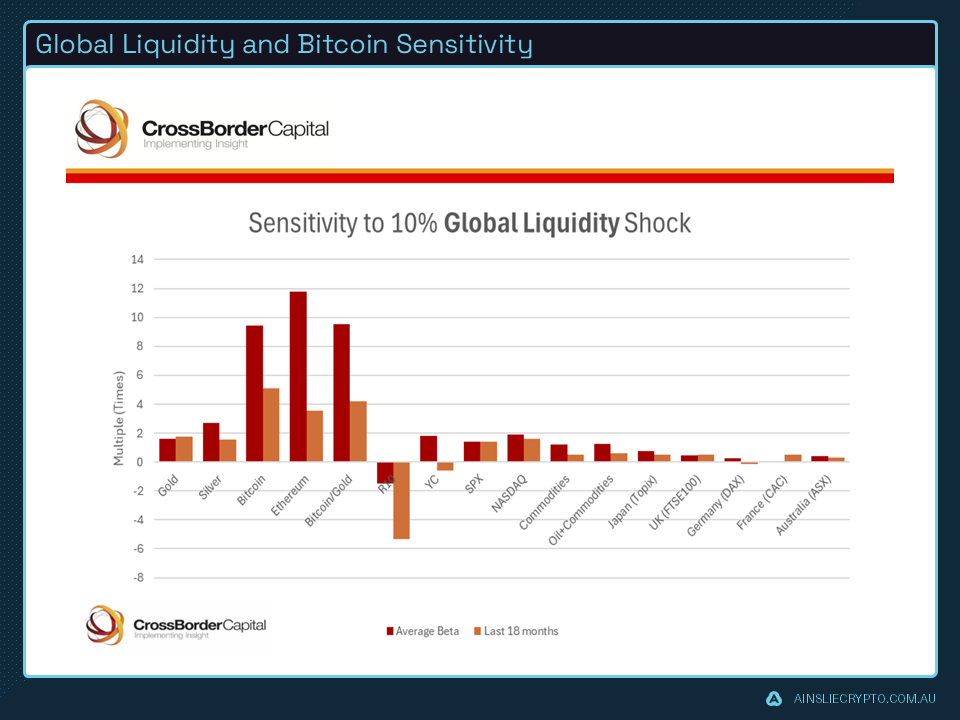
This chart illustrates how various assets respond to a 10% increase in liquidity. The S&P, a global stock portfolio benchmark, rises approximately 12% for every 10% liquidity expansion, barely outpacing liquidity growth. Historically, Bitcoin has achieved a 9x multiplier (red bar) per 10% liquidity increase, earning it the title “fastest horse.” However, over the past 18 months, as Bitcoin’s market cap has grown into the trillions, its multiplier has decreased to a still impressive 5x (orange bar) for every 10% liquidity growth.
Liquidity growth from central banks has remained modest, characterised by a pattern of intermittent and cautious injections. This "stop-and-start" approach highlights that central banks are not the sole providers of market liquidity. In the US, for instance, previous articles have emphasised the US Treasury's ability to inject additional stimulus independently of the Federal Reserve. Given the escalating fiscal deficit, the US has increasingly issued, and is likely to continue issuing, short-term debt in the form of Treasury bills—debt instruments ranging from 4 to 52 weeks. These bills are highly liquid and carry minimal duration risk, allowing capital to shift from other short-duration instruments like the Reverse Repo facility or savings accounts. As the Reverse Repo account nears depletion, the question arises: how can the government maintain robust demand for these Treasury bills? The answer lies in regulatory adjustments.
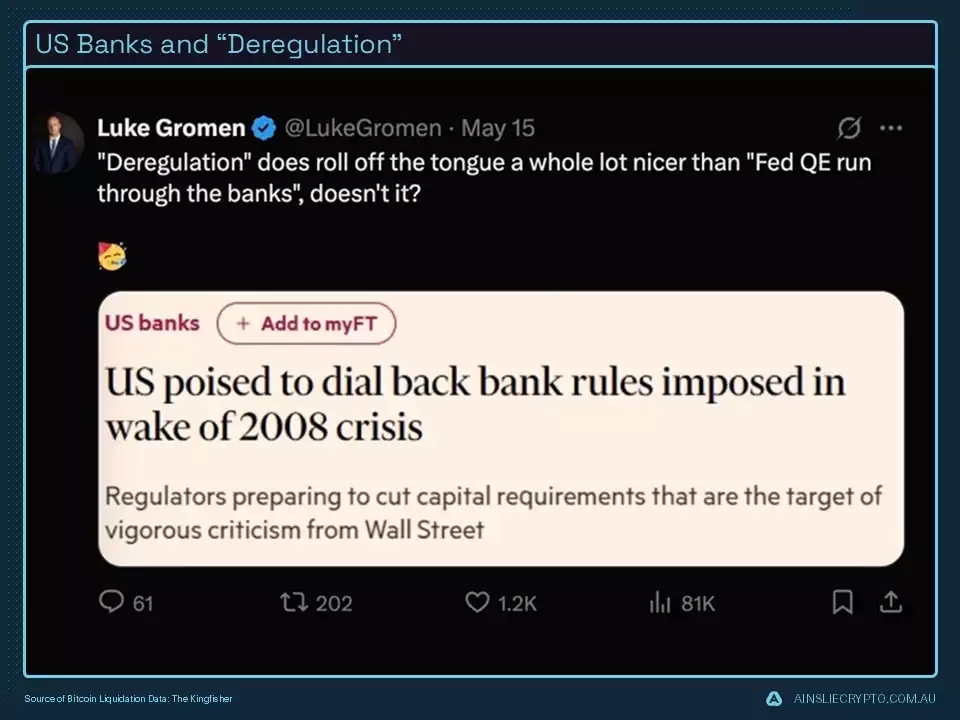
The GENIUS Act, proposed in February 2025 by Senators Scott, Hagerty, Lummis, and Gillibrand, requires stablecoin issuers to back each dollar with cash or short-term Treasuries, thereby significantly boosting demand for US government debt. This mandate forces issuers to acquire more Treasury bills and bonds, directly expanding the market for US debt securities and facilitating increased debt issuance by the government. The Act's synergy with ongoing regulatory considerations, such as the potential easing of the Supplementary Leverage Ratio (SLR), further amplifies banks' ability to hold Treasuries, thus supporting this heightened demand. By promoting global dollarisation, the Act also underpins US sanctions and law enforcement efforts, indirectly driving the need for more debt issuance to preserve the US dollar's dominance in the face of global financial changes. This legislative strategy underscores a deliberate push to harness stablecoins for both fiscal and monetary policy goals.
Anticipated modifications to the SLR will enable banks to purchase US Treasury Bills without facing penalties. A reduction in the SLR decreases the capital banks are required to hold against their total assets, including safe assets like US Treasuries. This adjustment effectively enhances their capacity to buy short-term debt without the need to raise additional capital. Consequently, banks can leverage their expanded balance sheets to absorb more government debt, potentially indirectly increasing the money supply through credit expansion. This increased demand for Treasuries could also facilitate government borrowing by possibly reducing yields, thereby simplifying the financing of government operations and debt. These regulatory shifts are consistent with recent discussions in industry circles, indicating a calculated effort to strengthen the Treasury market in the context of global financial trends.
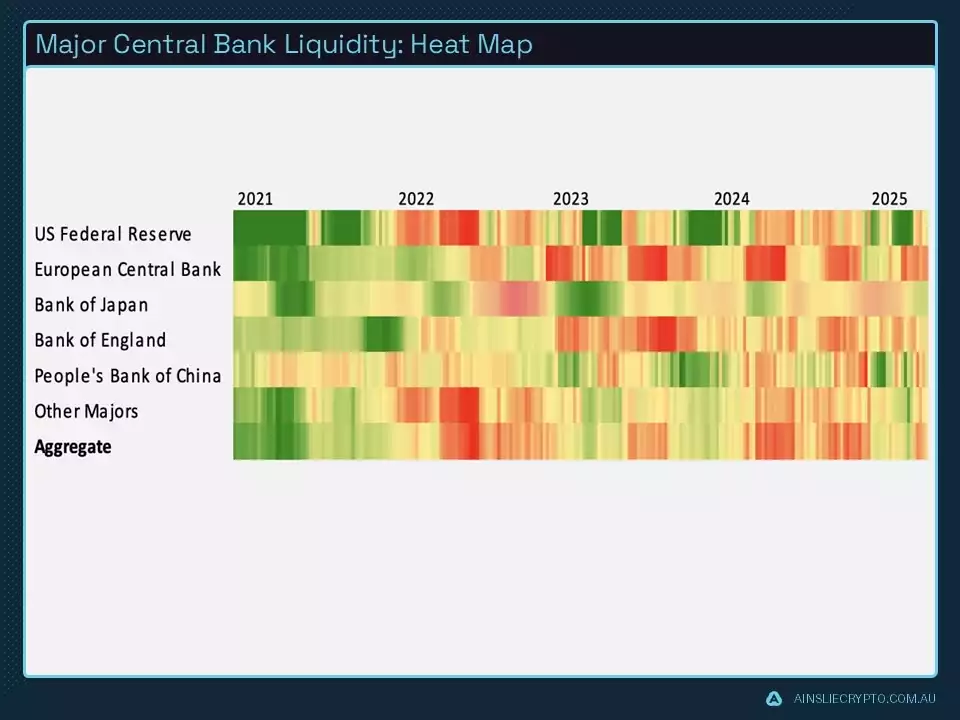
With that said, we expect liquidity momentum to continue rising throughout the rest of the year, currently growing at just above 4% annually.

Nominal liquidity has slightly decreased to just over US$177 trillion, driven by a stronger US dollar and weakening bond markets. Despite this, we are optimistic that liquidity growth will resume its upward trend through the rest of the year and into 2026, with expected minor fluctuations. Bitcoin remains fairly priced.

Bitcoin, from a traditional investor’s perspective.
Bitcoin ETFs have seen a surge in inflows, reaching a record high of 561,200 net inflows since their inception, following significant bearishness last month. BlackRock’s IBIT ETF now holds 626,000 coins, dominating the market. In contrast, its closest competitor, Fidelity, holds 198,00 coins. GBTC has experienced consistent outflows since converting from a trust to an ETF in January 2024, dwindling to 189,000 coins from an initial 619,000.
.jpg?ver=LcBT7skNb2w-1u7c2z5gNg%3d%3d)
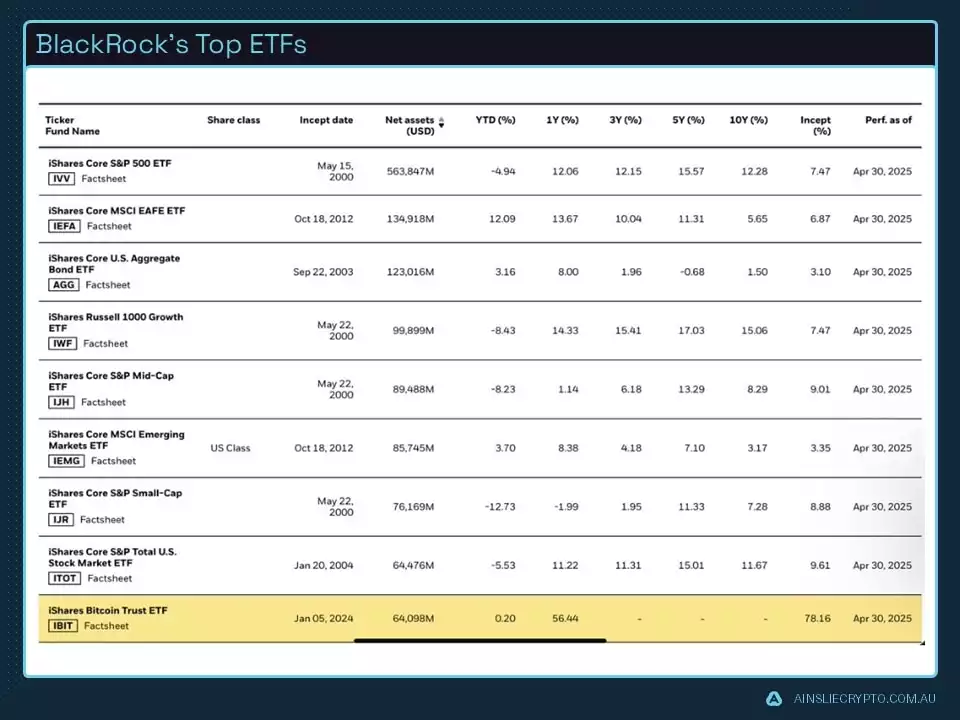
IBIT has achieved remarkable success within BlackRock’s ecosystem of over 1,400 ETFs worldwide. Launched just over a year ago with zero assets, IBIT now ranks among the top 10 ETFs, managing over US$64 billion in assets under management. Despite competing against ETFs with at least a decade-long head start, IBIT’s rapid rise suggests it will likely climb even higher by year-end.
Shifting from short- and mid-term price action to long-term trend analysis, we explore a trend long evident to Bitcoin investors but only now gaining traction in traditional finance. For decades, the 60/40 portfolio (60% stocks, 40% bonds) has been the gold standard for diversified investing, offering stability through periodic rebalancing to weather various market and economic conditions. However, changing dynamics—particularly bonds’ limited upside due to negative real rates in an era of increasing fiscal dominance—have diminished its appeal.
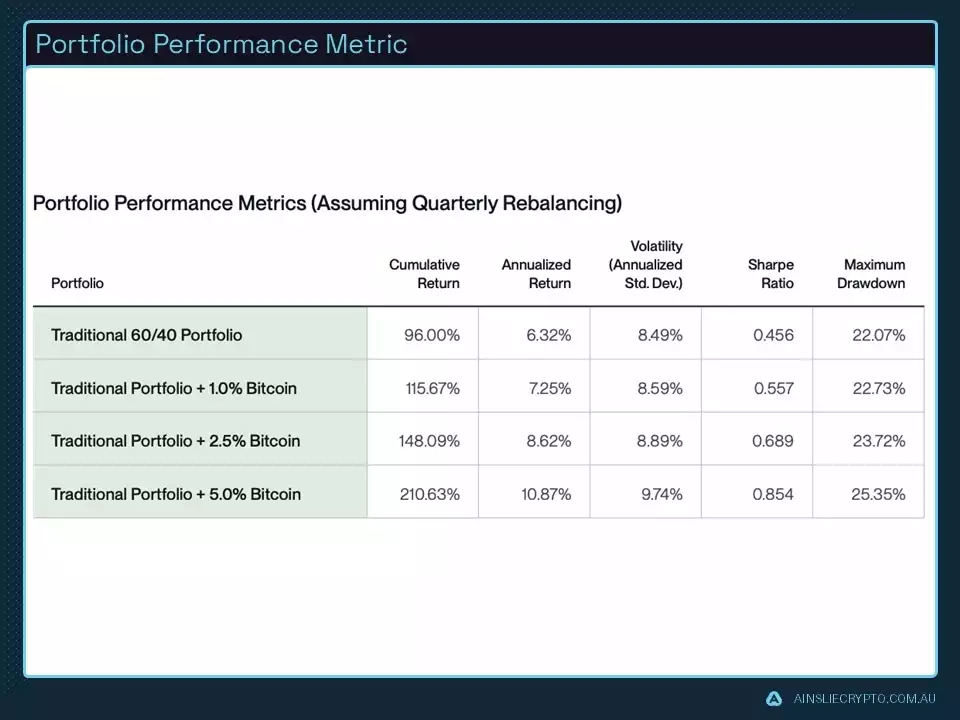
We first examine the performance of a traditional 60/40 portfolio without Bitcoin. From January 2014 to December 2024, this portfolio achieved a 96% return with quarterly rebalancing, equating to an annualised return of 6.32%. Respectable, but there’s room for improvement. The chart below illustrates the impact of adding a Bitcoin allocation to a 60/40 portfolio across diverse market conditions from January 2014 to December 2024, with quarterly rebalancing.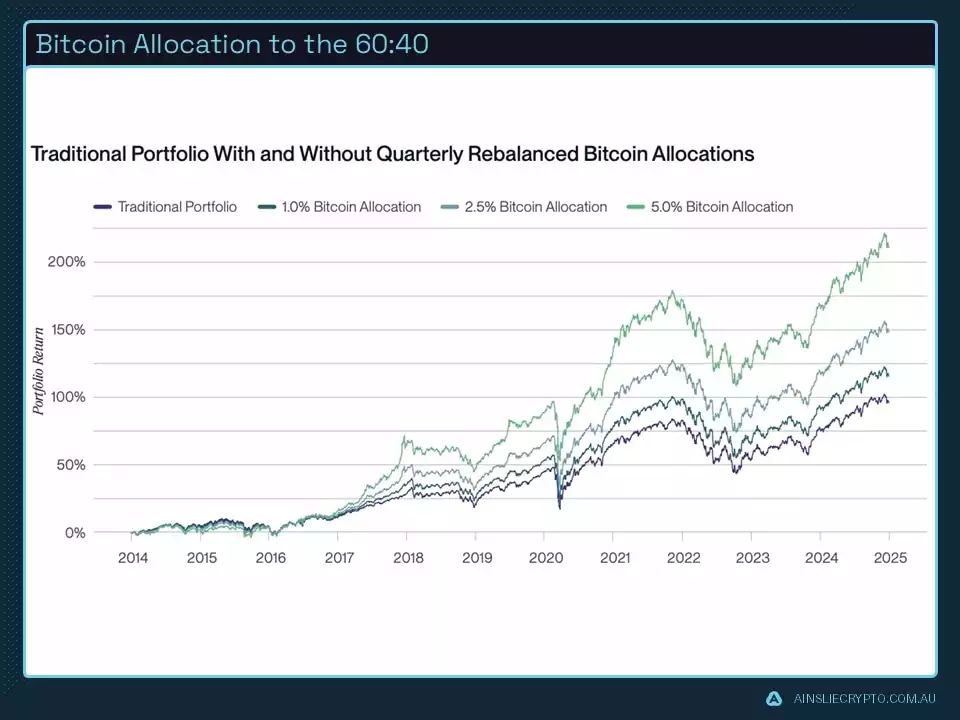
Adding a 2.5% Bitcoin allocation with quarterly rebalancing increased the portfolio’s cumulative return to 148.09%. Volatility rose slightly (8.89% with Bitcoin vs. 8.49% without), as did the maximum drawdown (23.72% with Bitcoin vs. 22.07% without). However, the portfolio’s Sharpe ratio, a measure of risk-adjusted returns, improved by 51%. A 5% Bitcoin allocation further boosted the cumulative return to 210.63%, more than doubling the traditional 60/40 portfolio’s total return.
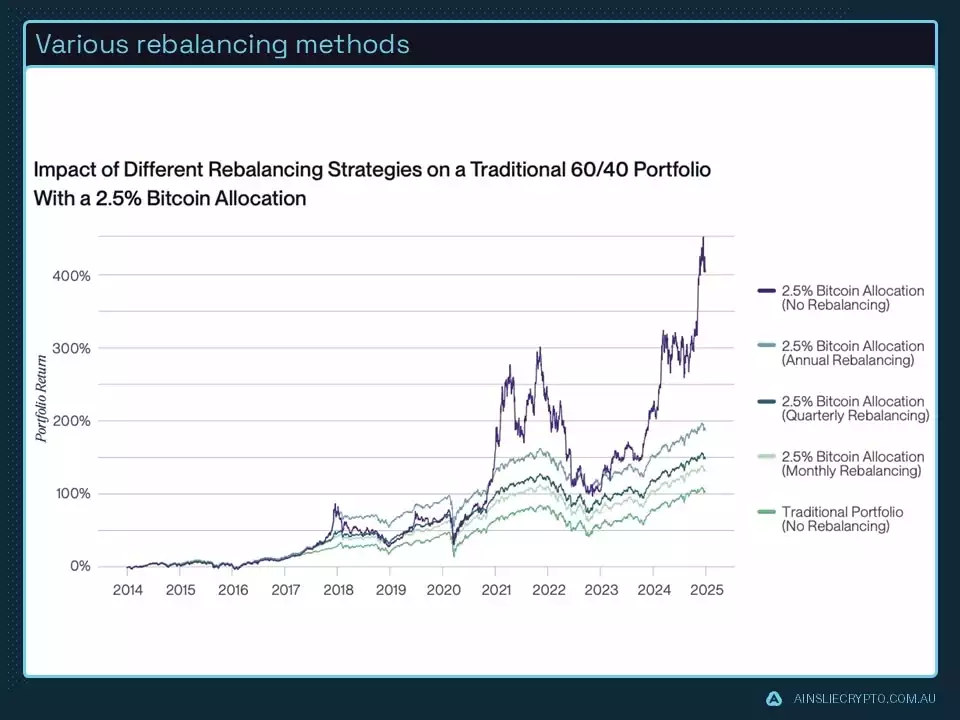
Rebalancing a portfolio involves selling the outperforming asset to buy the underperforming one. The chart below illustrates the significant impact of rebalancing strategies on portfolio performance. For a highly volatile but upward-trending asset like Bitcoin, less frequent rebalancing typically results in higher volatility, greater cumulative returns, and larger maximum drawdowns. Conversely, more frequent rebalancing reduces both volatility and returns.
Conclusion
Bitcoin’s surge past US$100,000 validates our bullish outlook, driven by a favourable global liquidity environment and a shifting macro cycle. Our Global Macro Cycle Indicator signals an ‘early phase’ with slowing growth and declining inflation, transitioning toward a ‘mid-cycle’ of rising growth and inflation. Expansive fiscal policies, such as Trump’s proposed tax cuts and Germany’s pivot from austerity, alongside China’s liquidity injections, bolster global growth. US ISM data indicates an economic bottom, with expansion imminent, reinforcing confidence post the US-China trade war pause.
Inflation, aligning with our leading indicator, has likely bottomed, with stimulatory policies poised to drive increases by early 2026. Central banks’ cautious liquidity injections, paired with the US Treasury’s short-term debt issuance, sustain market liquidity. The GENIUS Act, mandating stablecoin backing with Treasuries, and potential SLR adjustments amplify demand for US debt, facilitating government borrowing and indirectly expanding money supply.
Despite a slight dip in nominal liquidity to US$177 trillion, driven by a stronger dollar and weaker bonds, we anticipate resumed liquidity growth through 2026, positioning Bitcoin well for the rest of this economic cycle, assuming there are no major deflationary shocks.
Finally, as traditional portfolios face constraints in a shifting financial environment, Bitcoin’s growing acceptance among investors underscores its role as a valuable diversification tool, offering significant upside while maintaining manageable risk levels, making it an increasingly compelling addition to modern investment strategies.
Watch the full presentation with detailed explanations and discussion on our YouTube Channel here:
Until we return with more analysis next month, keep stacking those sats!
Joseph Brombal
Research and Analysis Manager
The Ainslie Group
x.com/Packin_Sat