Bitcoin Analysis: Beyond the Block – July 2024
July 18, 2024
Today the Ainslie Research team brings you the latest monthly update on Bitcoin – including the Macro fundamentals, market and on-chain technical metrics and all of the other factors currently driving its adoption and price. This summary highlights some of the key charts that were discussed and analysed by our expert panel. We encourage you to watch the video of the presentation in full for the detailed explanations.
Bitcoin and Global Liquidity
Bitcoin is the most directly correlated asset to Global Liquidity. Trading Bitcoin can be thought of as trading the Global Liquidity Cycle, but with an adoption curve that leads to significantly higher highs and lows each cycle. As such we look to buy Bitcoin during the ‘Bust’ phase or liquidity low, then rotate out of it during ‘Late Cycle’ where liquidity is over extended and downside protection is required (our preference is to rotate into Gold). When correctly timing and structuring the rotation, it is possible to significantly outperform ongoing monetary debasement. The Bitcoin cycle low was in November 2022, and since then the returns have been unmatched by any other major asset.
Where are we currently in the Global Macro Cycle?
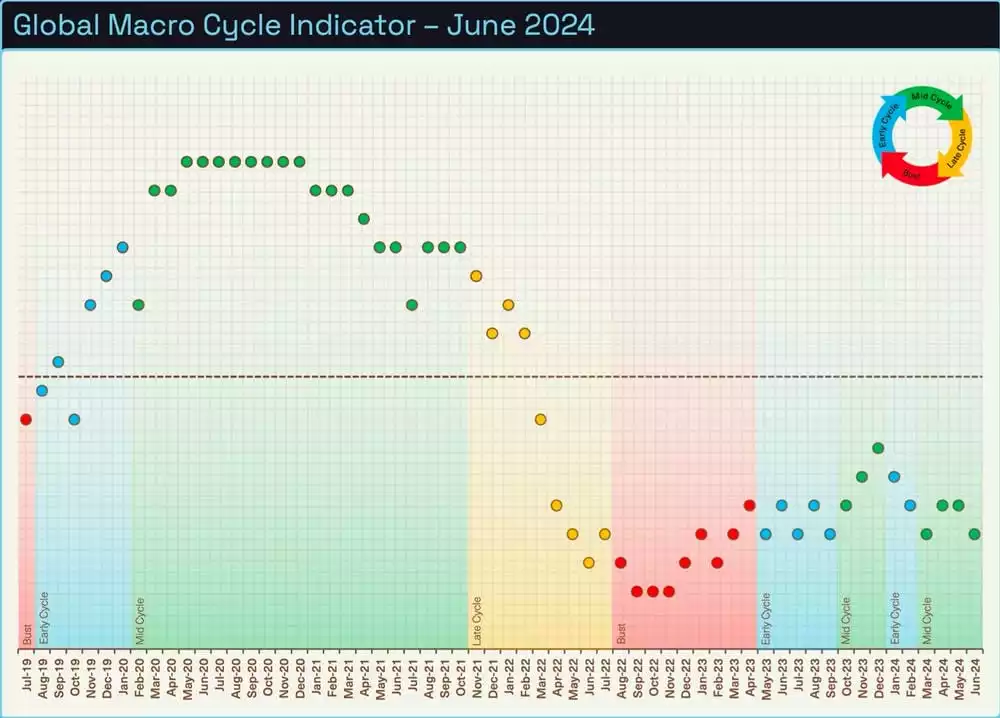
This month we have updated our Global Macro Cycle indicator with a fresh new look. What has not changed is where we are in the current cycle with ‘Mid Cycle’ once again dominating economic conditions. By no means is this a bad thing, with inflation still falling (albeit at a slower pace) and growth still reasonably robust, asset prices should continue to perform well. Throughout this month’s report, we will discuss why we maintain our conviction that liquidity and economic conditions will continue to improve throughout the rest of the year.
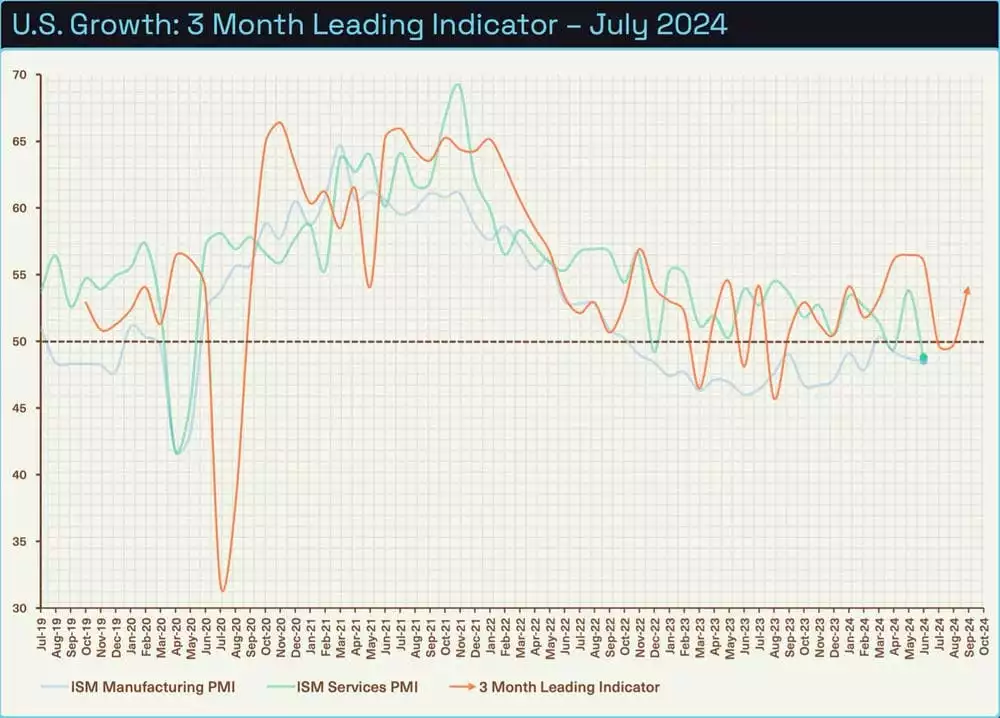
U.S. economic growth, as measured by the ISM data, is a useful tool to forecast the trajectory of the economy moving forward. Not much has changed from last month, arguably we’re in a goldilocks period where growth is slowing but not falling off a cliff. This gives the fiscal authorities a reason to manage the economy via stimulus.

The 3-month indicator, which incorporates new orders less inventories, shows a strong bounce into the back end of the year. For now, however, it’s more sideways action. As mentioned above, not necessarily a bad thing for asset prices.
What seems like a contrary opinion, we have maintained inflation will continue to fall throughout 2024. Our leading indicator has done a fantastic job of guiding us through the noise by providing us with a clear signal. Last week Core CPI, a key indicator for the Federal Reserve, came in at 3.2% year over year vs 3.3% expectations. Sure, the rate inflation is falling has slowed, but for now it’s still falling and that’s all that matters. As documented later in this piece, lower inflation is one of the falling dominos for rate cuts.

Where are we currently in the Global Liquidity Cycle?
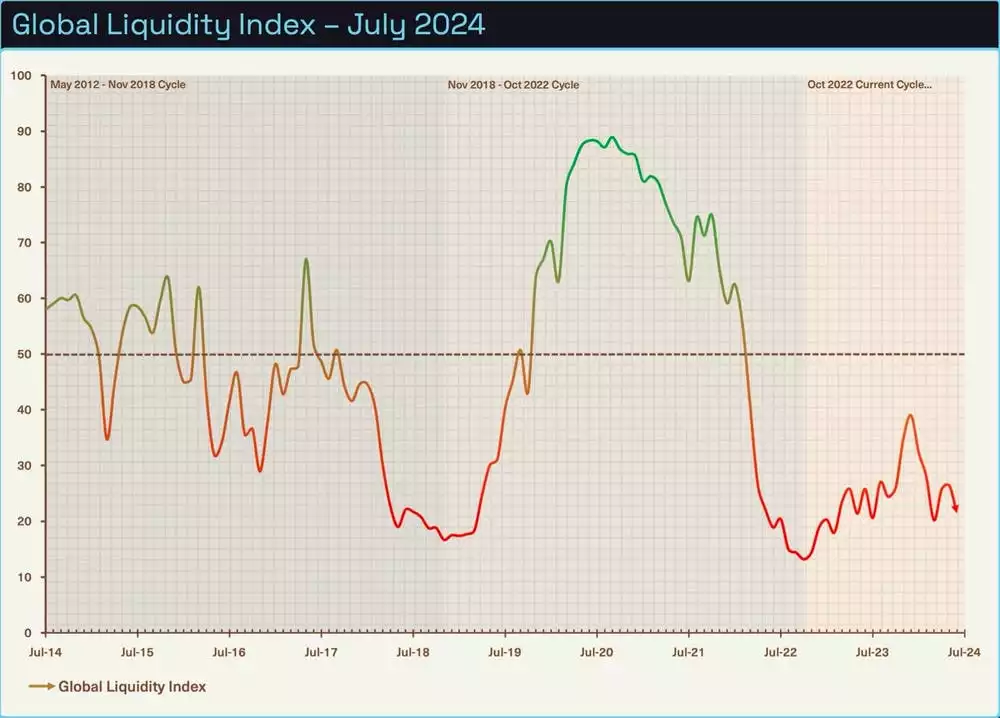
Global Liquidity leads the movement of World financial assets, so this is the indicator we look most closely at to determine where the opportunities are to take advantage of Bitcoin’s cycles.
In the June update we expected a more significant bounce to the upside, instead we have been met with more sideways chop. A good time to remind ourselves that liquidity expansion is a process and not an event.
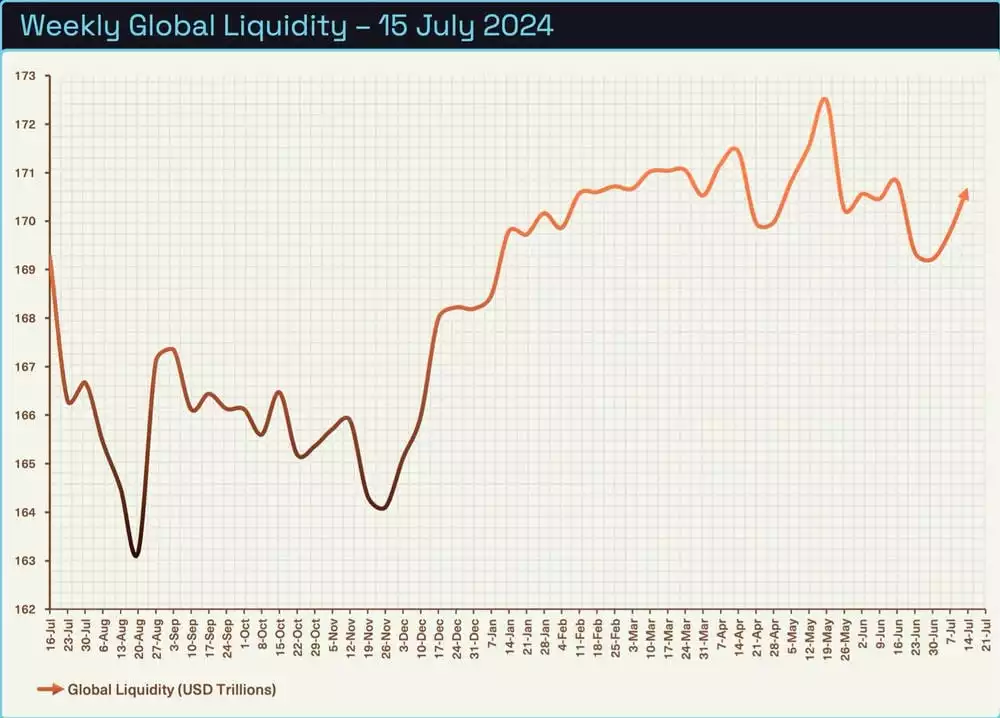
The weekly index is starting to head in the right direction after a ‘second air pocket’. Seasonality suggests that a draw down in the Treasury General Account and Reverse Repo should send liquidity higher in the next 1-2 months.
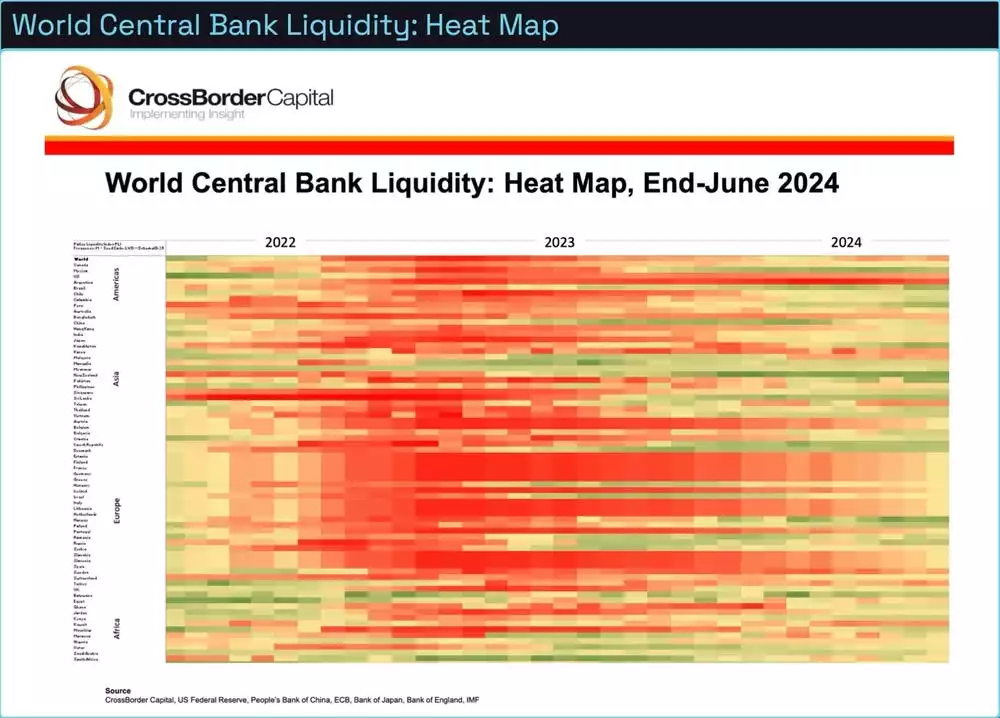
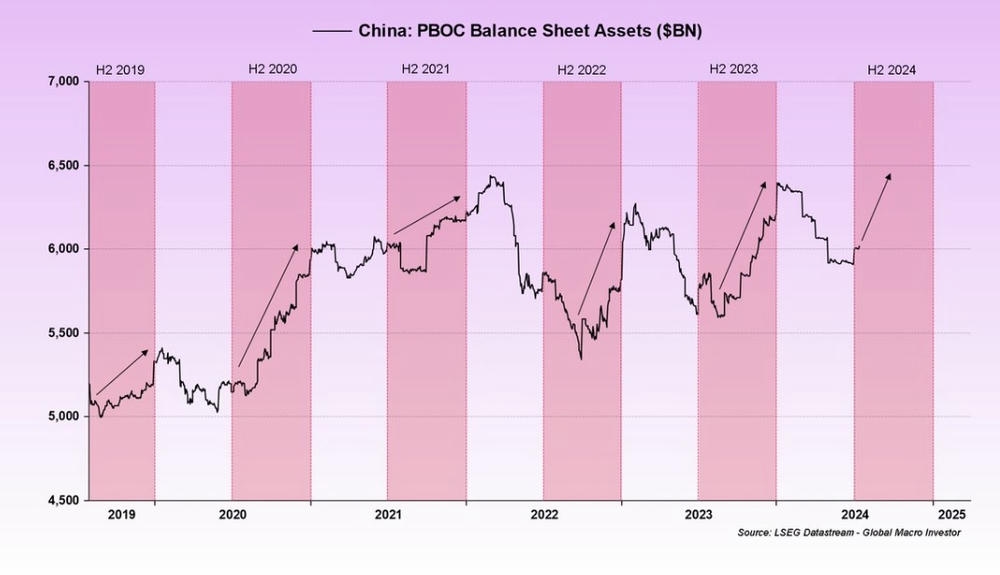
Central Bank liquidity continues to move in the right direction. Historically the US and China are the are the two major contributors to our Global Liquidity Index. While the US is slowly increasing liquidity, China has remained relatively tight in recent times. A weakening Chinese economy and seasonal factors look encouraging for an increase of liquidity for the back half of the year.
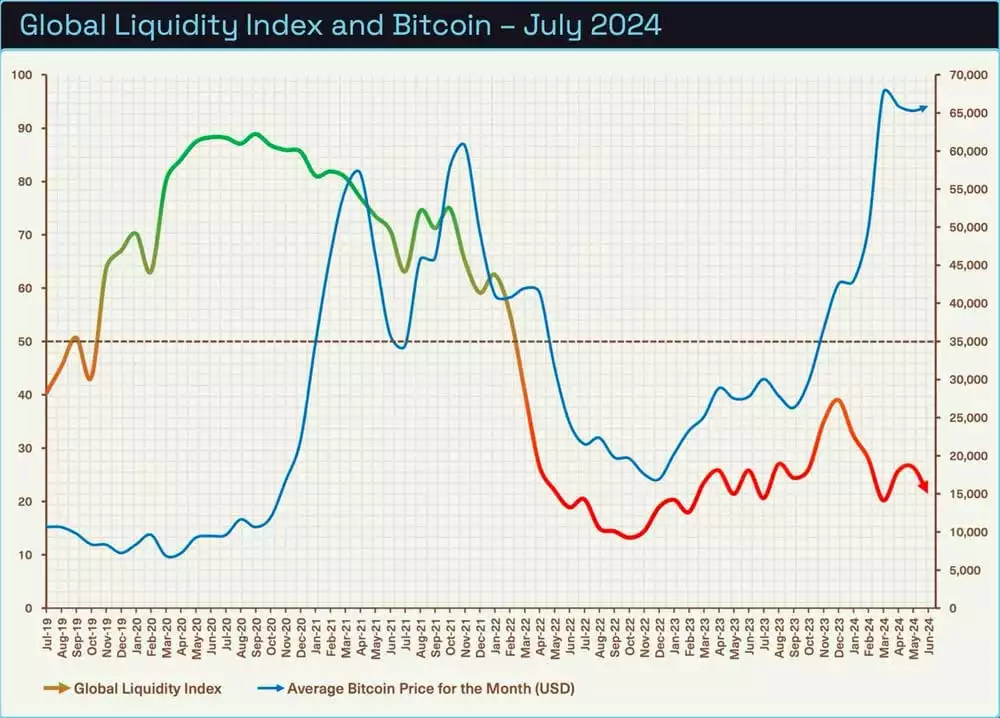
The Bitcoin monthly average price overlayed with liquidity tops and bottoms shows how sensitive it is to liquidity. As reported last month, Bitcoin’s price has had a sideways to downward bias which has not been unexpected based on liquidity conditions. There’s nothing like price action that grinds lower over a period of months to really drive sentiment lower. We continue to see dips as buying opportunities for what’s coming later in year.
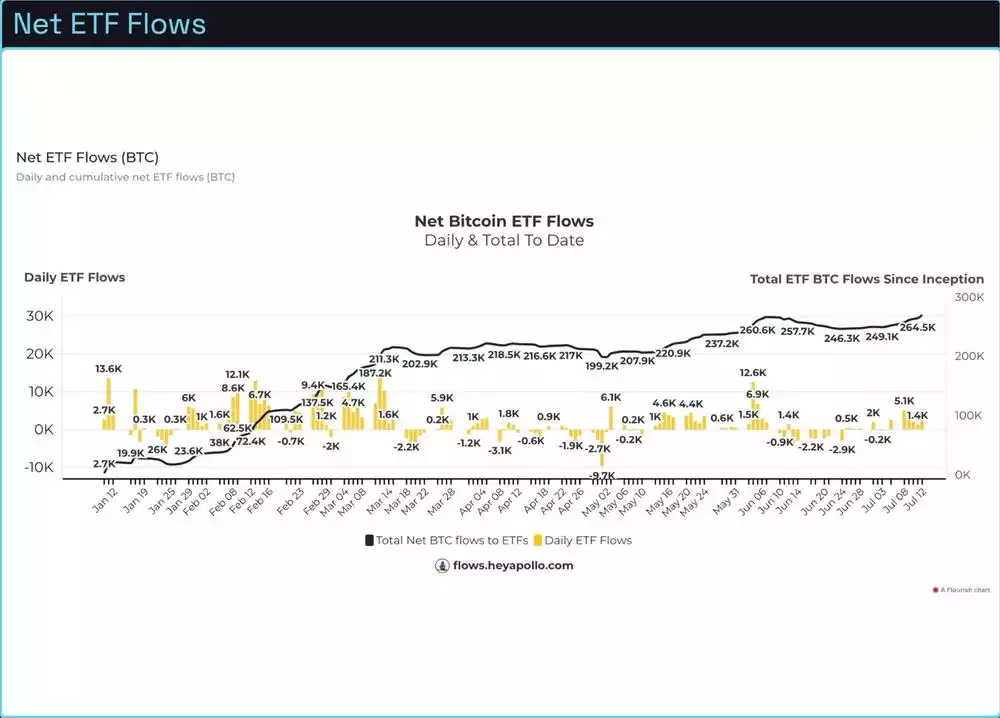
ETF flows boom post capitulation.
There has been much commentary over the past months from well recognised macro researchers in regard to the kind of people who hold their assets in Bitcoin ETFs. The belief was as soon as Bitcoin traded below cost basis, those holders would panic sell leading to a further cascade of selling. The average ETF buy price as of the 9th of July was around $55,000. Though as we have seen over the past week, ETF holders did the exact opposite of capitulate, adding over 1.3 billion dollars of Bitcoin to their holdings.
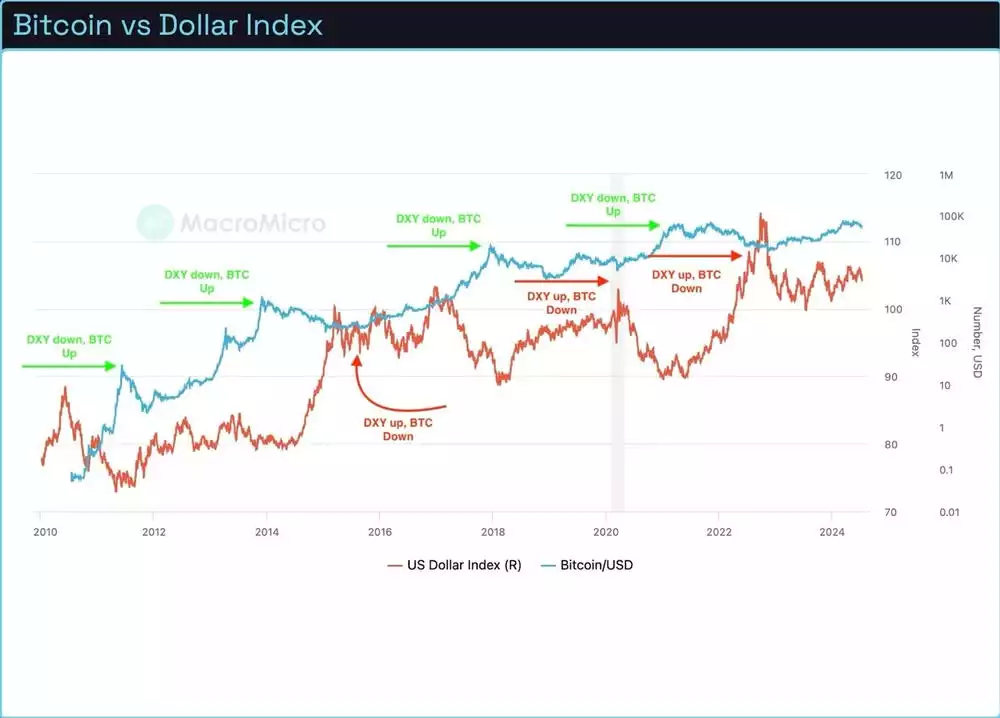
A picture paints a thousand words. Though not imperative to positive Bitcoin price action, a weaker DXY is like jet fuel for the Bitcoin price. Recently the DXY has chopped sideways, however our bias is a weaker USD towards the end of the year as the Federal Reserve loosens monetary policy by lowering rates and increasing liquidity to markets.
U.S. inflation is trending close to the Federal Reserve’s target and unemployment is also ticking higher. At time of writing, the market is predicting a 100% chance of a cut in September. 86% chance of a 25bps cut, and 14% of a 50bps cut.
For those who aren’t familiar with the DXY, it is simply an index of USD relative strength against a basket of other currencies. Notably, the Euro makes up 57.6% of the DXY, while the Japanese Yen and British Pound make up 13.5% and 11.9% respectively. The Canadian Dollar, Swedish Krona and Swiss France account for the rest of the basket.
Hashrate draw down is not a metric that most investors are looking at. However, it gives us an excellent insight of how miners are reacting to market conditions. When the Bitcoin halving occurred in April, the block reward was cut in half placing huge financial strain on the miners who were operating on fine margins. Miners sell Bitcoin to fund their operations and as the price fell, those who are on lower margins get squeezed and are forced to sell their Bitcoin reserves. The longer Bitcoin sells off or chops sideways, the more these miners run at a loss, then eventually capitulate by turning off their machines. Below we can see the hashrate has dropped by nearly 8%, leaving on the strong miners online. Historically this is a fantastic indicator for reversals.

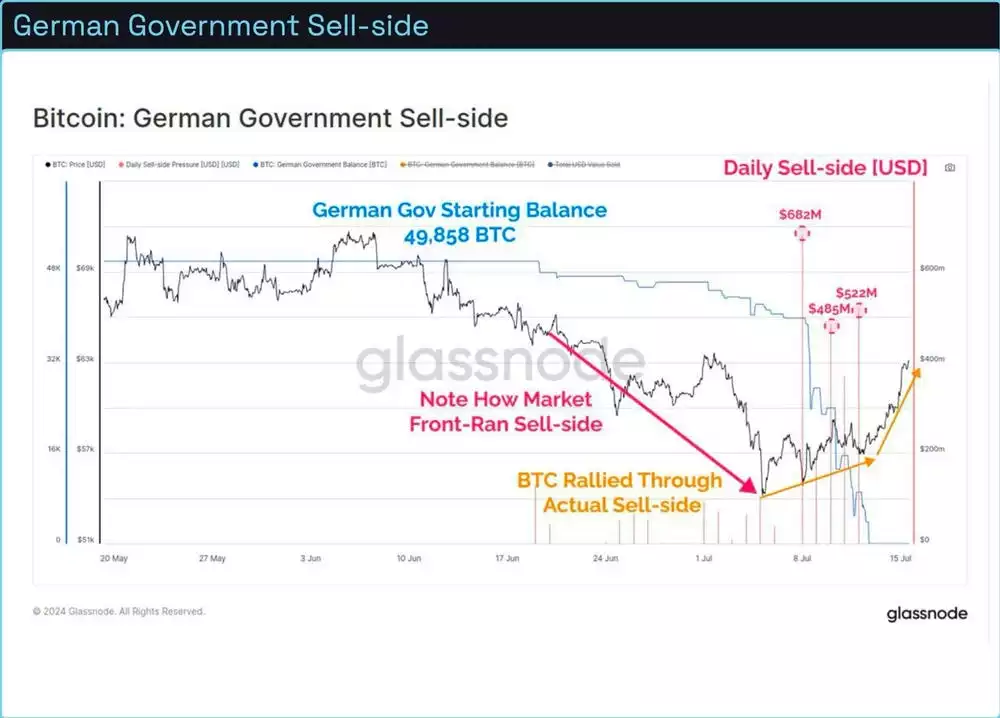
Finally, the chart below is a fantastic example of how news events and fear drives markets. Over the past month, a well-known entity in Germany (specifically the state of Saxony) had begun to dump 50,000 confiscated Bitcoin on the open market. The larger holders front run this news and dumped the price to a low of $53,200 before the price rallied during much of the sell pressure.
While Saxony accelerated it’s selling towards the end, panic amongst retail investors set in who contributed to selling volume by dumping their own coins. Little to their knowledge, the news had been front run, and they were selling their coins to willing buyers at the absolute bottom.
Lesson here is there’s a reason why most day traders lose money.
Conclusion
Reflecting on the previous chart and the one below, it is important to zoom out and not get caught up in the day-to-day gyrations of the market. The evidence presented in this report suggests we are still heading in the right direction, and the macro trends are turning from being a head, to a tail wind. We maintain out conviction that the second half of the year will be far more constructive for Bitcoin’s price appreciation compared to the last few months as liquidity continues to increase.
When markets sell off, look at the bigger picture. Welcome the opportunity to buy assets on the cheap.

Watch the full presentation with detailed explanations and discussion on our YouTube Channel here:
Until we return with more analysis next month, keep stacking those sats!
Joseph Brombal
Research and Analysis Manager
The Ainslie Group
Share this Article:
Crypto in your SMSF
Top Movers
Get Started Trading Crypto with Ainslie.
Join Thousands of satisfied customers who trust Ainslie for their cryptocurrency and bullion needs.


