Bitcoin Analysis: Beyond the Block – February 2025
February 20, 2025
Today the Ainslie Research team brings you the latest monthly update on Bitcoin – including the Macro fundamentals, market and on-chain technical metrics and all the other factors currently driving its adoption and price. This summary highlights some of the key charts that were discussed and analysed by our expert panel. We encourage you to watch the video of the presentation in full for the detailed explanations.
Bitcoin and Global Liquidity
Bitcoin is the most directly correlated asset to Global Liquidity. Trading Bitcoin can be considered trading the Global Liquidity Cycle, but with an adoption curve that leads to significantly higher highs and lows each cycle. As such we look to buy Bitcoin during the ‘Bust’ phase or liquidity low, then rotate out of it during the ‘Late Cycle’ where liquidity is over-extended and downside protection is required (our preference is to rotate into Gold). When correctly timing and structuring the rotation, it is possible to significantly outperform ongoing monetary debasement. The Bitcoin cycle low was in November 2022, and since then the returns have been unmatched by any other major asset.
Where are we currently in the Global Macro Cycle?
Welcome to the 1st anniversary of Beyond the Block episodes and reports. It is fair to say we have nailed this cycle so far by following the data and maintaining a bullish bias on Bitcoin which has been tough at times, particularly through last year’s 7-month consolidation. The good news is everyone who has followed along should be well in profit on their asset purchases, the bad news is we think this year is going to be the pointy end of the cycle and therefore a lot tougher to navigate. Particularly as we draw closer to the end of this year.
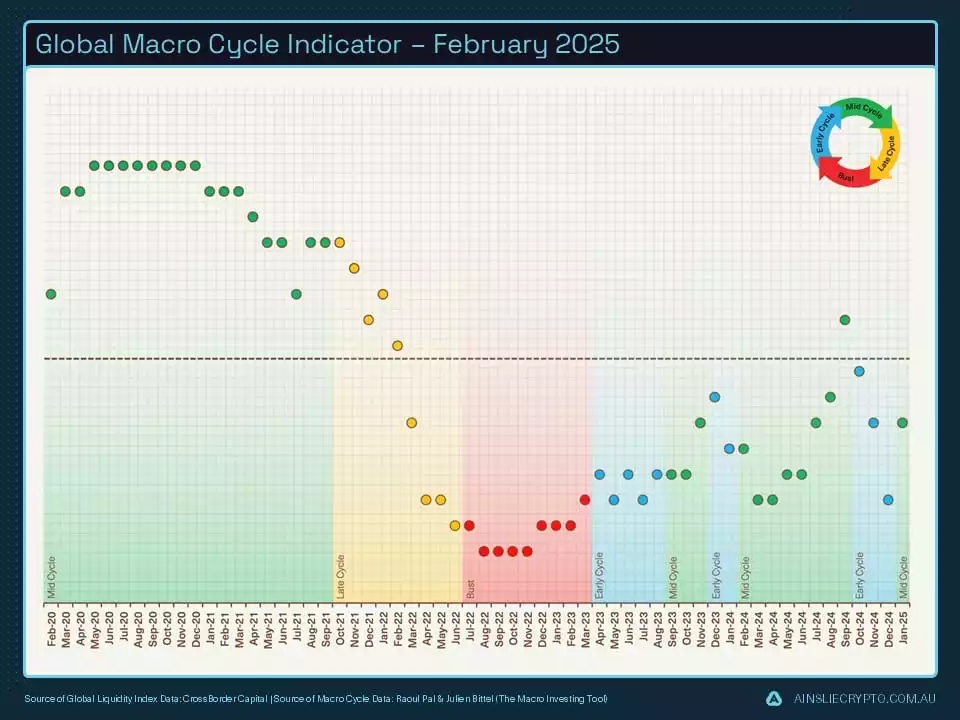
In saying that, we currently still have a bullish bias based on where we are in the macrocycle. There have been a few revisions in the chart below, but nothing that would force us to change our outlook as the revisions still leave us in ‘Mid Cycle’ where asset selection is risk on.
U.S. economic growth, as measured by the ISM data, is a useful tool to forecast the trajectory of the economy moving forward. We have now seen another month of manufacturing PMI ticking up with our 3-month indicator predicting more expansion ahead. This is exactly what we have been waiting for, we will explain why later in the piece.

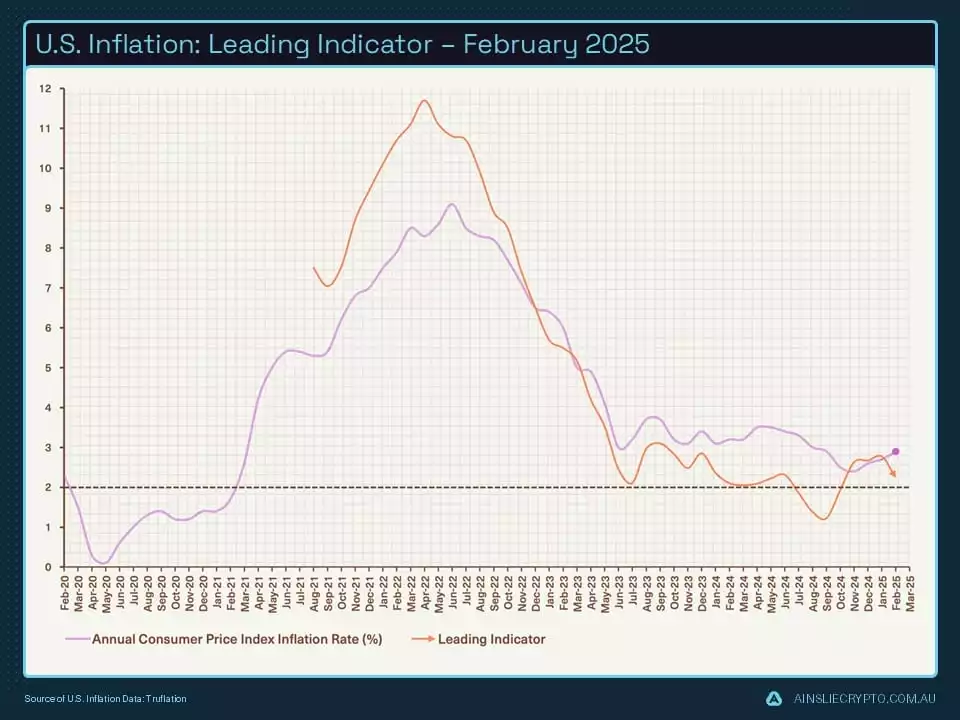
Inflation forms an important part of where we think we currently sit in the macrocycle. When inflation is high like in 2021 and 2022, there is political backlash from the public which causes a ‘reactive’ response from governments and Central Banks. This response is in the form of higher rates, tighter financial conditions and therefore, tighter liquidity which ultimately impacts asset prices negatively.
On the other side of the coin, governments want growth which requires debt loads to increase and expand the money supply. When these growth policies go too far, like during COVID-19, inflation will increase along with the money supply. Now we are not saying the world economy is going to be stimulated to the extent of what occurred during COVID-19, though we do think the bottom of inflation has occurred and predict a steady rise in line with the business cycle.
Where are we currently in the Global Liquidity Cycle?
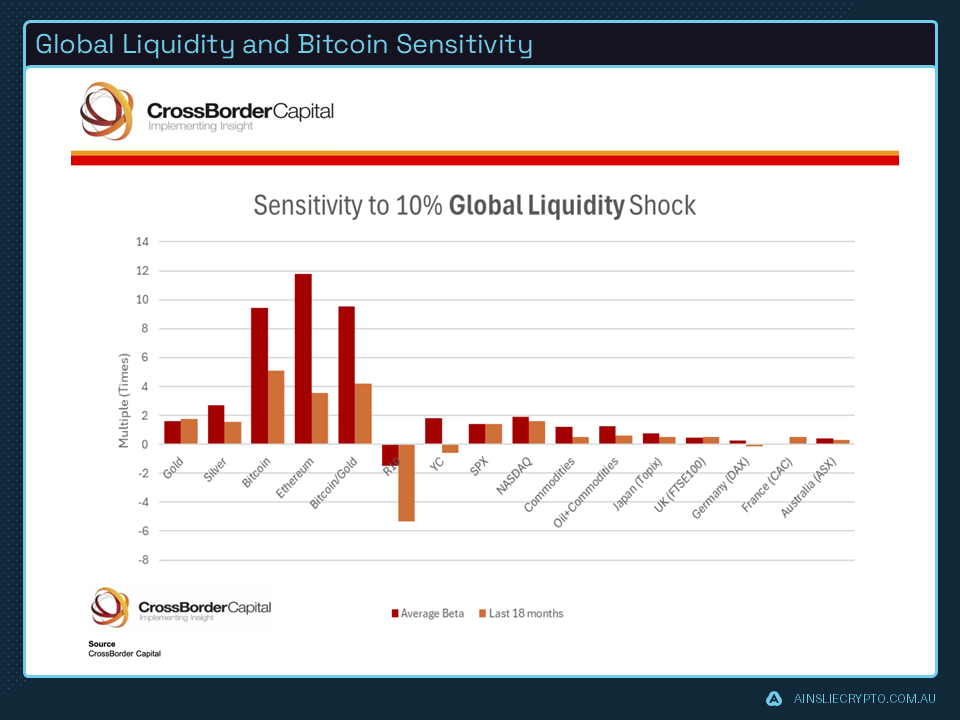
This month, we have included a new chart outlining why Bitcoin is the ‘fastest horse in the race’. Every asset class is correlated to liquidity; it’s just a matter of whether the individual can stomach the volatility of betting on the fastest horse.
This chart shows the degree of sensitivity for every 10% expansion in liquidity. The S&P, which is the global benchmark for stock portfolios, moves around 12% for every 10% rise in liquidity so you’re only just keeping your head above water. Since its inception, Bitcoin has done a 9x multiplier (red bar) for every 10% rise in liquidity which is why we call it ‘the fastest horse’. The multiplier has been reduced over the past 18 months as Bitcoin’s market cap has grown into the trillions, now ‘just’ a 5x multiplier (orange bar) for every 10% growth in liquidity.
If investors can stomach the volatility, asset allocation is obvious.
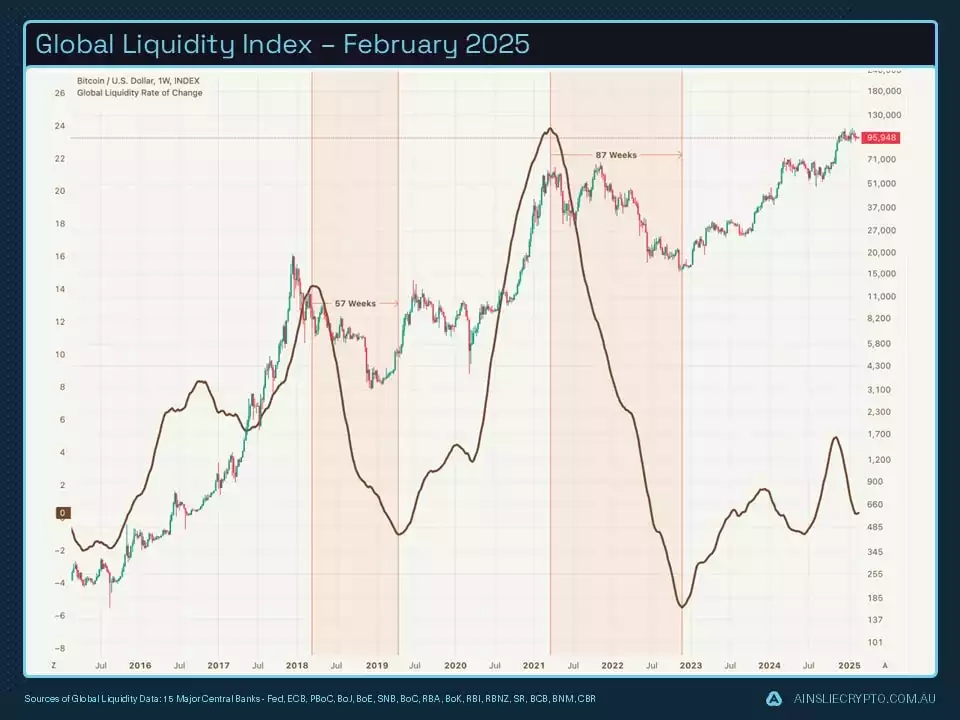
A historical illustration of Global Liquidity cycles since 1970 shows the ebbs and flows of liquidity and its impact, both positive and negative on financial markets. When liquidity is scarce, currency, banking and sometimes financial crises can follow. On the other hand, when liquidity is abundant, global markets experience asset booms.
Even though the liquidity cycle has been volatile and prolonged due to lingering inflation concerns. We have remained confident the liquidity cycle will continue based on where we are in the business cycle and the simple fact that if it were to end now, it would be the shallowest cycle on record.

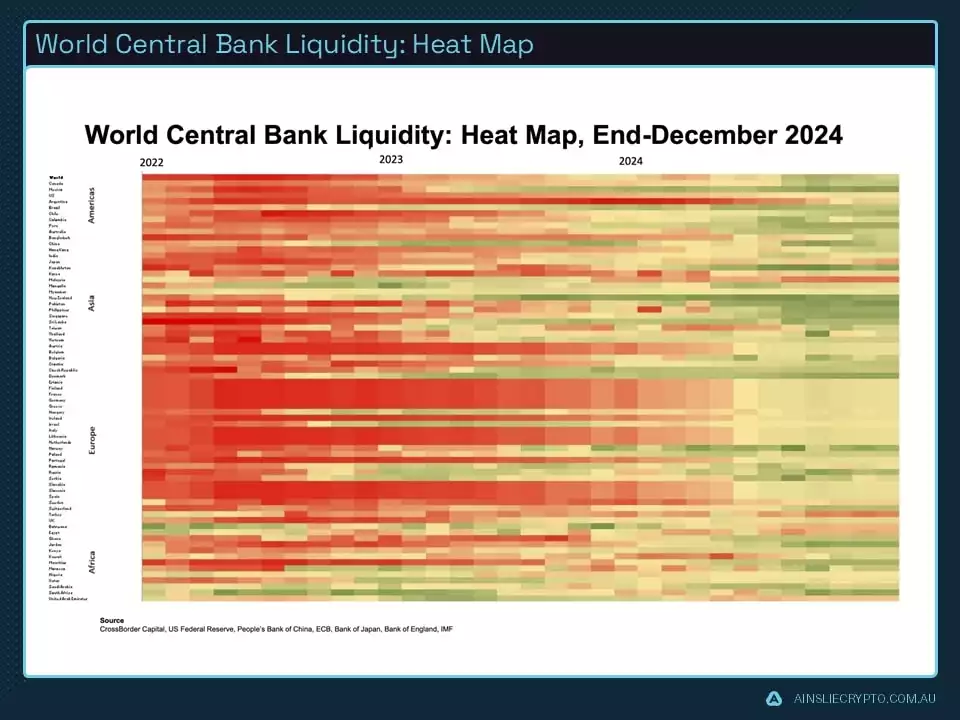
Last month we pointed out most central banks have moved to an easing cycle. Easing does not necessarily mean they are loose; they are just less tight than they were 12 months ago. Several Central Banks are still in a neutral to tight liquidity stance and will likely remain there, defending their currencies until there is a weakening in the U.S. dollar. More on this soon.
After going through a period of liquidity momentum loss, the first green shoots are starting to appear with our indicator just starting to turn back up!
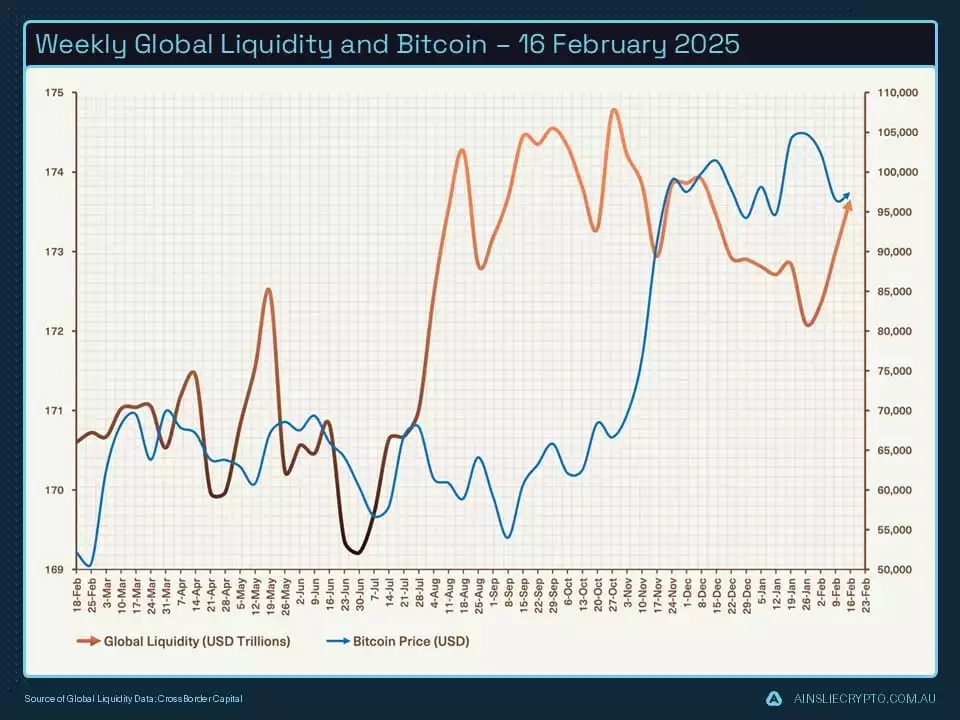
As expected, liquidity and Bitcoin’s average price are now converging once again. We were sceptical of Bitcoin’s price action as it moved towards all-time highs while at the same time, liquidity was shrinking. It looks as though Bitcoin is getting ready to move up again after a 2-month consolidation, now with the macro tailwind we’ve discussed so far.
Why the business cycle matters.
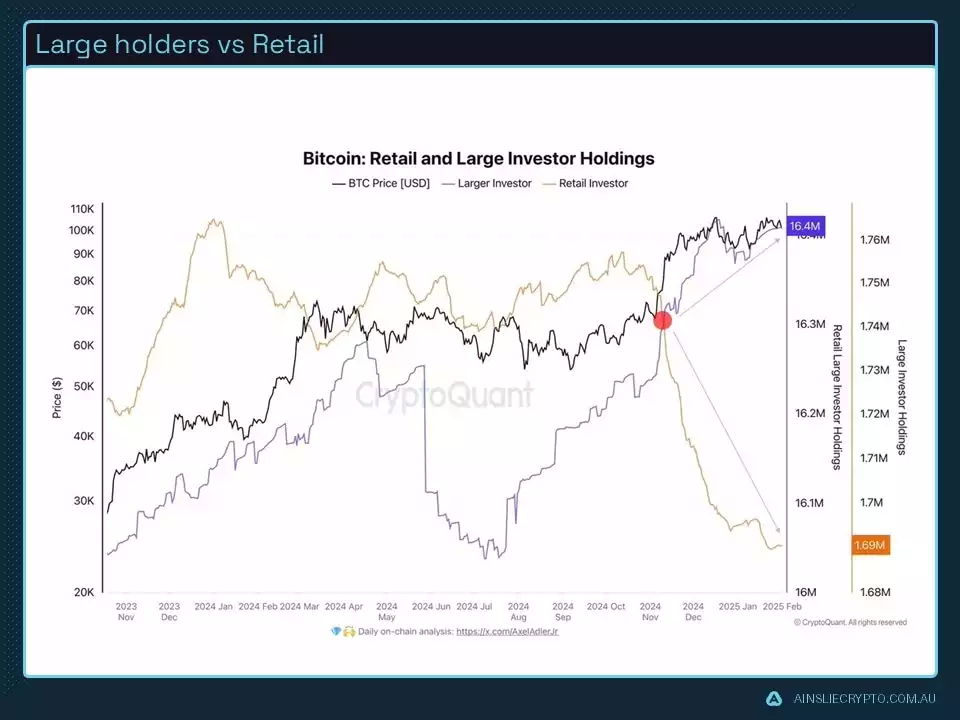
ETF flows aren’t included this month as they are flat and there is not much to report on that front. Instead, the chart below paints a clear picture of patient money (large investor) vs impatient money (retail). Post-election, indicated by the red dot has seen large investors continue to ramp up their Bitcoin accumulation while retail have continued to reduce their exposure. The regulatory framework over the next 4 years for Bitcoin in the U.S. has never looked better, so why is it that retail are so overly keen to exit Bitcoin? Maybe they think it’s the end of the cycle, maybe they are cashing out into meme coins and more speculative assets.
If so, both lines of thinking are ‘Missing the forest for the trees’.
Ok, circling back to the business cycle and why it is important. We know there is a correlation between the business cycle, the ISM specifically in this case, and Bitcoin’s performance. It makes sense right? As liquidity grows, the economy and financial conditions improve, and businesses have access to capital to expand and create more products and services. Jobs are created, earnings go up and wages increase which becomes a virtuous cycle of credit expansion, spending into the economy and investment.
We have only just broken through 50 on the index, indicating expansion, we are still early. Of course, the correlation is not perfect but once again we stress that the ISM is just one tool in predicting cycles.

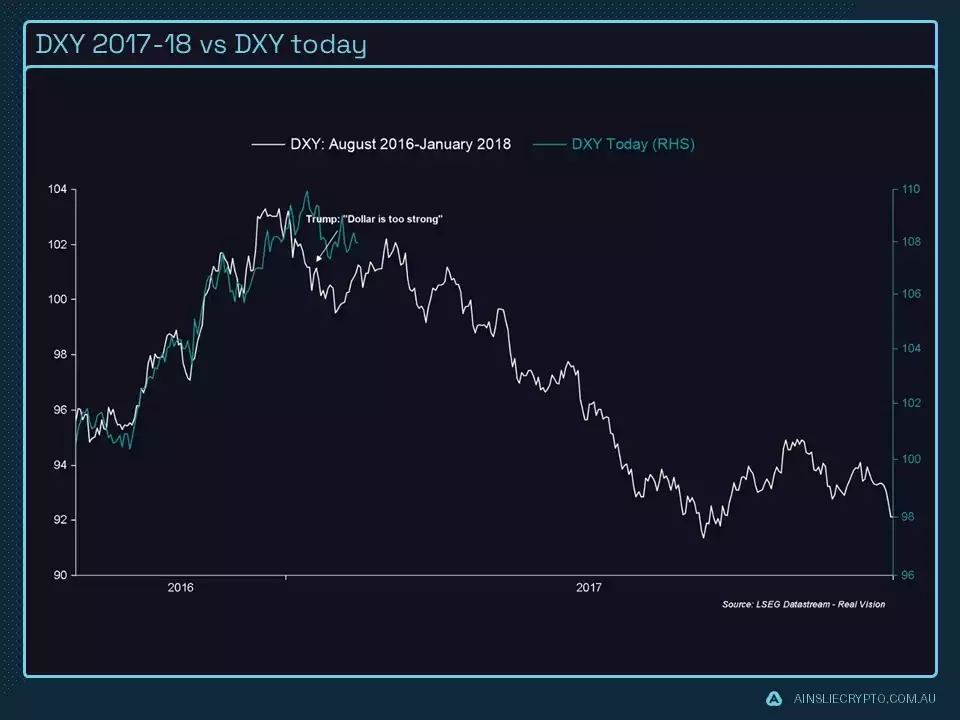
Last month we discussed how important a weaker dollar is for loosening financial conditions to boost liquidity and asset prices. A weaker dollar goes hand in hand with falling inflation and bond yields. The first domino has fallen with inflation starting to bottom out, bond yields are sure to follow causing the dollar to continue its weakening trajectory.
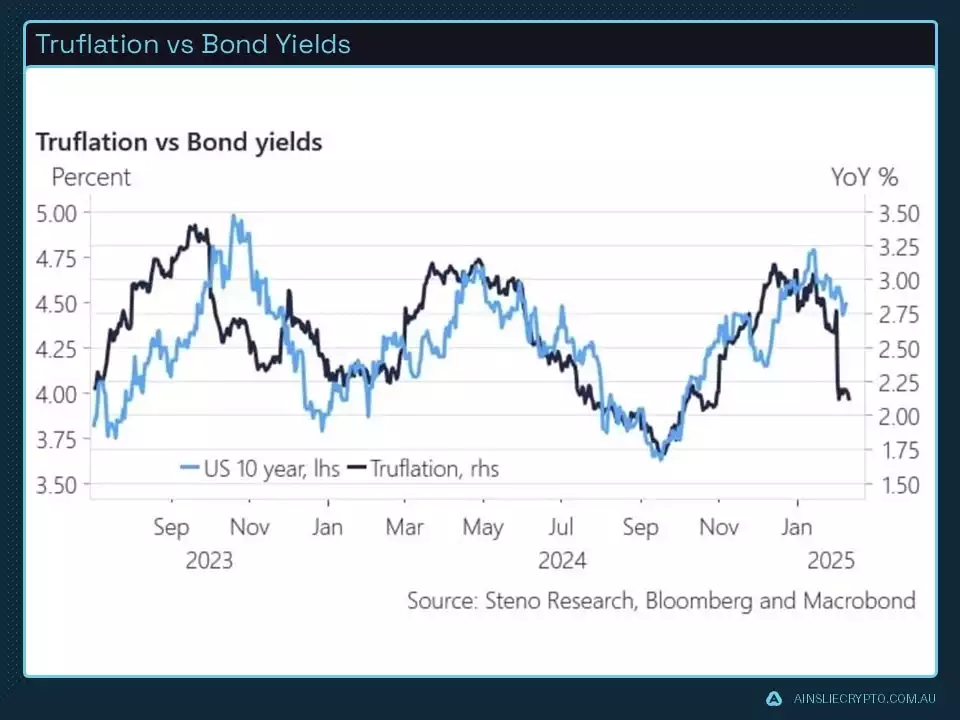
To add to the previous chart, and leading on from last month, there are signs the dollar is following a similar path to the last Trump presidency. Something we will continue to keep an eye on.
We’ve spoken a lot about how macro factors drive the short to mid-term price action of Bitcoin. This month let’s take a short look at what social issues will potentially drive Bitcoin’s price action in the long term. In other words, what factors cause Bitcoin to have a secular tailwind via adoption?
One potential influence is the disenfranchisement of younger generations. It was not that long ago an individual straight out of high school could go to college, university or some other form of tertiary education to get ahead in life. They could walk straight into a high-paying job with great benefits and buy affordable housing. Those days are becoming a distant memory. Those jobs are increasingly being taken by AI or outsourced overseas, affordable housing is no longer affordable, and all most students will end up with after leaving their education is a large student debt.
We already know younger generations are more likely to adopt technology, and they are certainly less inclined to be risk-averse. Combine that with feeling disenfranchised by ‘the system’ and you have Bitcoin as a long-term solution to their wealth inequality problems. This trend doesn’t slow, as wealth is passed down from the ‘boomers’ to ‘gen x’ and then ‘millennials’, more and more capital will flow into the digital asset ecosystem while at the same time demonetising traditional assets such as stocks and real estate.
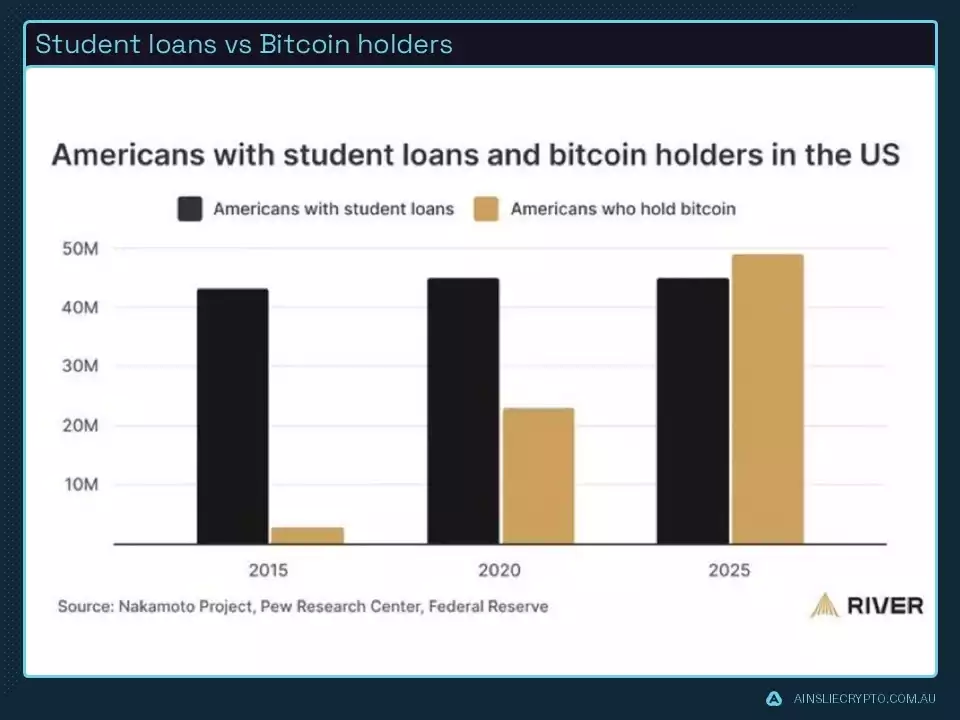
The last election in the U.S. proved the disconnect between the incumbent government and younger crypto voters. The Democrats under Biden spent four years shadow-banning crypto companies and individuals from the banking system while also regulating through enforcement via the SEC. Employing these policies when there are nearly 50 million voters in the U.S. who see Bitcoin as their one opportunity to create wealth is political suicide. The democrats will likely learn from this mistake and will change their tune next election cycle where Bitcoin will have bipartisan support.
Regardless of political views, a clear trend is starting to take place, the ratio of younger people holding Bitcoin vs holding student debt is rising. Is this the demonetisation of student loans and a complete shift in mindset away from labour towards capital?
Watch the full presentation with detailed explanations and discussion on our YouTube Channel here:
Until we return with more analysis next month, keep stacking those sats!
Joseph Brombal
Research and Analysis Manager
The Ainslie Group
Share this Article:
Crypto in your SMSF
Top Movers
Get Started Trading Crypto with Ainslie.
Join Thousands of satisfied customers who trust Ainslie for their cryptocurrency and bullion needs.


