Bitcoin Analysis: Beyond the Block – August 2024
August 22, 2024
Today the Ainslie Research team brings you the latest monthly update on Bitcoin – including the Macro fundamentals, market and on-chain technical metrics and all the other factors currently driving its adoption and price. This summary highlights some of the key charts that were discussed and analysed by our expert panel. We encourage you to watch the video of the presentation in full for the detailed explanations.
Bitcoin and Global Liquidity
Bitcoin is the most directly correlated asset to Global Liquidity. Trading Bitcoin can be thought of as trading the Global Liquidity Cycle, but with an adoption curve that leads to significantly higher highs and lows each cycle. As such we look to buy Bitcoin during the ‘Bust’ phase or liquidity low, then rotate out of it during the ‘Late Cycle’ where liquidity is over-extended and downside protection is required (our preference is to rotate into Gold). When correctly timing and structuring the rotation, it is possible to significantly outperform ongoing monetary debasement. The Bitcoin cycle low was in November 2022, and since then the returns have been unmatched by any other major asset.
Where are we currently in the Global Macro Cycle?
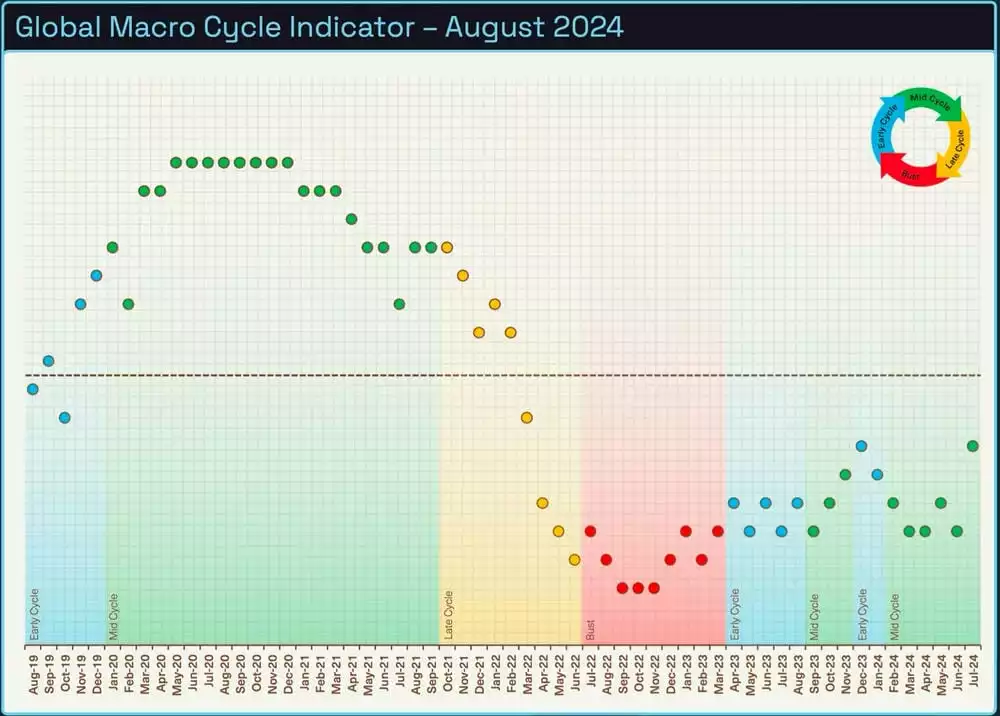
After many months of tracking sideways in the ‘Mid-cycle’, our Macro Cycle Indicator has started to tick up towards the neutral line. Contrary to popular belief, the global economic outlook is still looking robust which is translating into strong asset prices even after the global market sell-off at the start of the month. Many pundits are still calling the beginning of a bear market, but we can’t see it based on our macro and liquidity framework. Let’s dive in and take a closer look at the reasons why.
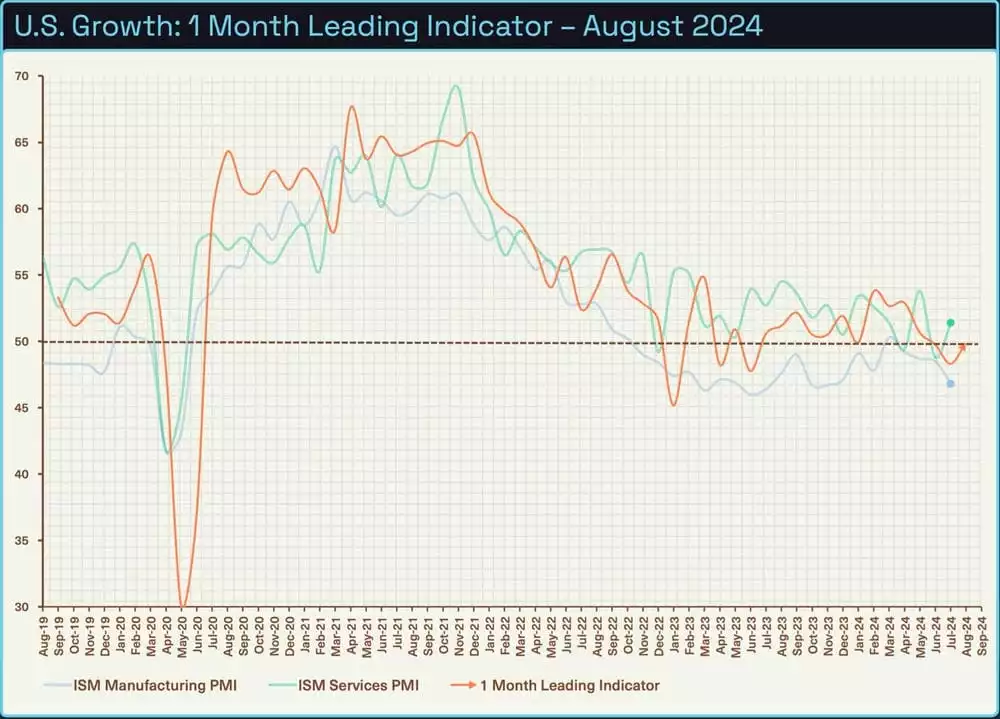
U.S. economic growth, as measured by the ISM data, is a useful tool to forecast the trajectory of the economy moving forward. Manufacturing has declined further into contraction while services have picked up. Overall, the leading indicator is still hovering around neutral with the expectation of picking up later in the year.
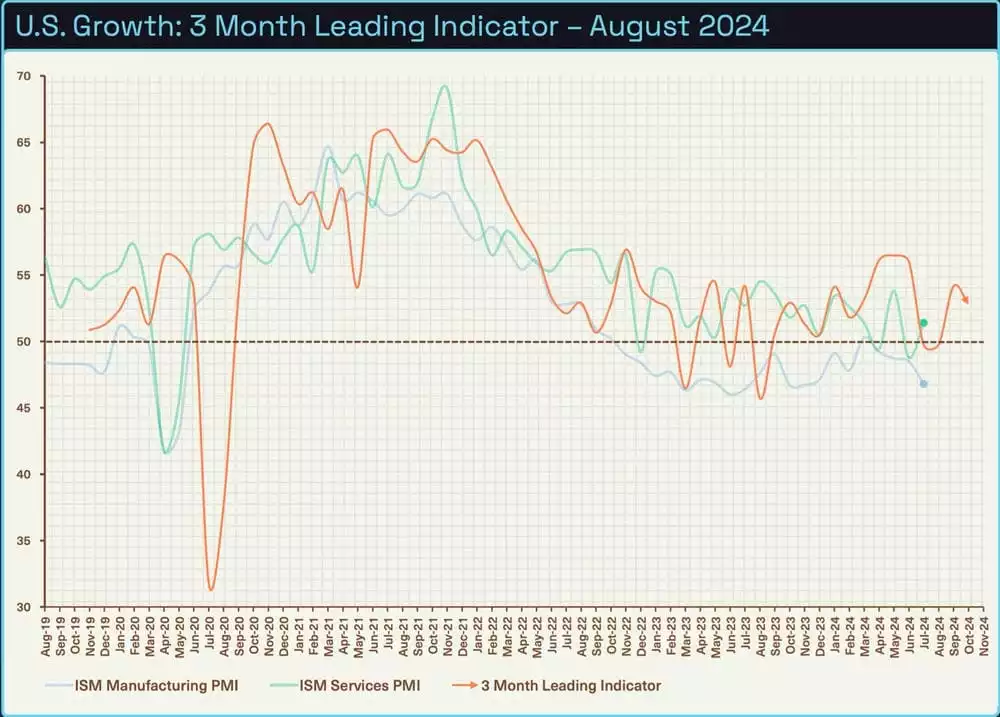
The 3-month indicator, which incorporates new orders less inventories, continues to show a mild bounce into the back end of the year. Investors need to remember this data is a slow-moving beast and can take some time to show a noticeable pick up into expansion.
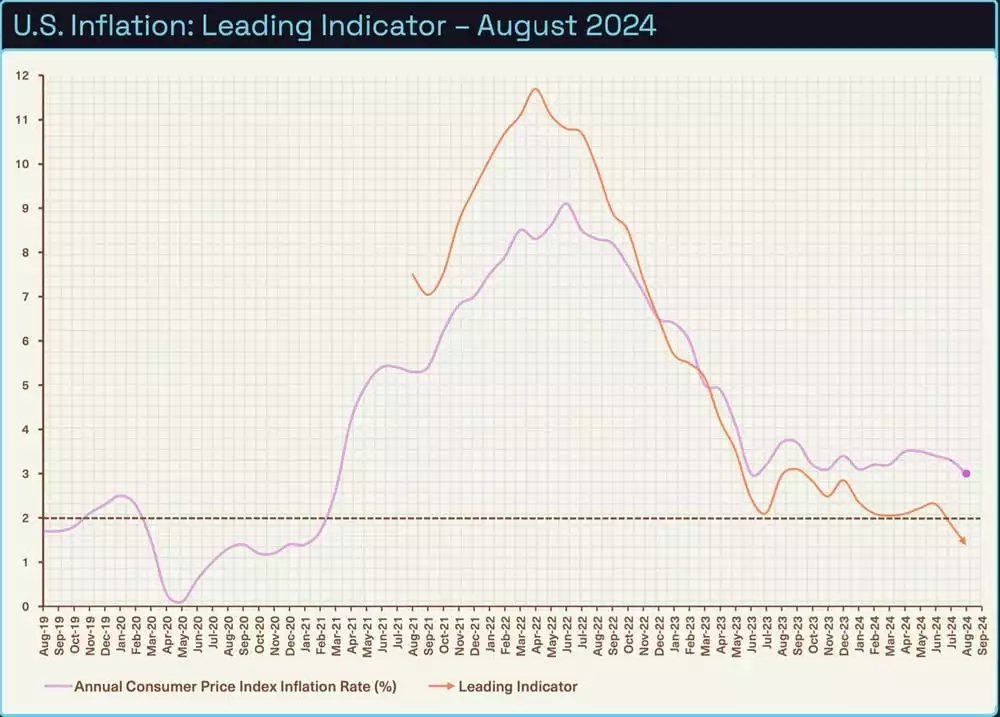
We continue to be ahead of the curve with regard to official inflation data. This month inflation in the U.S. by our estimates has made another low of 1.4%. Official data from the Federal Reserve also came in softer than expected paving the way for a 68% chance of a 25bps cut, and a 32% chance of a 50bps cut. While the Federal Reserve dictates monetary policy for the U.S., other central banks will follow suit allowing their respective governments to borrow more and fiscally stimulate their economies.
Where are we currently in the Global Liquidity Cycle?
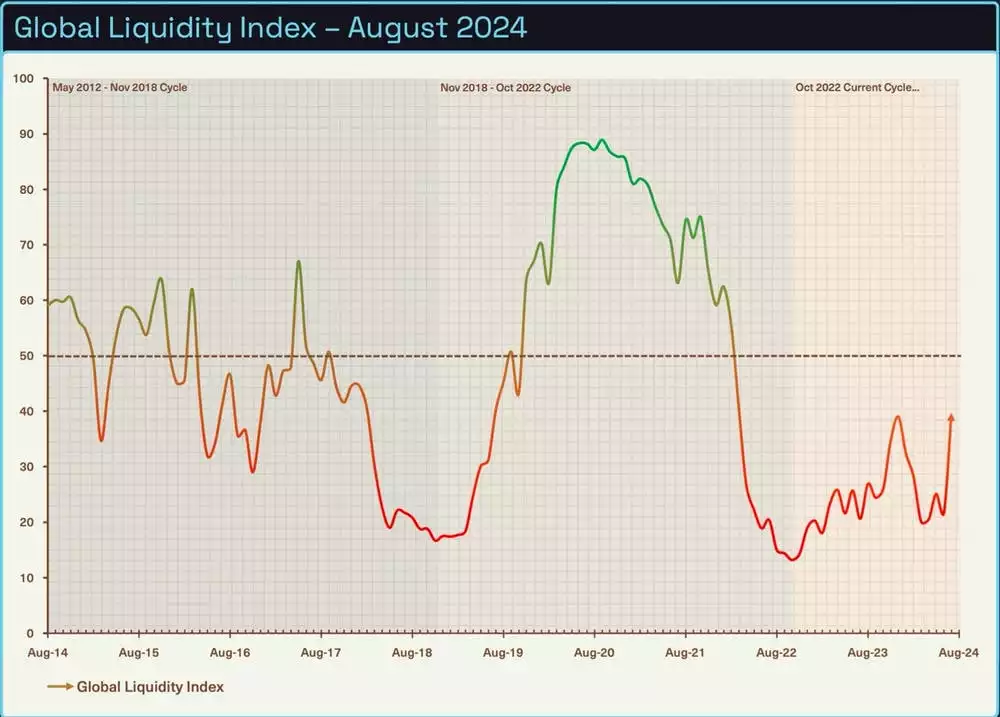
Global Liquidity leads the movement of World financial assets, so this is the indicator we look most closely at to determine where the opportunities are to take advantage of Bitcoin’s cycles.
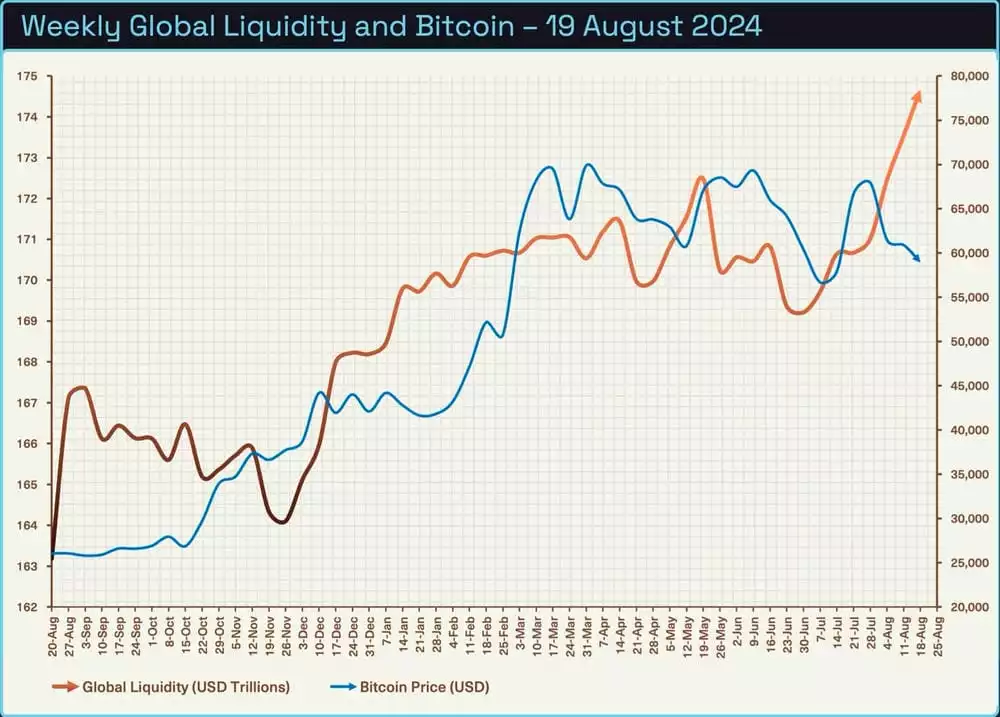
Since July’s update, Global Liquidity has remained below the neutral line but has increased significantly. Readers of last month’s update will recall our prediction of increased liquidity from China based on seasonality. China’s liquidity injections came a little harder and faster than we expected, however, we certainly are not going to complain.
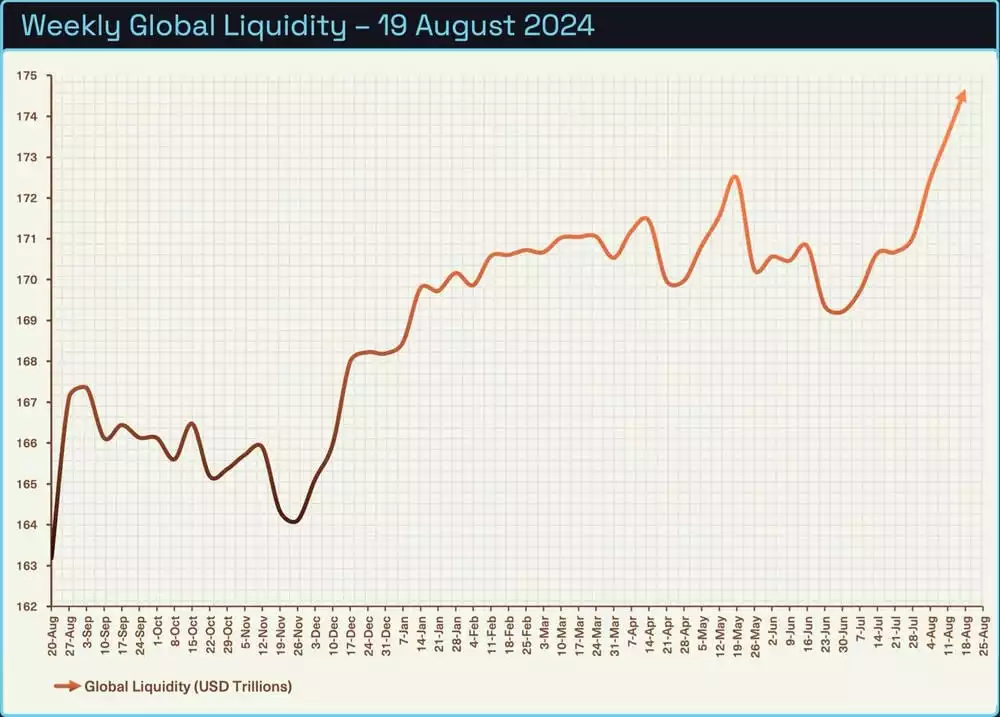
The weekly index has made another nominal high of nearly 175 trillion. Increases in Global Liquidity usually aren’t a straight line up so we don’t expect this rate of increase to continue, however, as we will continue stress, we believe we finish much higher by year’s end.
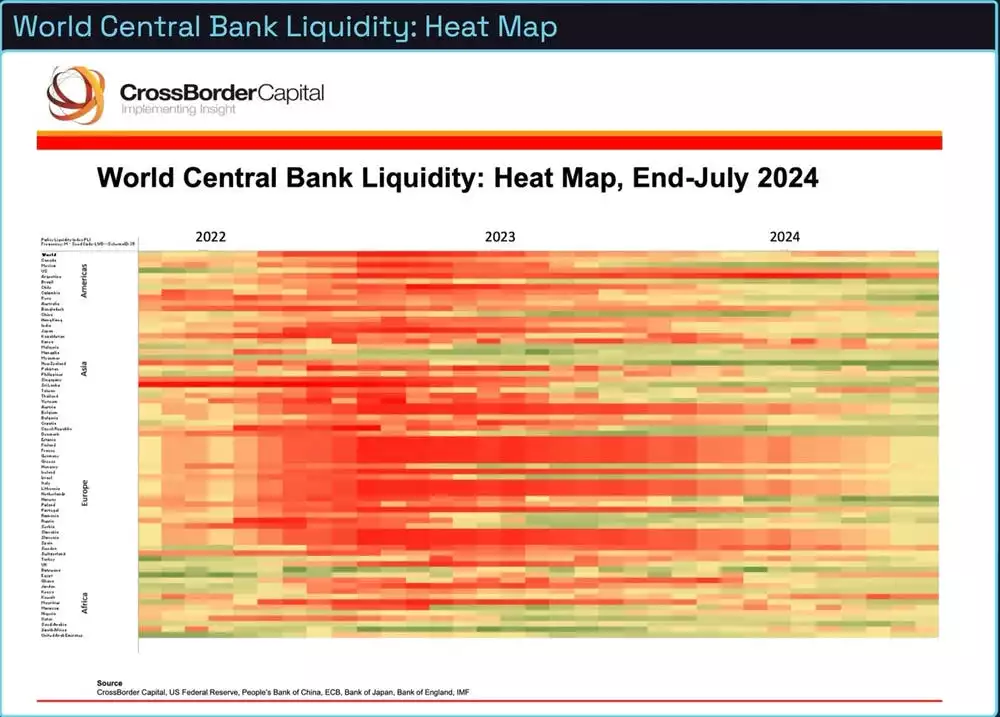
This month Central Bank liquidity is moving in the right direction once again. While China is certainly playing its part with positive liquidity flows, other central banks such as BOJ, ECB, BOE and the Fed are in somewhat of a neutral position with expectations they will expand later this year and early next year.
Below is a chart of the correlation between liquidity and world financial asset prices. As the world becomes more indebted and financialised, asset prices and the economy become increasingly correlated to liquidity cycles. If we can predict the direction of liquidity, we can predict the direction of asset prices and coincidently the strength of the economy.
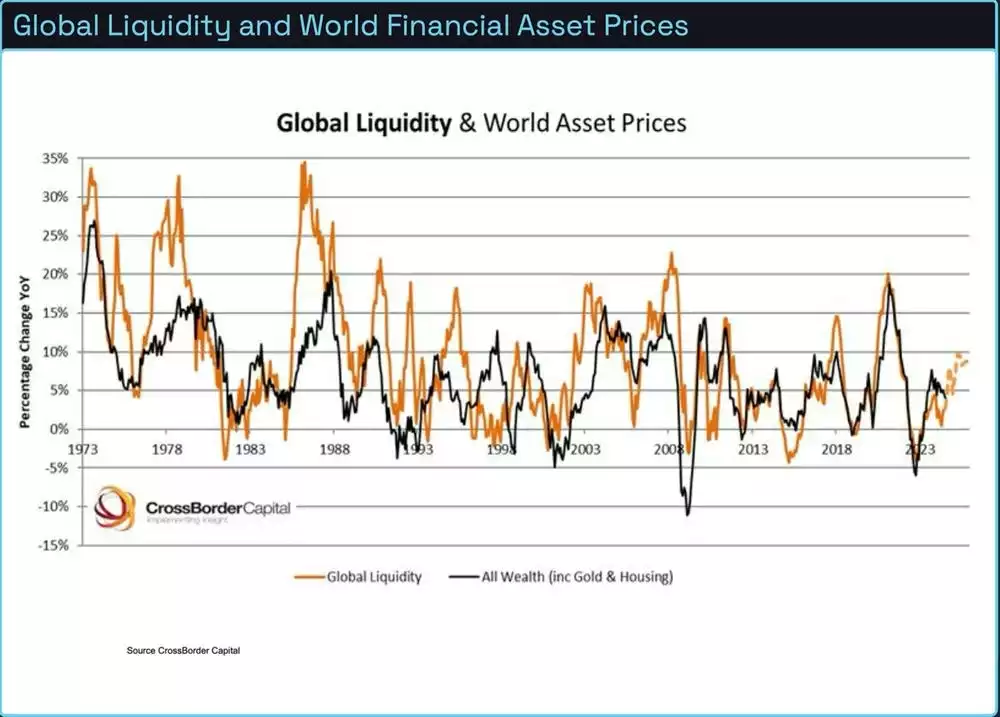
With this knowledge in mind and by overlaying Bitcoin’s sensitivity to liquidity, it’s increasingly likely that Bitcoin is going to play catch up at some point in the next couple of months. After a significant run into March 2024 and reaching new all-time highs, it was expected that Bitcoin would take a breather while the market digested the sellers who were taking profits.
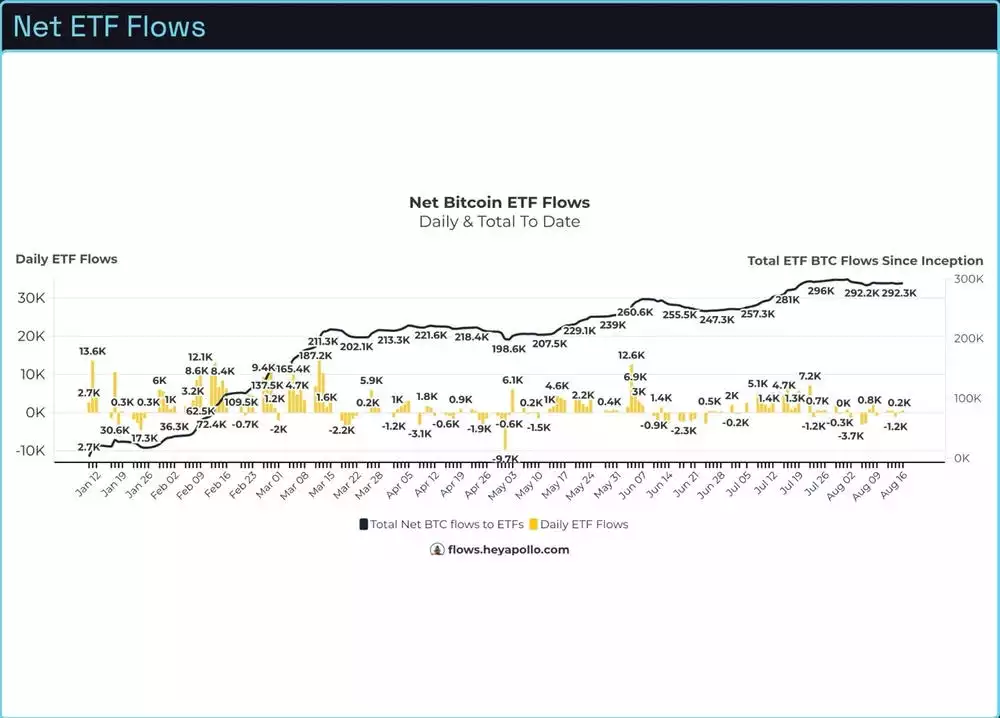
Let’s talk about ‘that’ sell-off.
Not much has changed here since last month in terms of accumulation with just under 300k BTC held across all ETFs. Holders did not panic and sell during the large drawdown below 50k which is encouraging from a long-term holder perspective. We stand by a prediction we made a couple of months ago that we won’t see a significant pick-up in flows until there is a clean break of all-time highs.
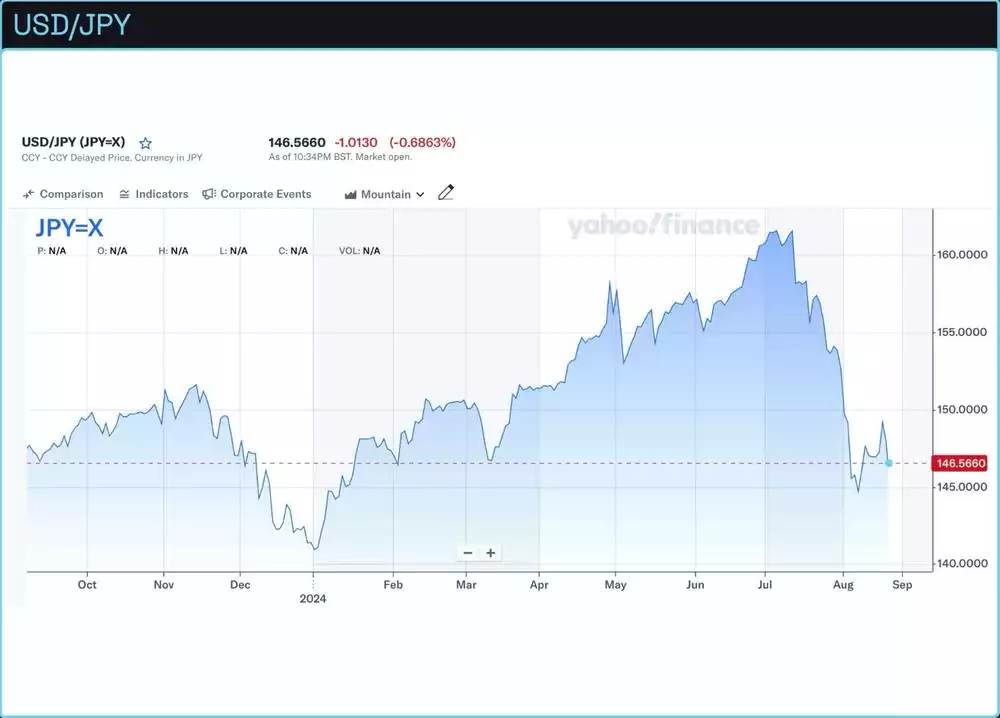
The Yen is what’s known as a ‘funding currency’. Thanks to a low-interest rate policy by the Bank of Japan, it’s extremely cheap for investors to borrow Yen and then go and buy assets in other jurisdictions. For example, an investor could borrow Yen at 2%, swap it for U.S. dollars and earn over 5% on short-dated treasury bonds. Alternatively, buy U.S. stocks with a historical return of more than 10% per annum.
Risk-free trade, right? Well, it has been for several years as investors piled into the trade creating a virtuous cycle of weaker Yen and higher U.S. asset prices, until 2 weeks ago when the trade violently began to unwind. After the recent BOJ meeting where rates increased from 0.1% to 0.25%, which is still very low but the highest in a decade and a half, expectations were for a hike in October to deal with the Yen becoming too weak and inflation rising too fast.
As the market started to digest the Bank of Japan’s policy pivot, investors became spooked and started to unwind the trade. This means selling the U.S. assets and exchanging those dollars back into Yen to repay the debt, kickstarting a not-so-virtuous cycle of stock market selling and Yen appreciation against the dollar. Risk assets began selling off and the Yen rallied.
Bitcoin trades 24/7 all around the world and many would say this is a feature. We agree, however, it does come with caveats. Outside of usual market trading hours, Bitcoin is a less liquid market than it otherwise would be during the week. Therefore, when global markets are blowing up early on a Monday morning and late on a Sunday evening, traders get margin-called and need to raise cash. When you get margin called, you sell what you have to, not what you want to, and Bitcoin is not immune to getting caught up in these liquidity events, particularly during lower liquidity trading hours on the weekend.
Seeing the Japanese stock market have its worst day since the Black Monday crash of 1987, Bank of Japan Deputy Governor Uchida was quick to declare that a hike is no longer necessary after a sharp rally in the Yen and a 12% fall in the Japanese stock market. Since these comments, stock markets, currencies and Bitcoin have all stabilised.
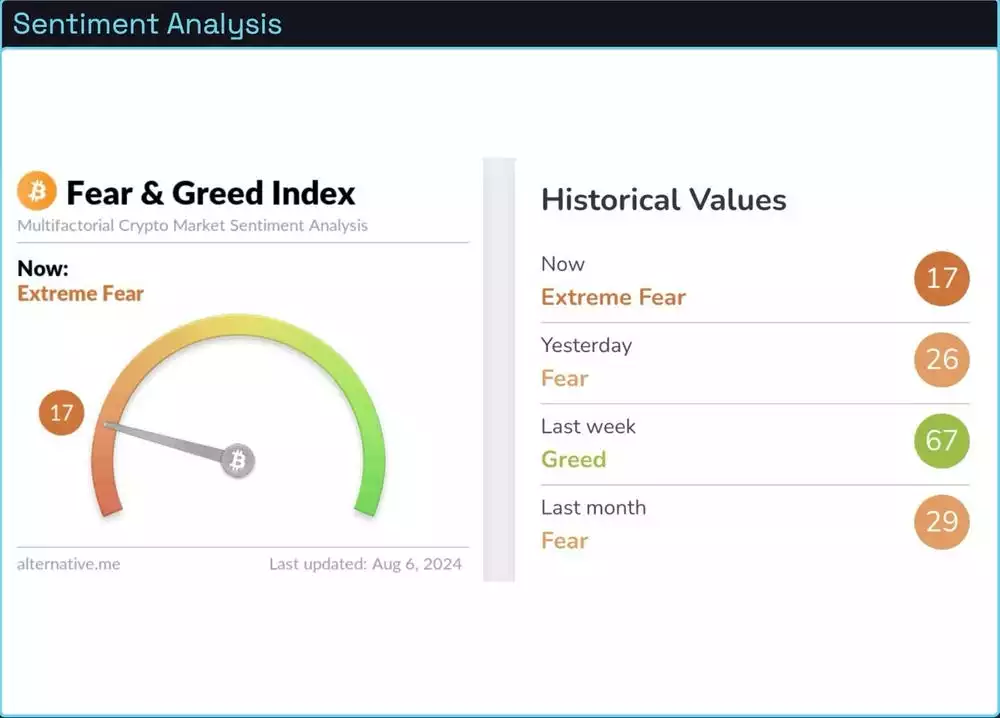
If you were living under a rock during the sell-off event, Bitcoin’s sentiment reached a low of 17. Levels that have not been visited since the FTX crash. How’s that for a contrarian indicator?
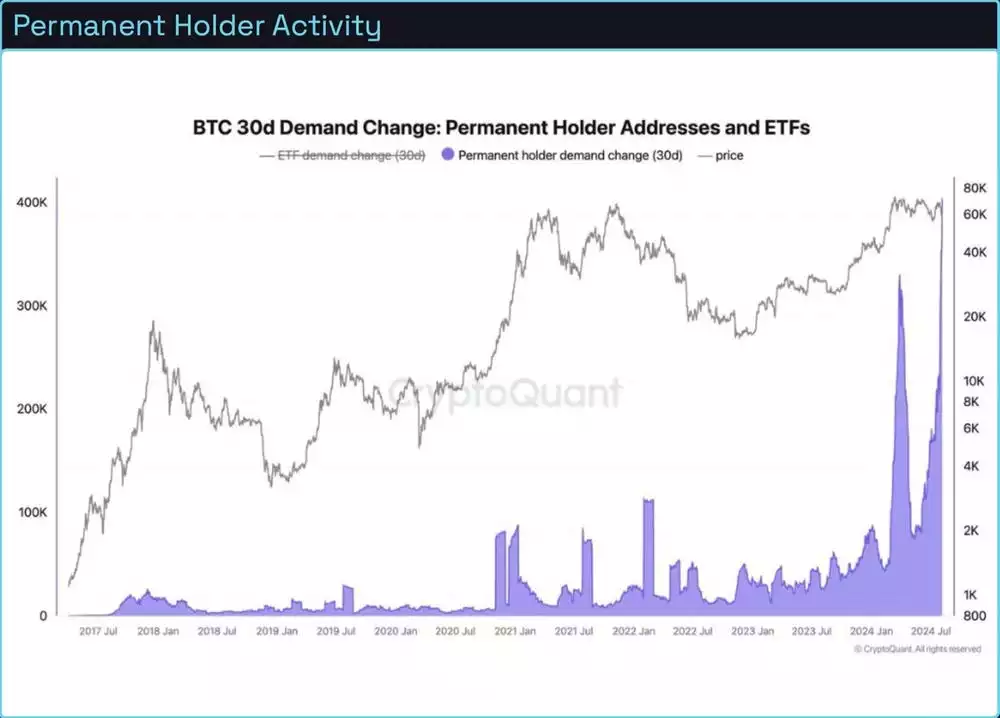
The term ‘permanent holder’ refers to individuals or organisations that intend to hold Bitcoin for a long period. Permanent holders bought the dip to the tune of 23 billion dollars. This chart shows the 30-day demand change in this cohort of buyers. While they don’t always buy the exact bottom, these buyers have an extremely low probability of selling any time soon. While others were panic selling, permanent holders were panic buying.
Conclusion
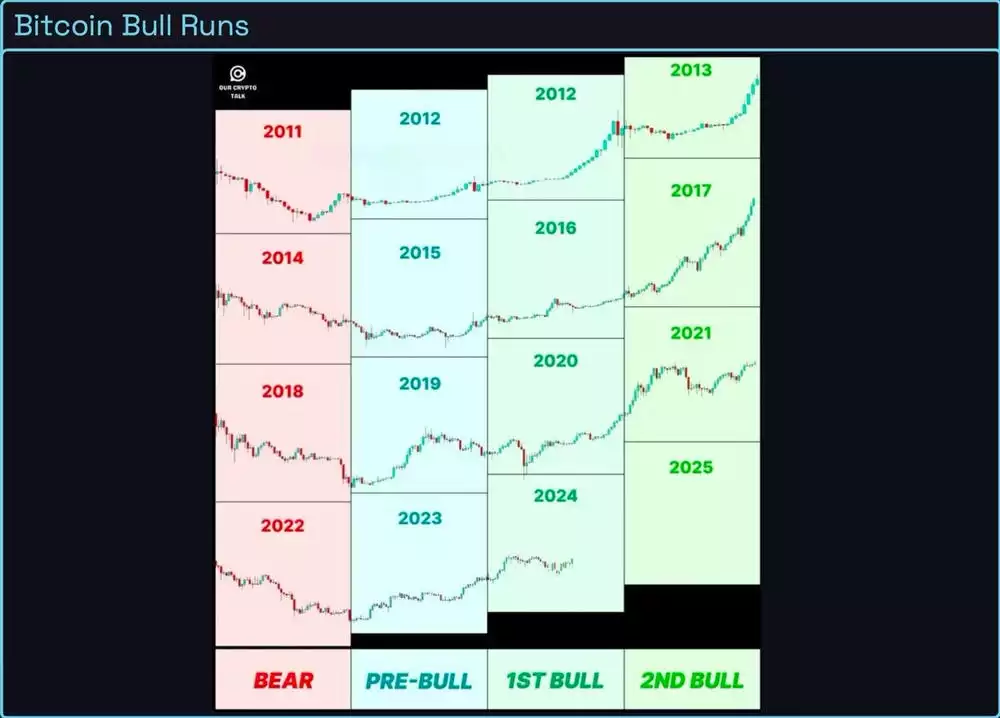
This current 5-month consolidation forms a base for the next leg higher. There is nothing new about how this Bitcoin price cycle has played out. Holders will get bored and dump their holdings, panic sellers will sell the dips, and investors will capitulate on negative headlines. But more importantly, long-term holders will reap the rewards of patience and conviction.
Watch the full presentation with detailed explanations and discussion on our YouTube Channel here:
Until we return with more analysis next month, keep stacking those sats!
Joseph Brombal
Research and Analysis Manager
The Ainslie Group
x.com/Packin_Sats
Share this Article:
Crypto in your SMSF
Top Movers
Get Started Trading Crypto with Ainslie.
Join Thousands of satisfied customers who trust Ainslie for their cryptocurrency and bullion needs.


