Bitcoin Analysis: Beyond the Block - May 2024
Posted on 16/05/2024 | 2054 Views
Today the Ainslie Research team brings you the latest monthly update on Bitcoin – including the Macro fundamentals, market and on-chain technical metrics and all of the other factors currently driving its adoption and price. This summary highlights some of the key charts that were discussed and analysed by our expert panel. We encourage you to watch the video of the presentation in full for the detailed explanations.
Bitcoin and Global Liquidity
Bitcoin is the most directly correlated asset to Global Liquidity. Trading Bitcoin can be thought of as trading the Global Liquidity Cycle, but with an adoption curve that leads to significantly higher highs and lows each cycle. As such we look to buy Bitcoin during the ‘Bust’ phase or liquidity low, then rotate out of it during ‘Late Cycle’ where liquidity is over extended and downside protection is required (our preference is to rotate into Gold). When correctly timing and structuring the rotation, it is possible to significantly outperform ongoing monetary debasement. The Bitcoin cycle low was in November 2022, and since then the returns have been unmatched by any other major asset.
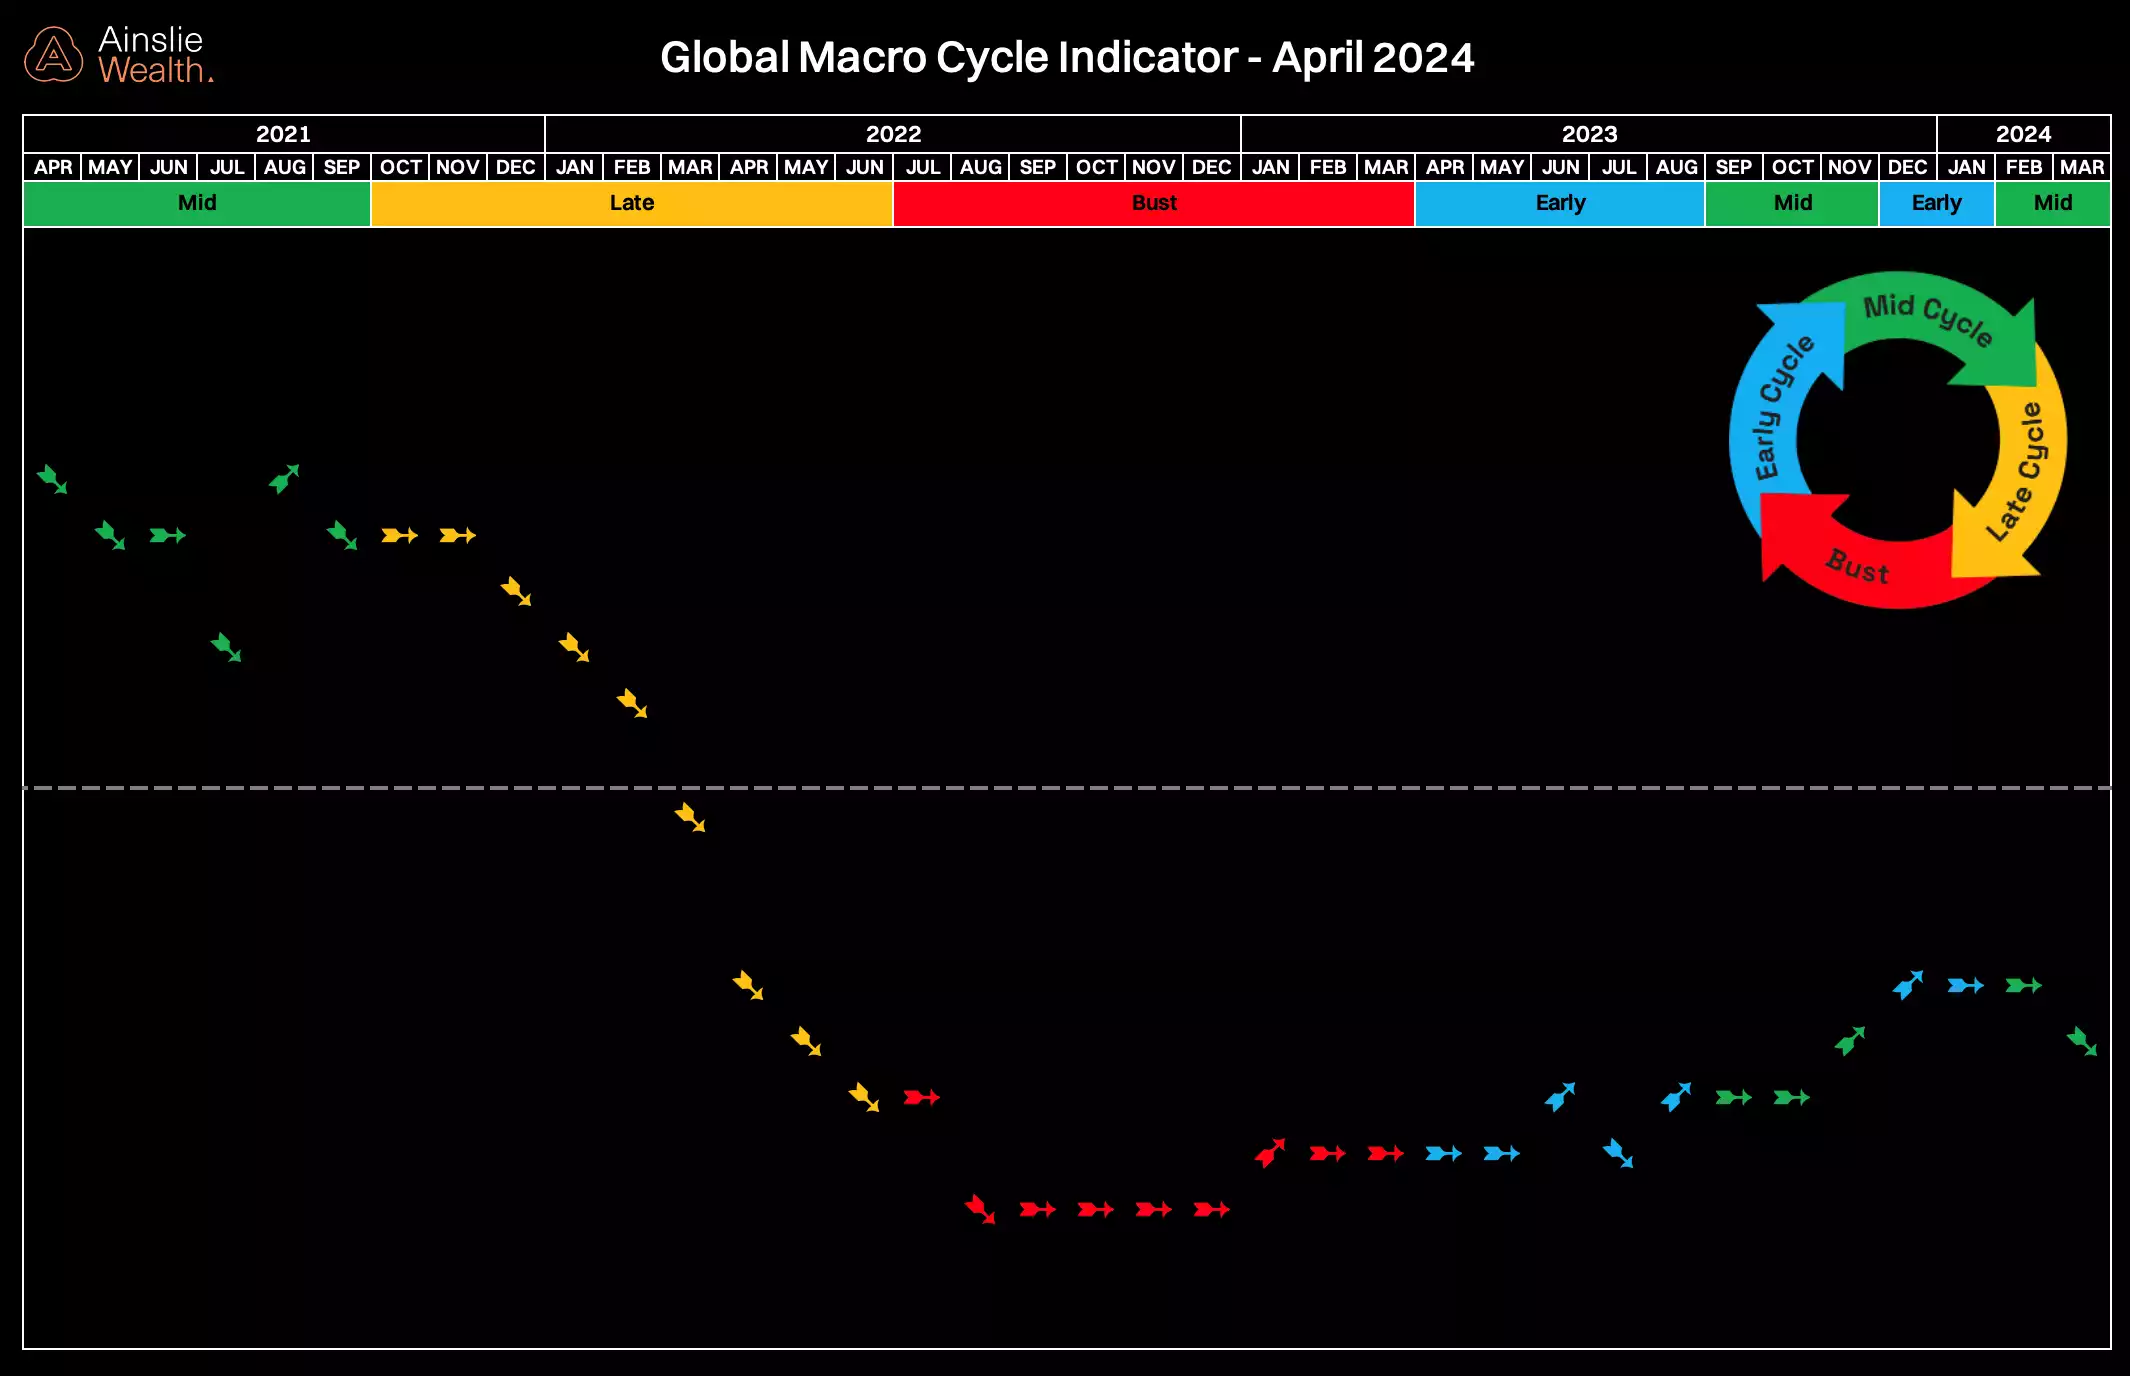
Where are we currently in the Global Macro Cycle?
A fall in global growth has turned our latest update to the monthly indicator down. While there are calls of stagflation (lower growth, higher inflation) from the macro investing crowd on socials, we believe this is a temporary blip for global growth and expect ‘Mid cycle’ to continue well into the year. The overall trend is still up.
U.S. economic growth, as measured by the ISM data, is a useful tool to forecast the trajectory of the economy moving forward. This month, and going forward, we have included the Services PMI to complement our existing Manufacturing data. While these two PMIs historically track closely, we believe it is important to monitor both for possible divergences in the future.

The slight contraction in both services and manufacturing aligns with the small downturn in our global macro cycles. Though PMIs are currently in a choppy period and the 3 month leading indicator has turned down back to neutral, we expect a return to expansion in Q3 as we approach the U.S. elections and financial conditions continue easing.

Historically, Bitcoin performs well when economic growth turns up. Despite current sideways price action, we maintain that crypto summer is a ‘buy the dip’ period.

Where are we currently in the Global Liquidity Cycle?
Global Liquidity leads the movement of World financial assets, so this is the indicator we look most closely at to determine where the opportunities are to take advantage of Bitcoin’s cycles.
Last month our analysis suggested Bitcoin would go through a choppy period due to deteriorating liquidity conditions. “We believe that liquidity and global markets will potentially be range bound through April and May due to seasonality”. It appears we have now passed the air pocket of seasonality and tax season, ready to start heading higher.

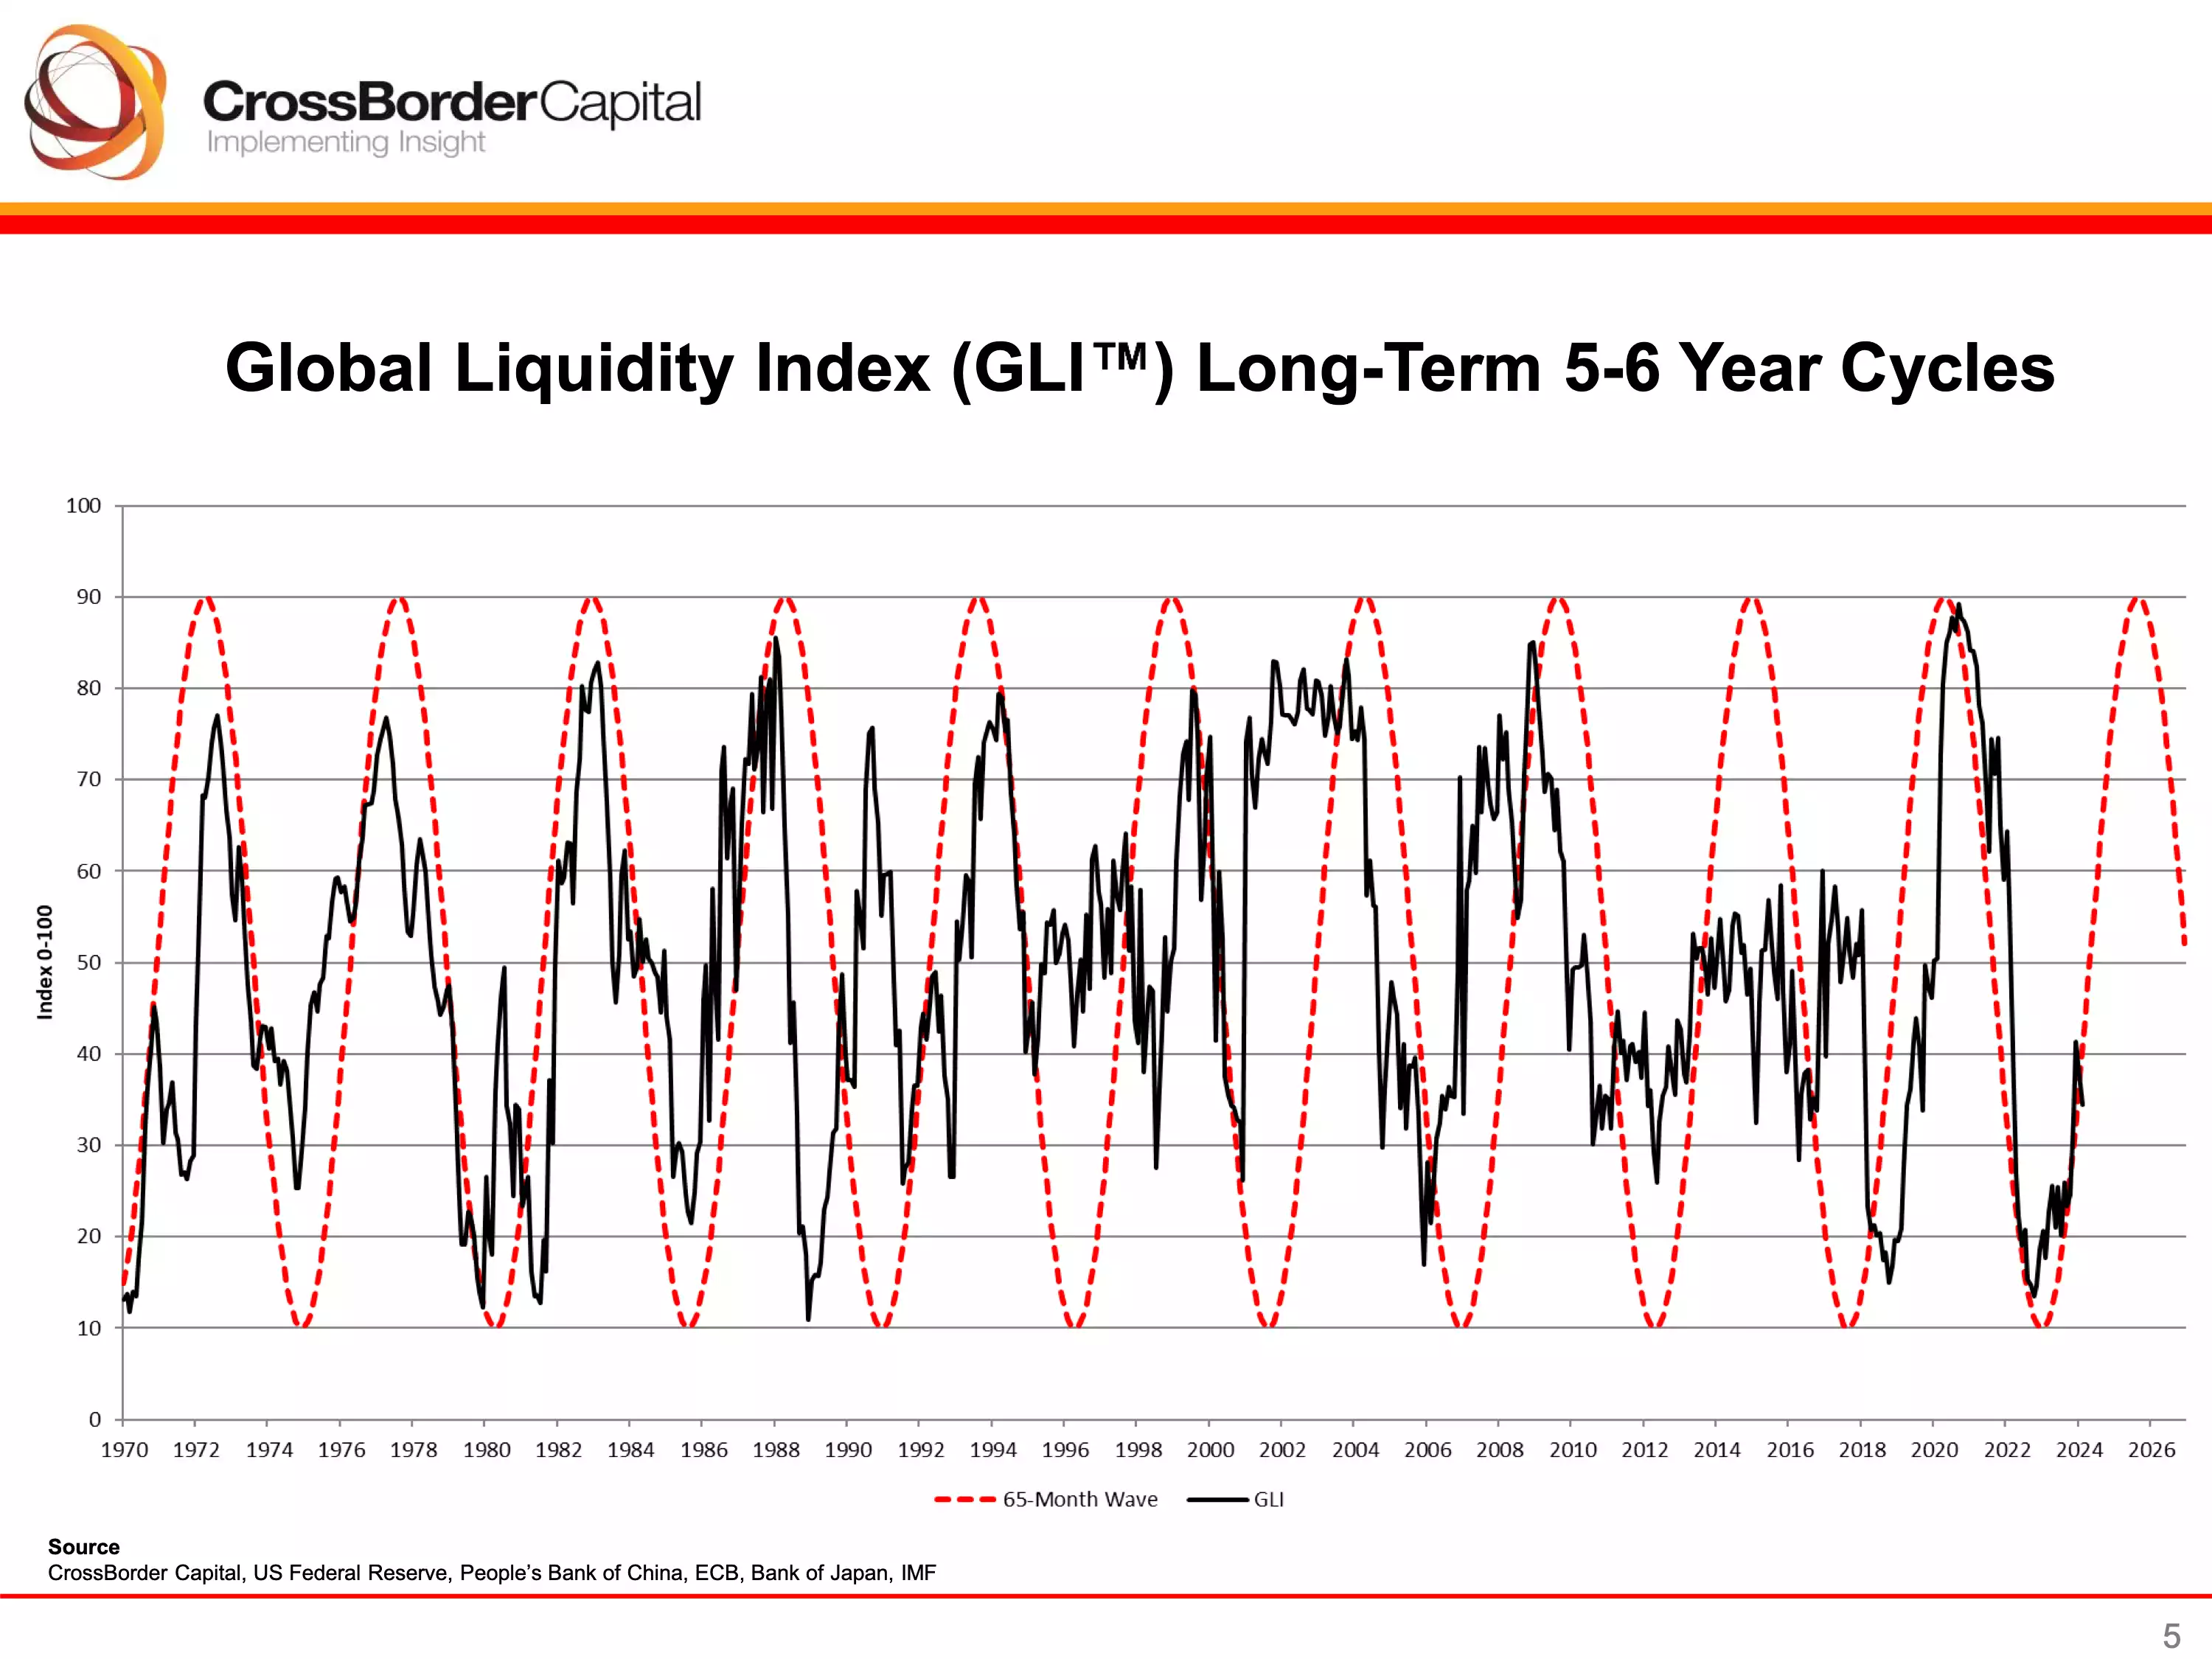
The Global Liquidity Index has been turning down over the past 2 months for reasons mentioned above. However, due to the global sovereign debt situation which follows the sine wave on the chart, we expect monetary conditions to ease significantly into the second half of the year. This will boost liquidity higher on the index, creating an asset price boom.
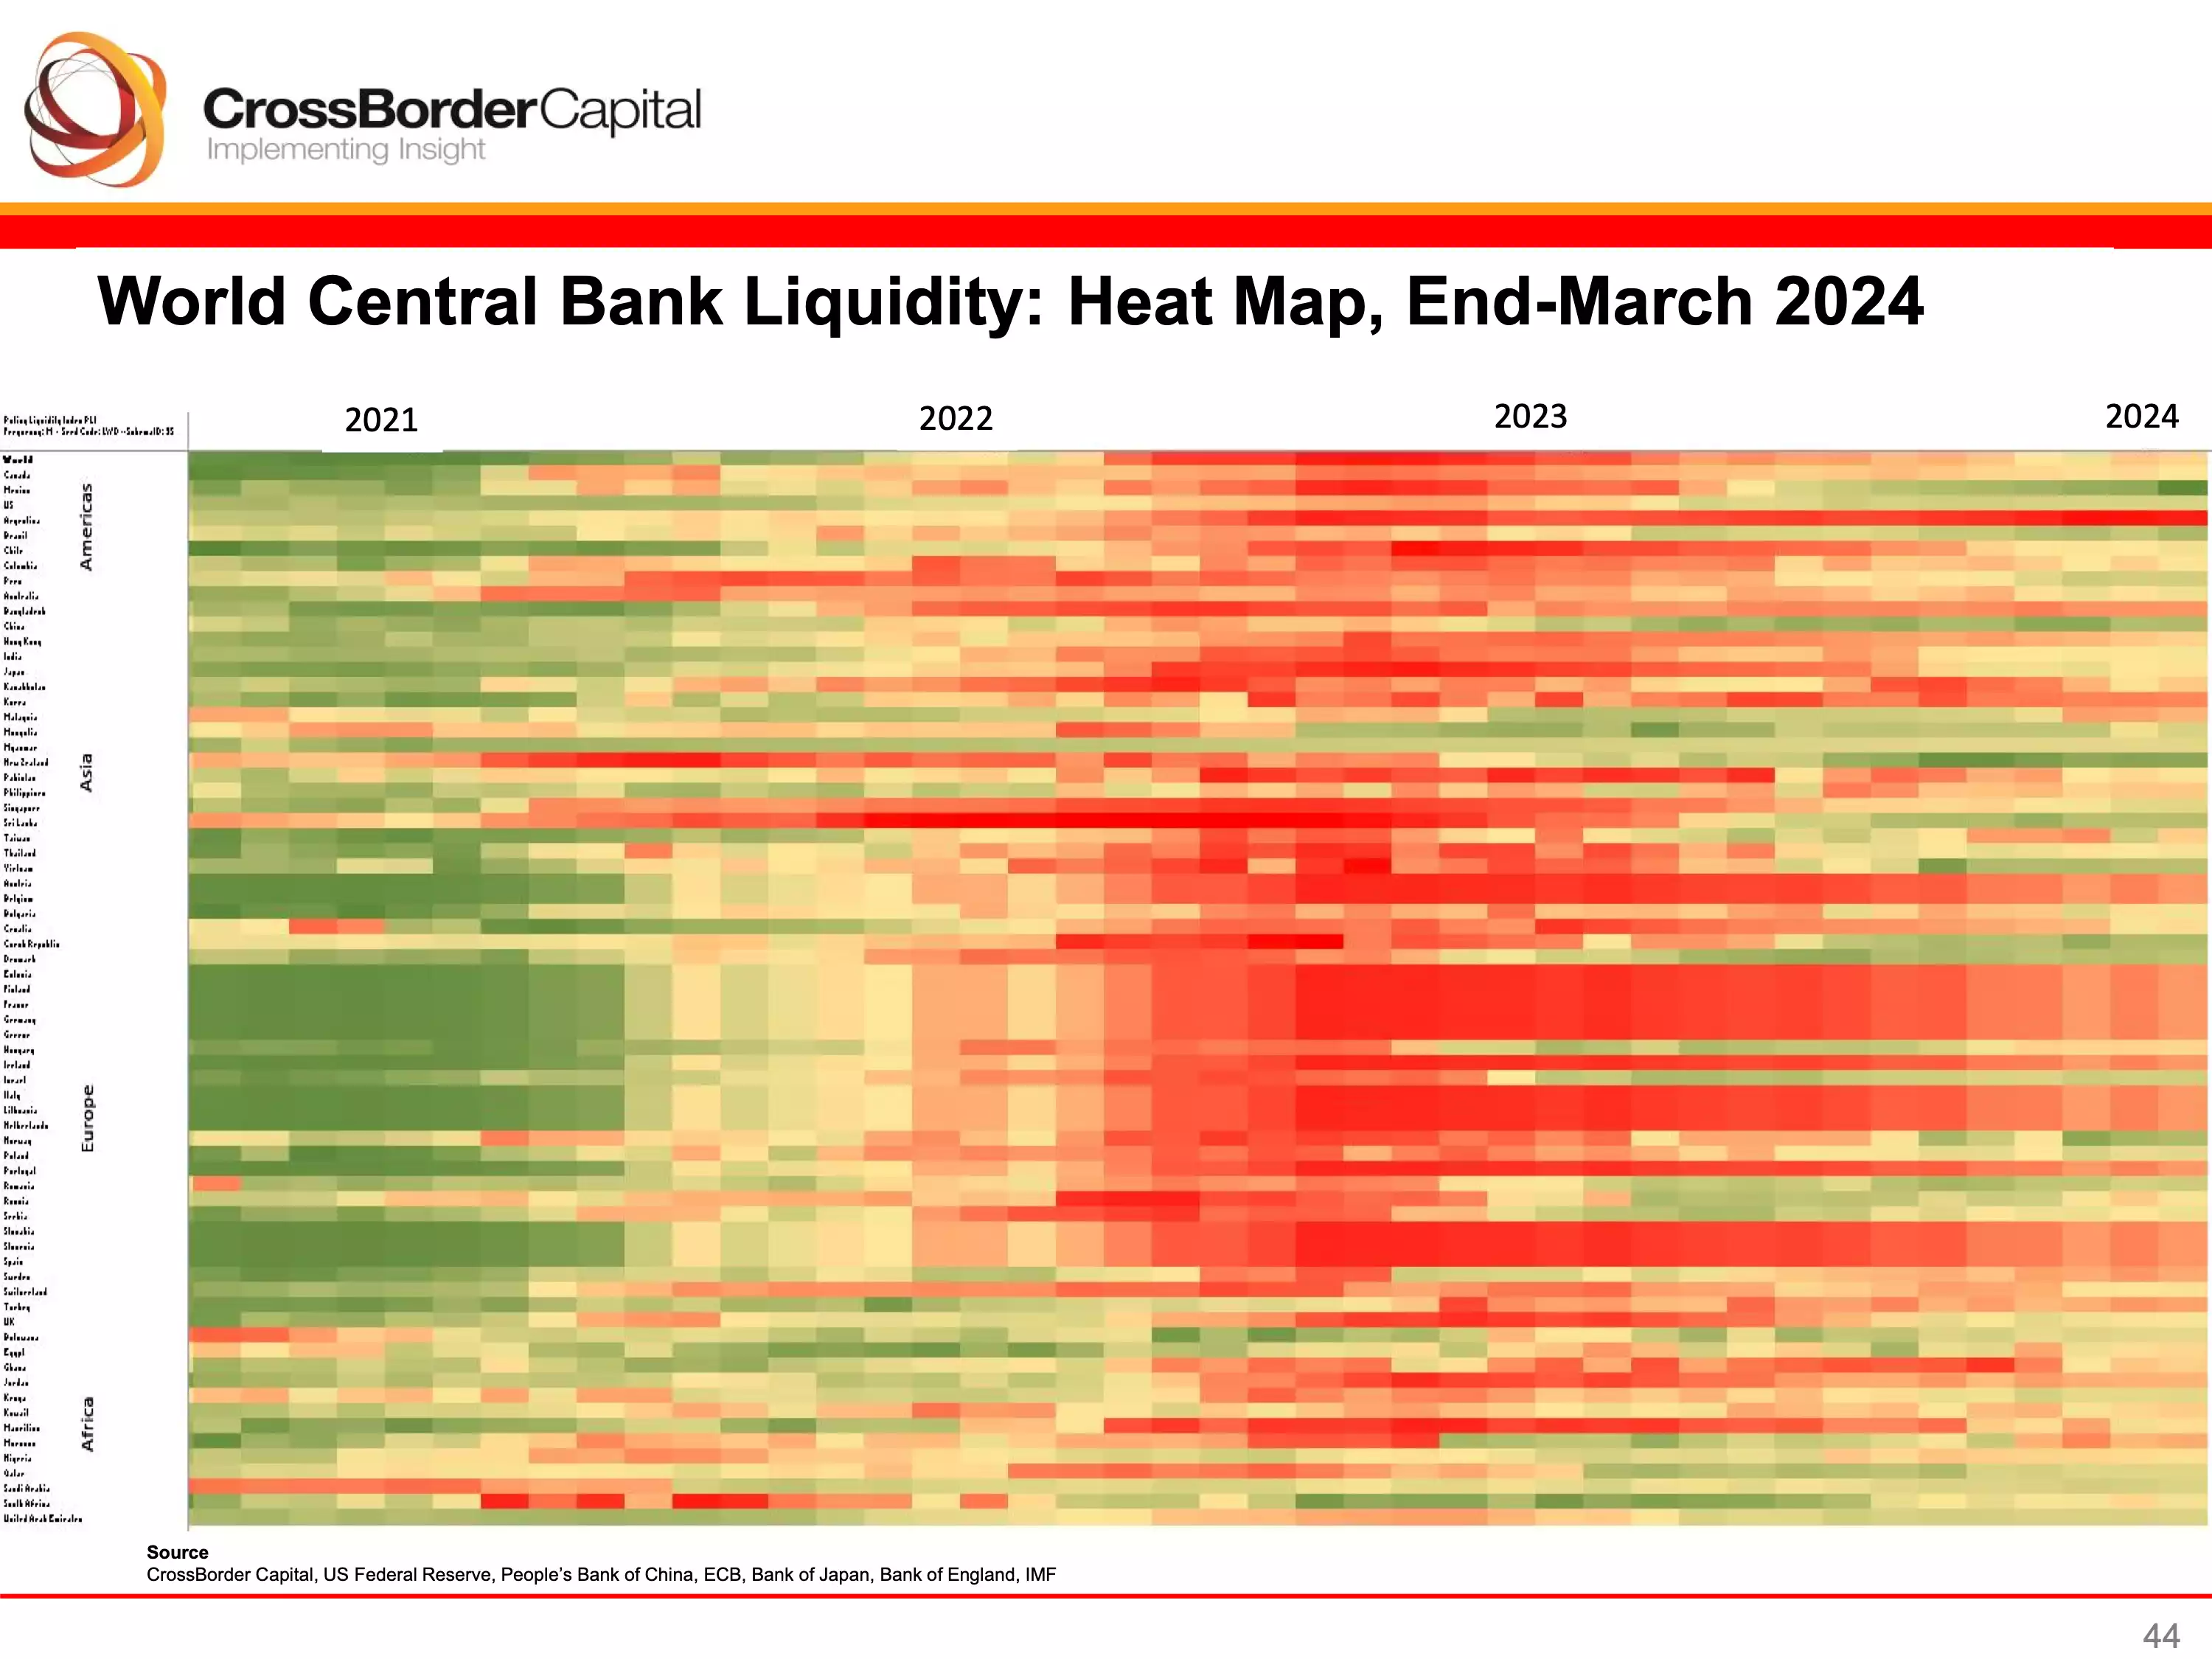
The Central Bank Liquidity Heat Map shows a breakdown of where global liquidity is being added and removed. Only a very slight change from last month but we do expect more easing (green) in H2 to help governments finance their abysmal fiscal situation.
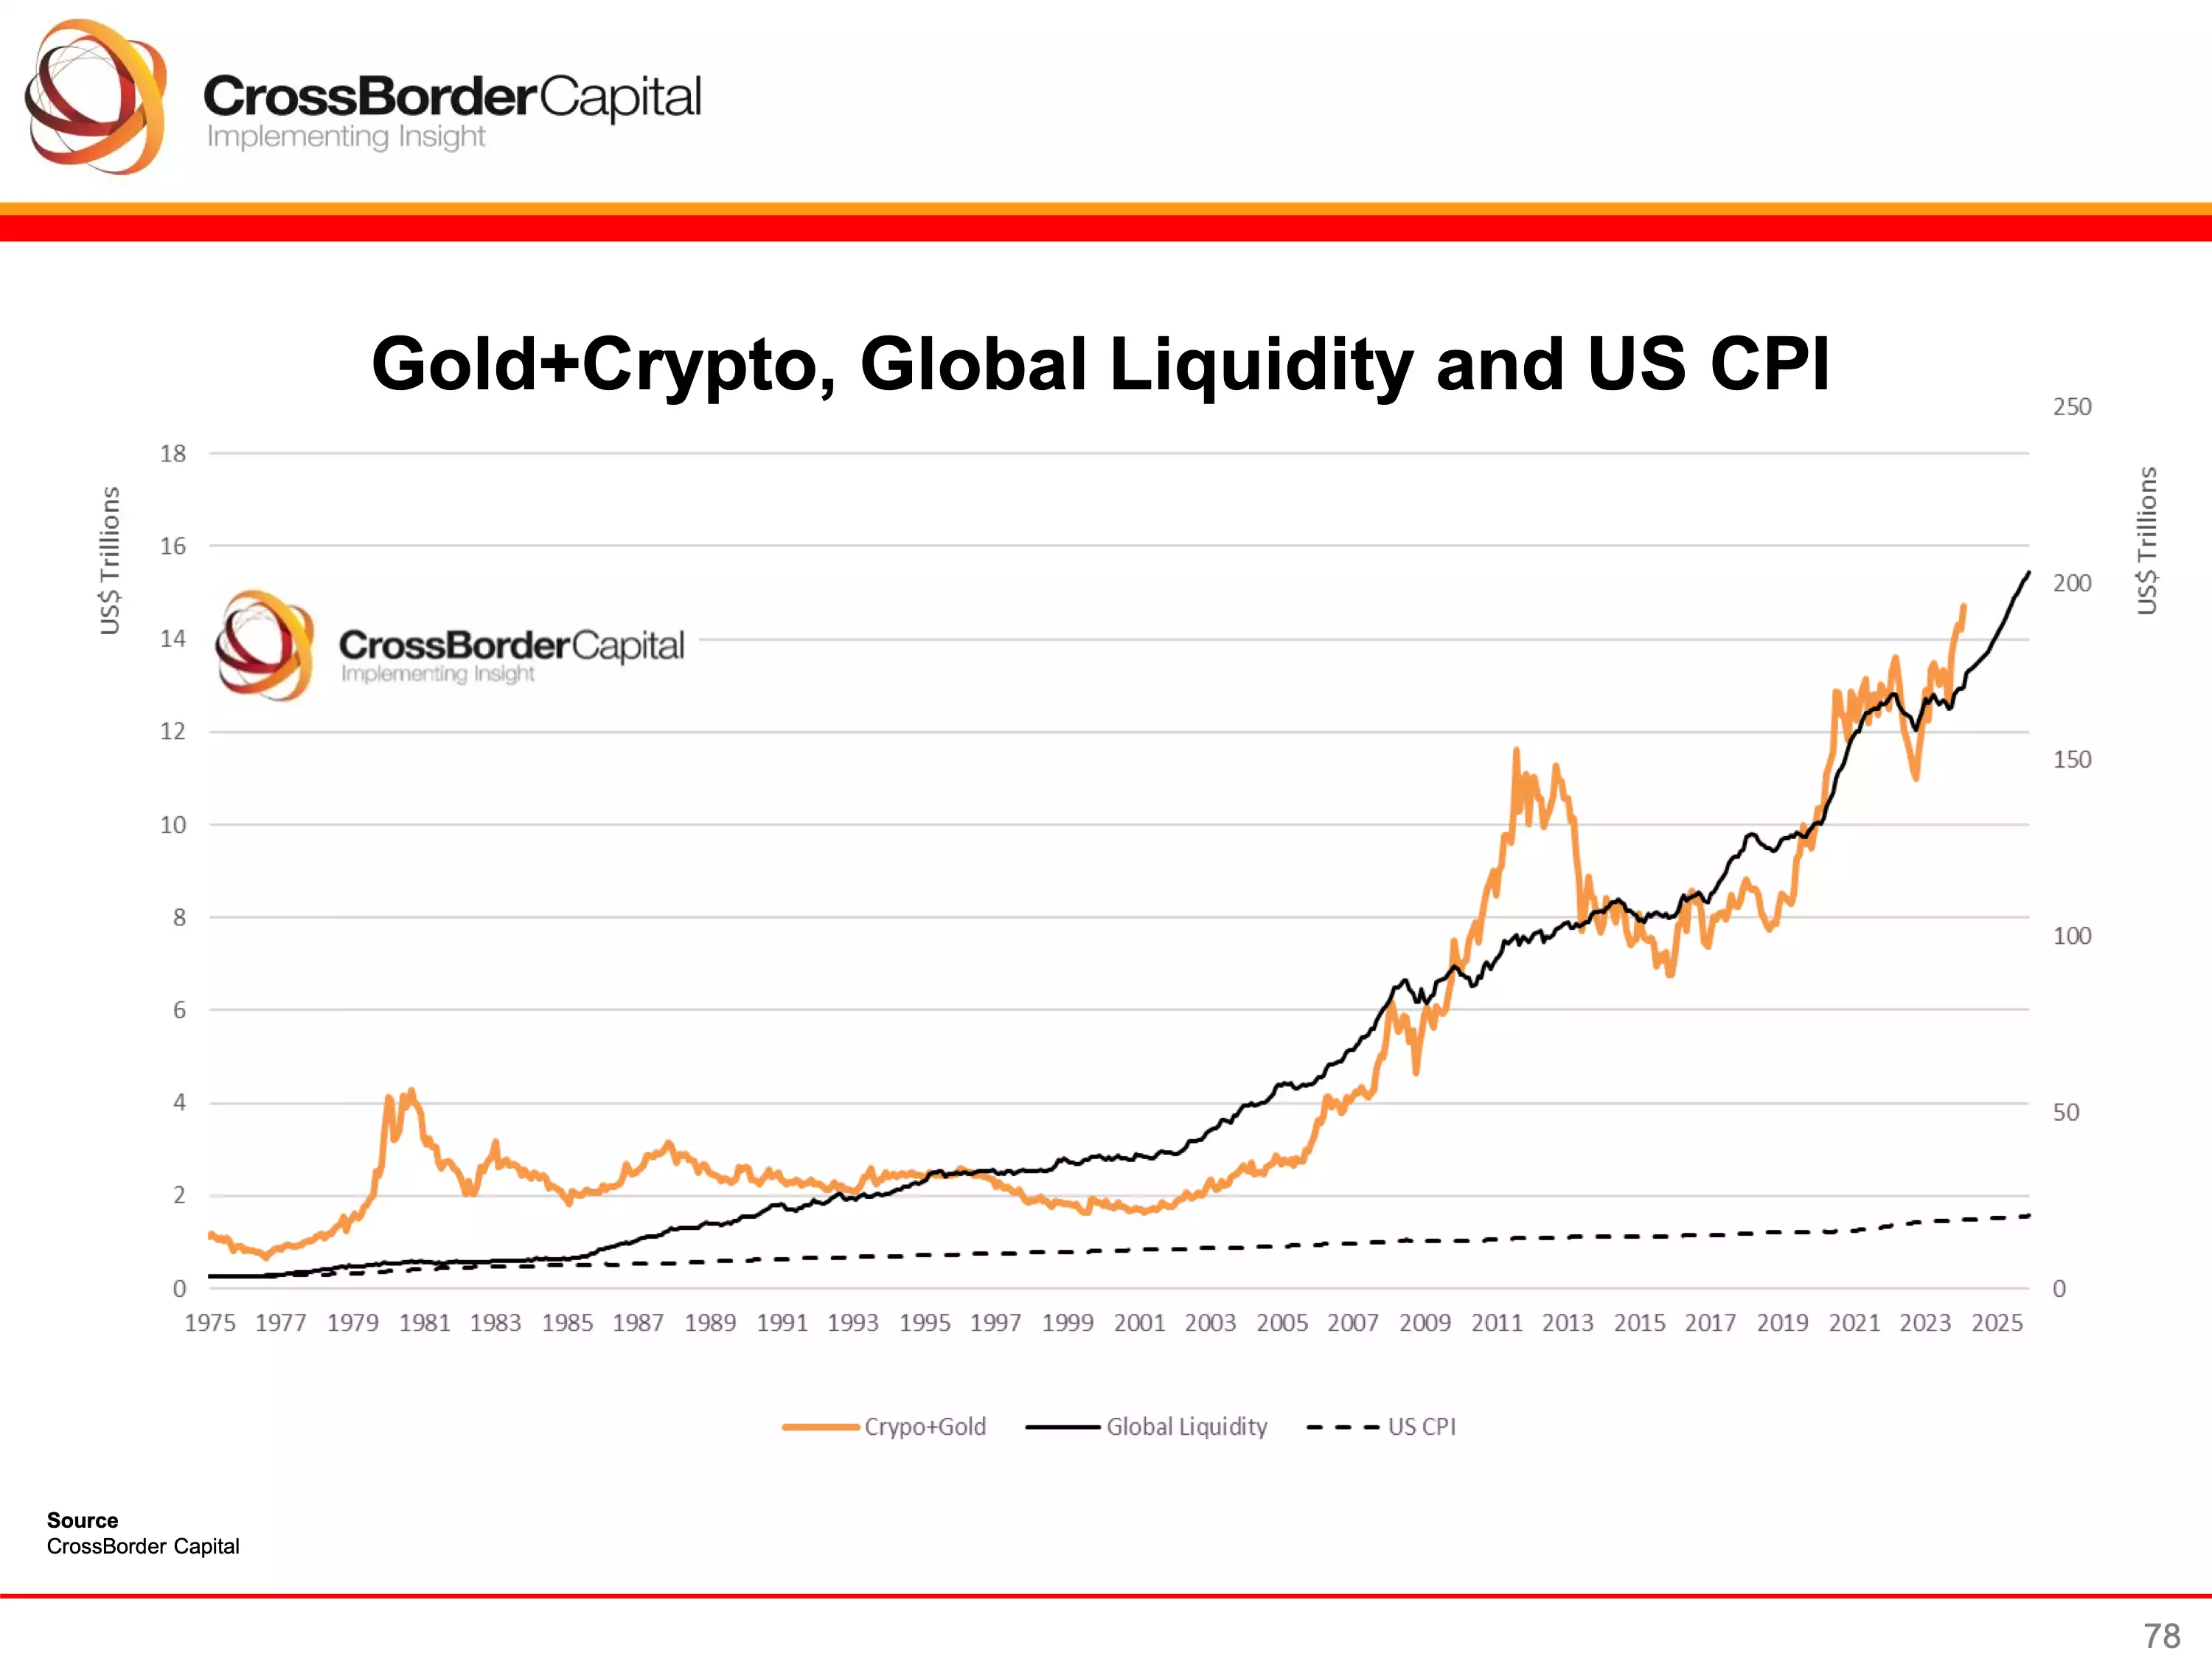
Global liquidity against Gold + Bitcoin shows the correlation between asset prices and liquidity. This chart also demonstrates the importance of owning hard assets to outperform CPI (dotted line) to maintain wealth and purchasing power over time.
The Bitcoin monthly average price overlayed with liquidity tops and bottoms shows how sensitive it is to liquidity. Current chop in the market has smoothed out the average price over the past month, however liquidity is starting to turn up, which is positive for Bitcoin.

The Bitcoin halving: down but certainly not out!
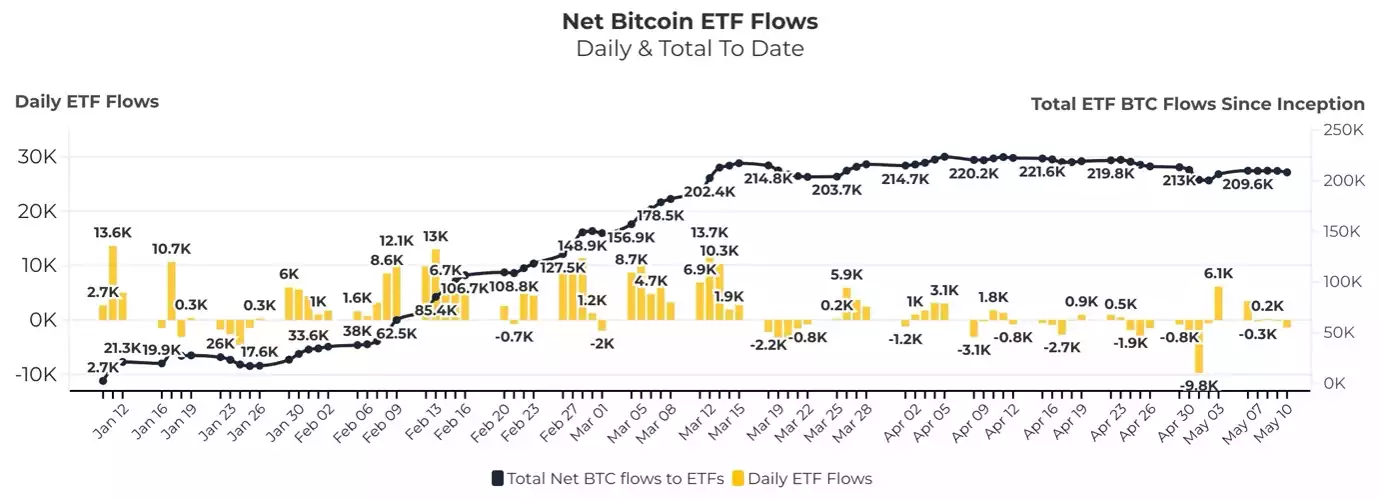
ETF volumes and inflows have slowed significantly since the March highs with some weeks even seeing net outflows. As a percentage of AUM these outflows are small, and it is expected that volume and inflows will pick up significantly once a new all-time high is confirmed.
Also of note, several large institutions have publicly announced via compulsory 13F filings their exposure to these ETFs, which include a number of banks and investment funds. Exposure ranges from only a couple of Bitcoin to 10s of millions of dollars invested.
It has not been uncommon for ‘market commentary’ to declare the end of the Bitcoin bull market after the recent pull back. Based on historic data, we are more than likely only half way through this cycle.

It is also not uncommon to go through a consolidation period directly after the halving. In time the bulls will likely be vindicated.

Conclusion
Armed with the knowledge of where we are in not only the Global Macro Cycle, but also the liquidity and therefore the Bitcoin cycle, it’s hard to not get excited about the potential short to mid-term price action of Bitcoin.
Knowing that institutional demand has started, it’s fair to say Bitcoin as an asset class is grossly underrepresented in the chart below. It was not that many years ago a market cap of $1 trillion for Bitcoin seemed like a pipe dream. If Bitcoin was to capture 1% of total global asset value, it would trade close to half a million U.S. Dollars.

Watch the full presentation with detailed explanations and discussion on our YouTube Channel here: https://www.youtube.com/watch?v=PU44NLdXUSo
Until we return with more analysis next month, keep stacking those sats!
Joseph Brombal
Research and Analysis Manager
The Ainslie Group