Bitcoin Analysis: Beyond the Block – September 2024
September 12, 2024
News
Today the Ainslie Research team brings you the latest monthly update on Bitcoin – including the Macro fundamentals, market and on-chain technical metrics and all of the other factors currently driving its adoption and price. This summary highlights some of the key charts that were discussed and analysed by our expert panel. We encourage you to watch the video of the presentation in full for the detailed explanations.
Bitcoin and Global Liquidity
Bitcoin is the most directly correlated asset to Global Liquidity. Trading Bitcoin can be thought of as trading the Global Liquidity Cycle, but with an adoption curve that leads to significantly higher highs and lows each cycle. As such we look to buy Bitcoin during the ‘Bust’ phase or liquidity low, then rotate out of it during the ‘Late Cycle’ where liquidity is over-extended and downside protection is required (our preference is to rotate into Gold). When correctly timing and structuring the rotation, it is possible to significantly outperform ongoing monetary debasement. The Bitcoin cycle low was in November 2022, and since then the returns have been unmatched by any other major asset.
Where are we currently in the Global Macro Cycle?
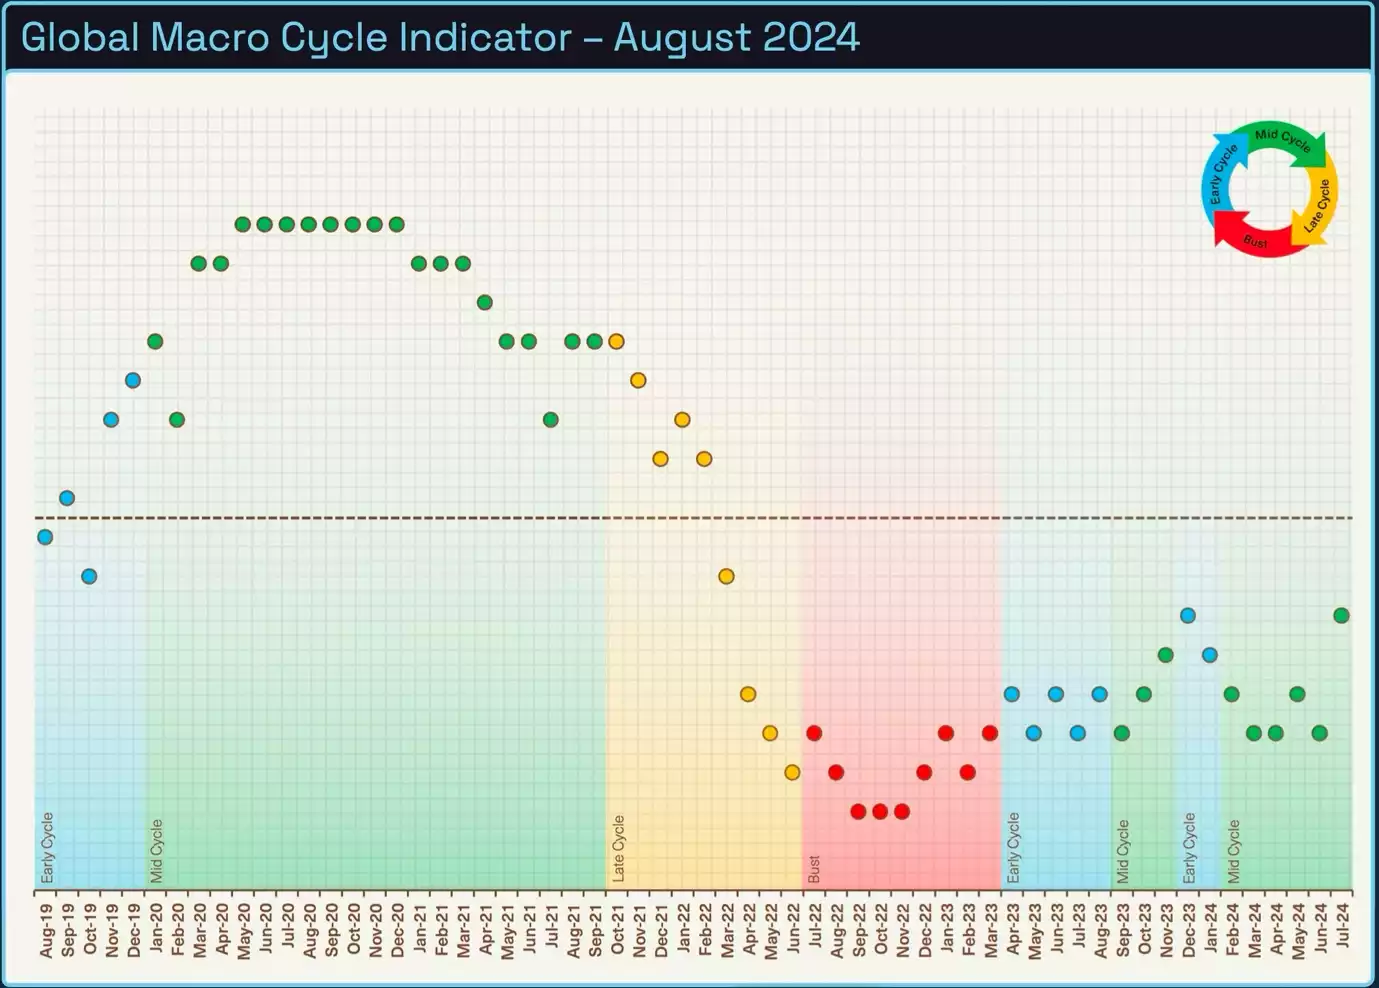
We have yet to receive the updated data for our Global Macro Indicator this month, though we suspect the macro cycle will remain in ‘Mid-cycle’ from a seasonality point of view. Some of our other indicators around liquidity are still awaiting data but we’ll dive into what indicators have changed and why we still believe we’re in ‘Mid cycle’.
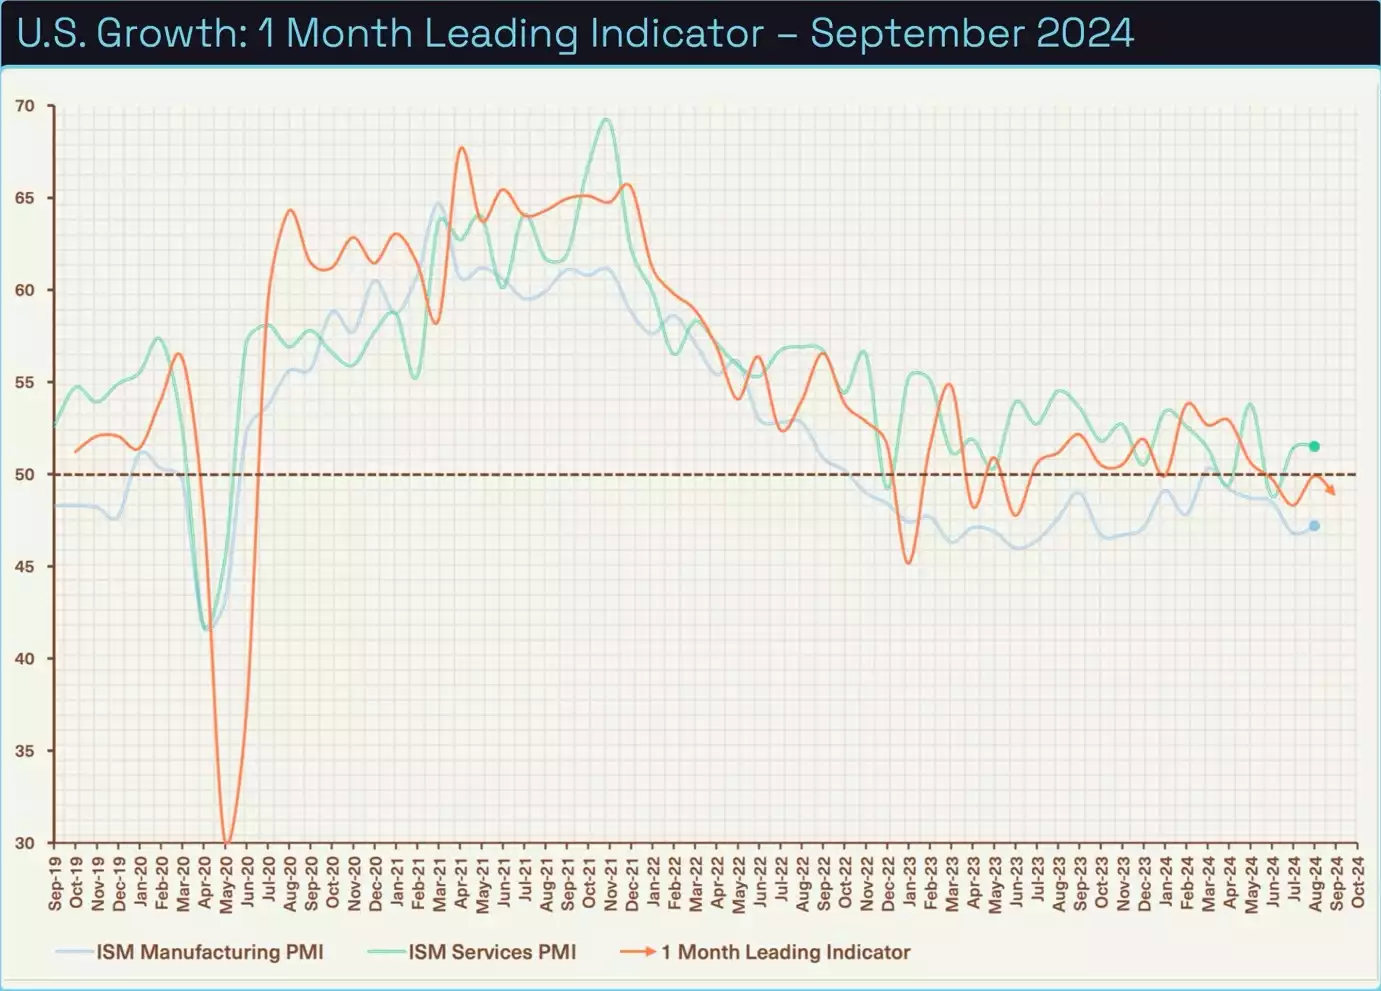
U.S. economic growth, as measured by the ISM data, is a useful tool to forecast the trajectory of the economy moving forward. Both manufacturing and services have ticked up for this month, with Manufacturing still in a slight contraction and Services in expansion. Our lead indicator has fallen into contraction due to a drop in new orders.
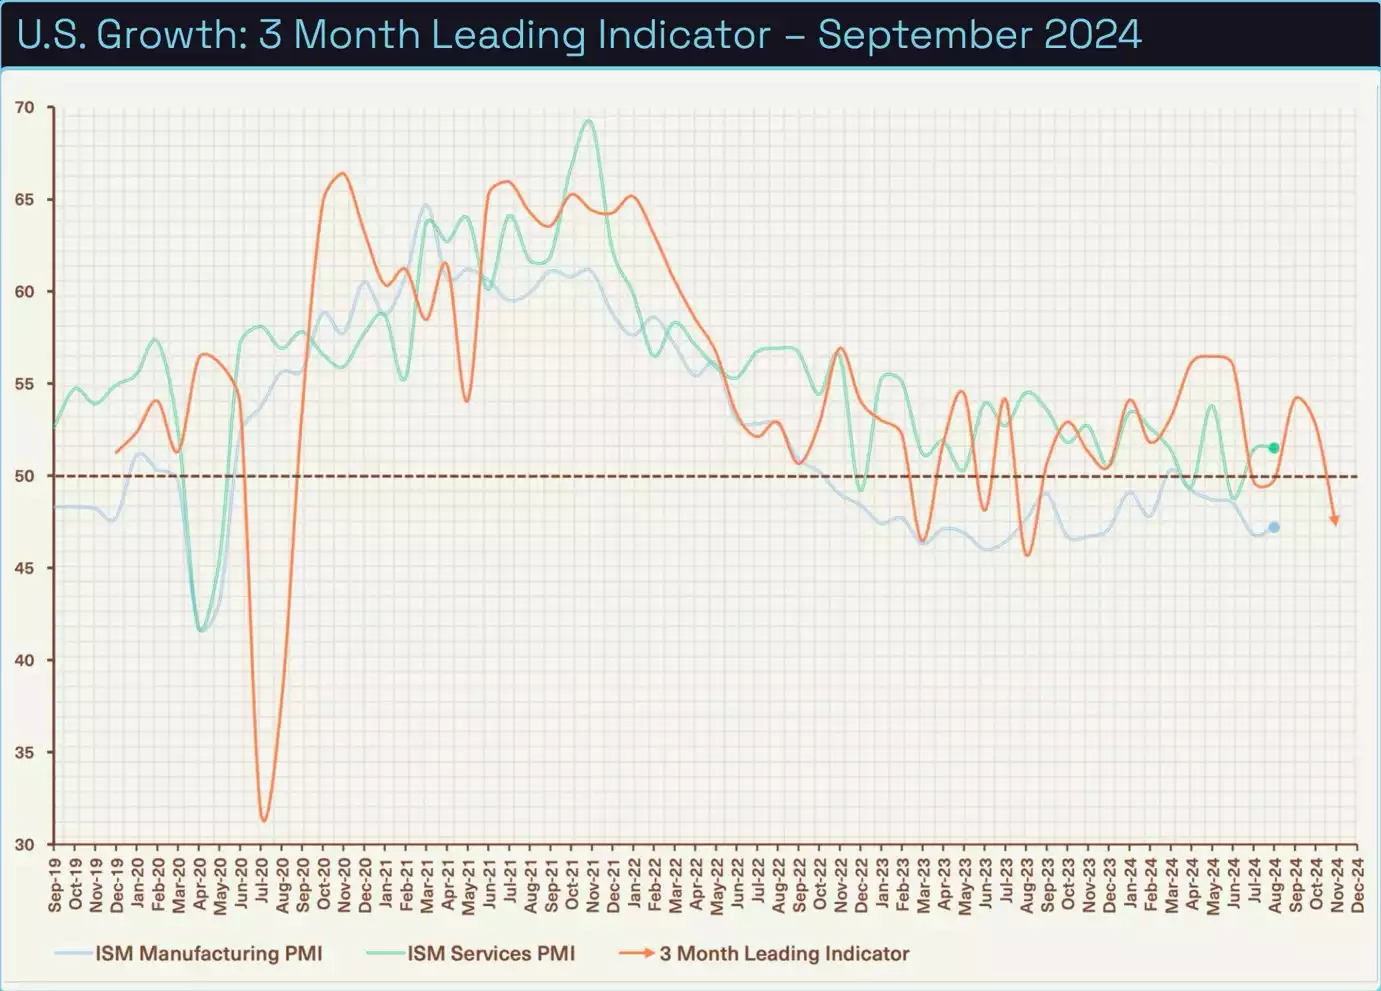
The 3-month indicator, which incorporates new orders less inventories has dropped significantly back into contraction from a rise in inventories. We are not too concerned since this indicator can be volatile through choppy periods such as the one we are currently in. Also keep in mind, that a sluggish economy provides cover for the Federal Reserve and the U.S. Government to provide stimulus to the economy.
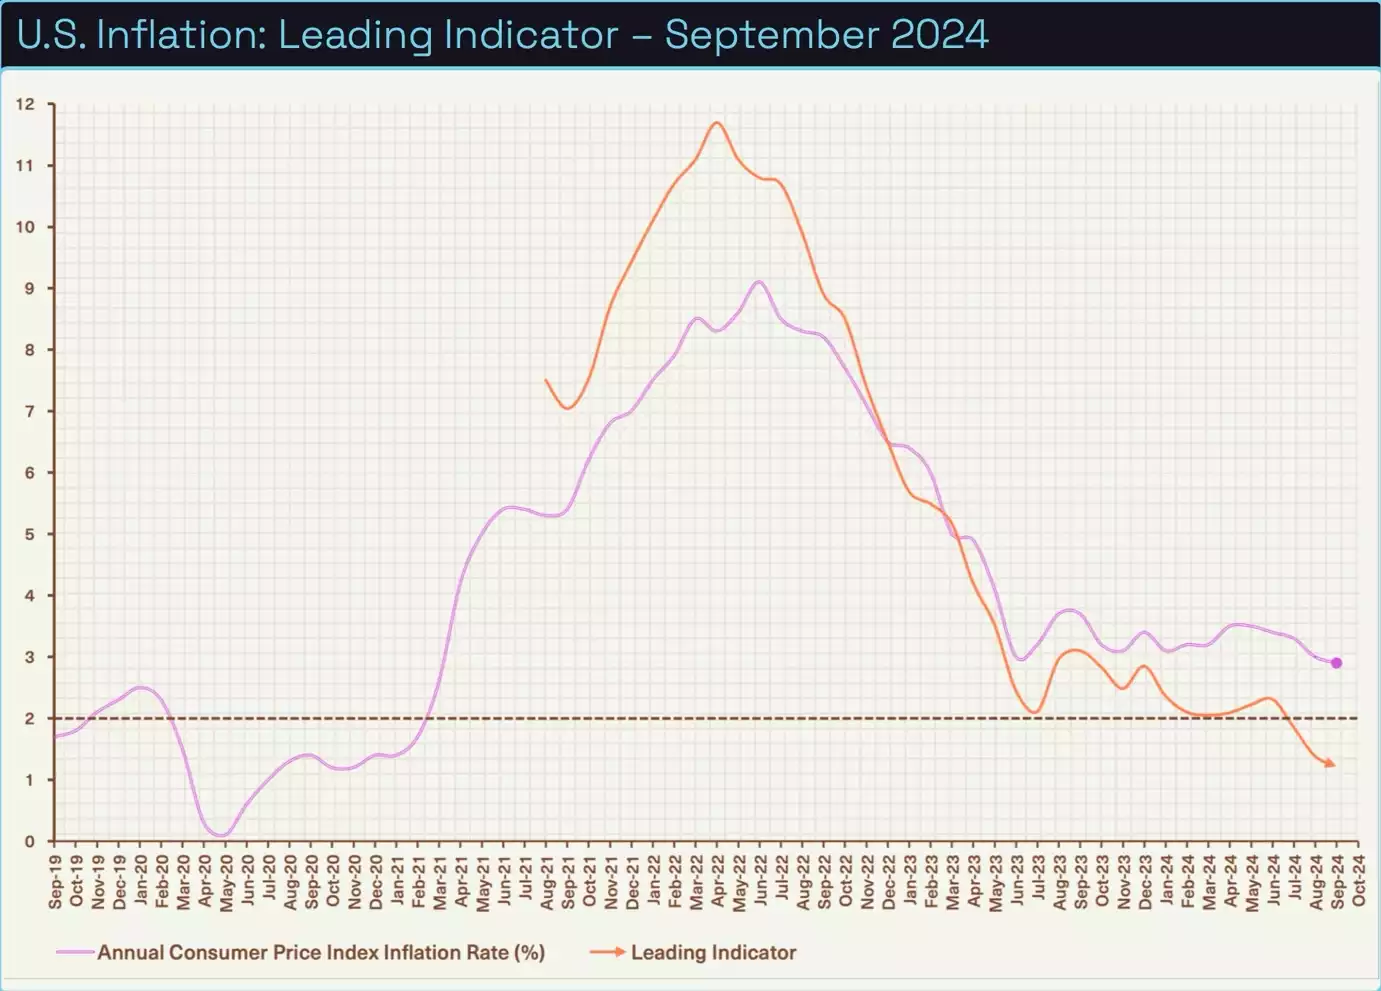
Our inflation lead indicator has reached a new low for the cycle at 1.1% while official figures are sitting at 2.9%. We would argue the Federal Reserve has met its first mandate of price stability and will now focus more on employment and the job market. Unemployment is hovering around 4.2% and has paved the way for a certain rate cut next week. The market is pricing in a 65% chance of a 25-point cut, and a 35% chance of a 50-point cut which will help to ease financial conditions and boost the U.S. economy.
Where are we currently in the Global Liquidity Cycle?
Global Liquidity leads the movement of World financial assets, so this is the indicator we look most closely at to determine where the opportunities are to take advantage of Bitcoin’s cycles.
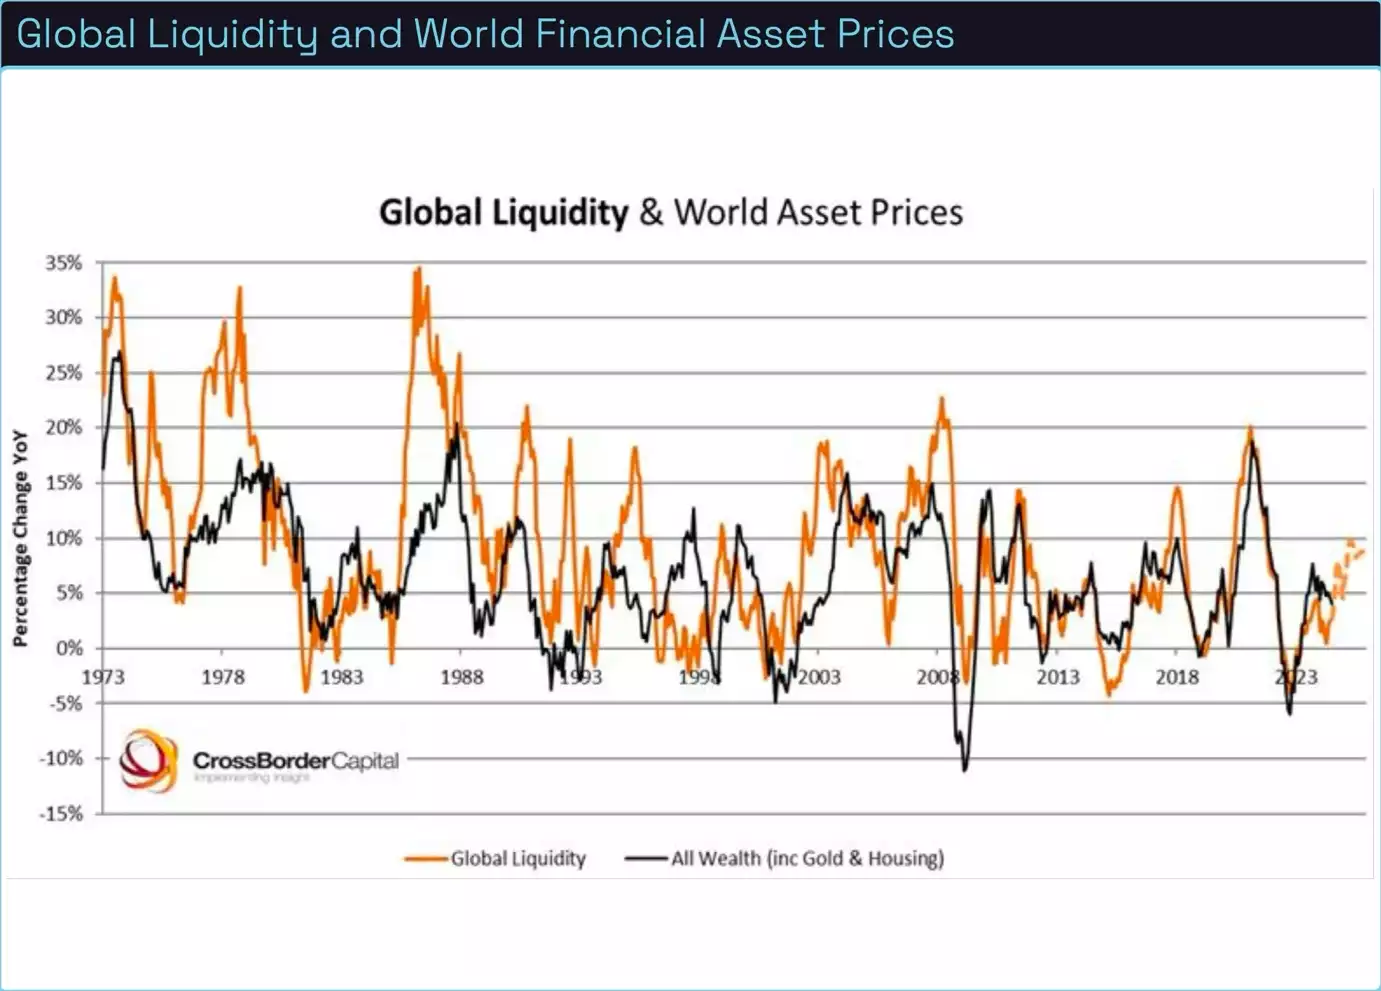
Below is a chart of the correlation between liquidity and world financial asset prices. As the world becomes more indebted and financialised, asset prices and the economy become increasingly correlated to liquidity cycles. If we can predict the direction of liquidity, we can predict the direction of asset prices and coincidently the strength of the economy.
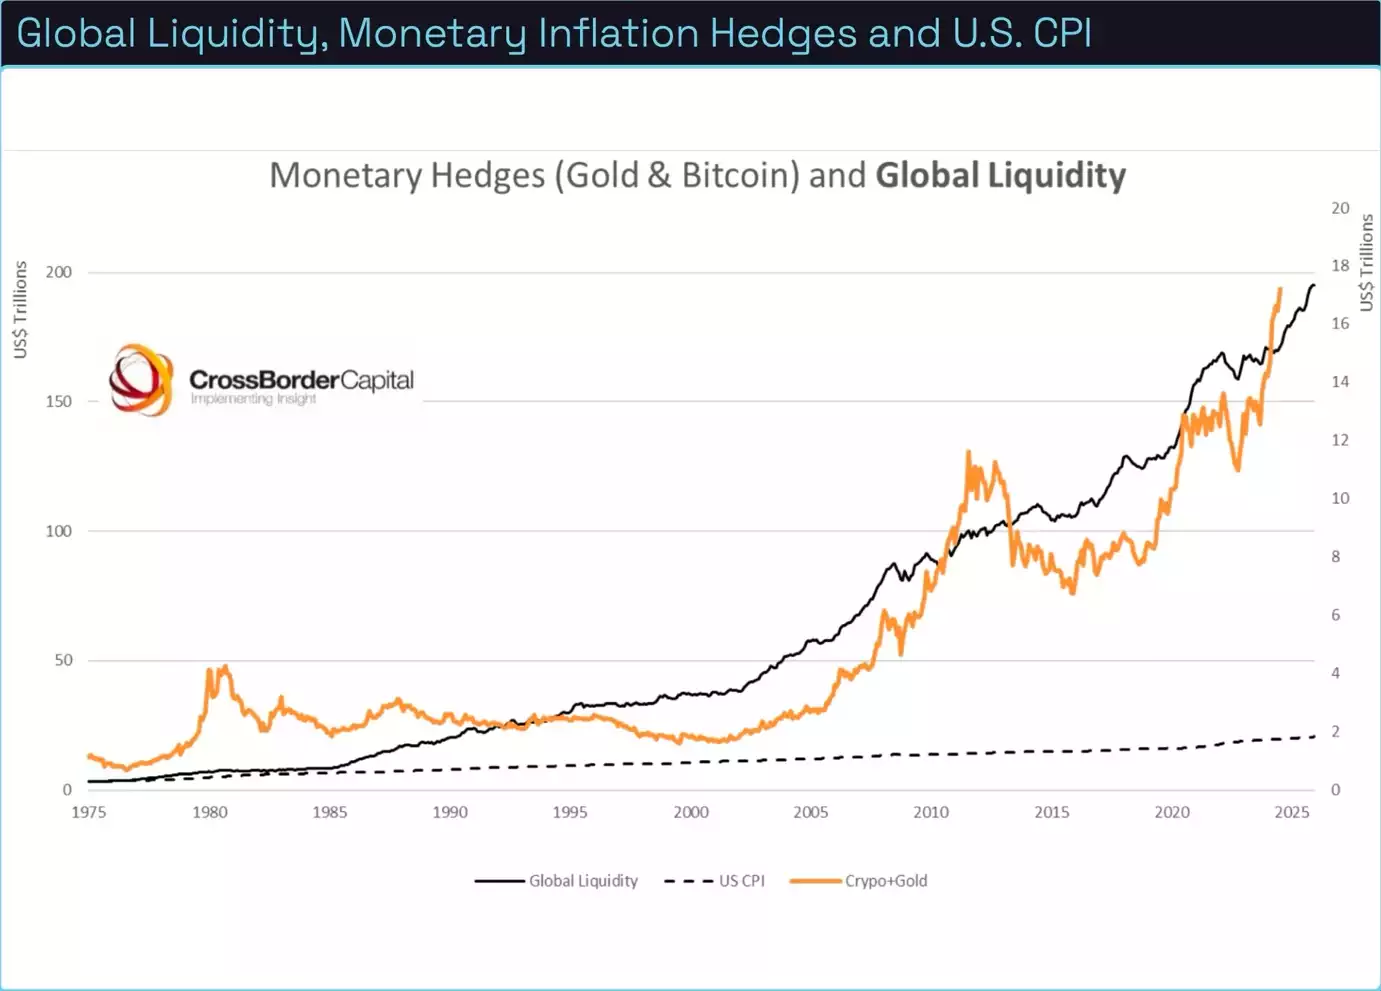
This month we will remind the reader why it is important not to focus on CPI as a metric for preserving purchasing power. Though the dotted line which represents U.S. CPI has begun ticking up in recent years, the value of hard assets such as Gold and Bitcoin have kept pace with liquidity and monetary inflation, far exceeding the inflation rate of the Consumer Price Index. Whilst volatile, BTC has been the number one asset to own to preserve wealth.
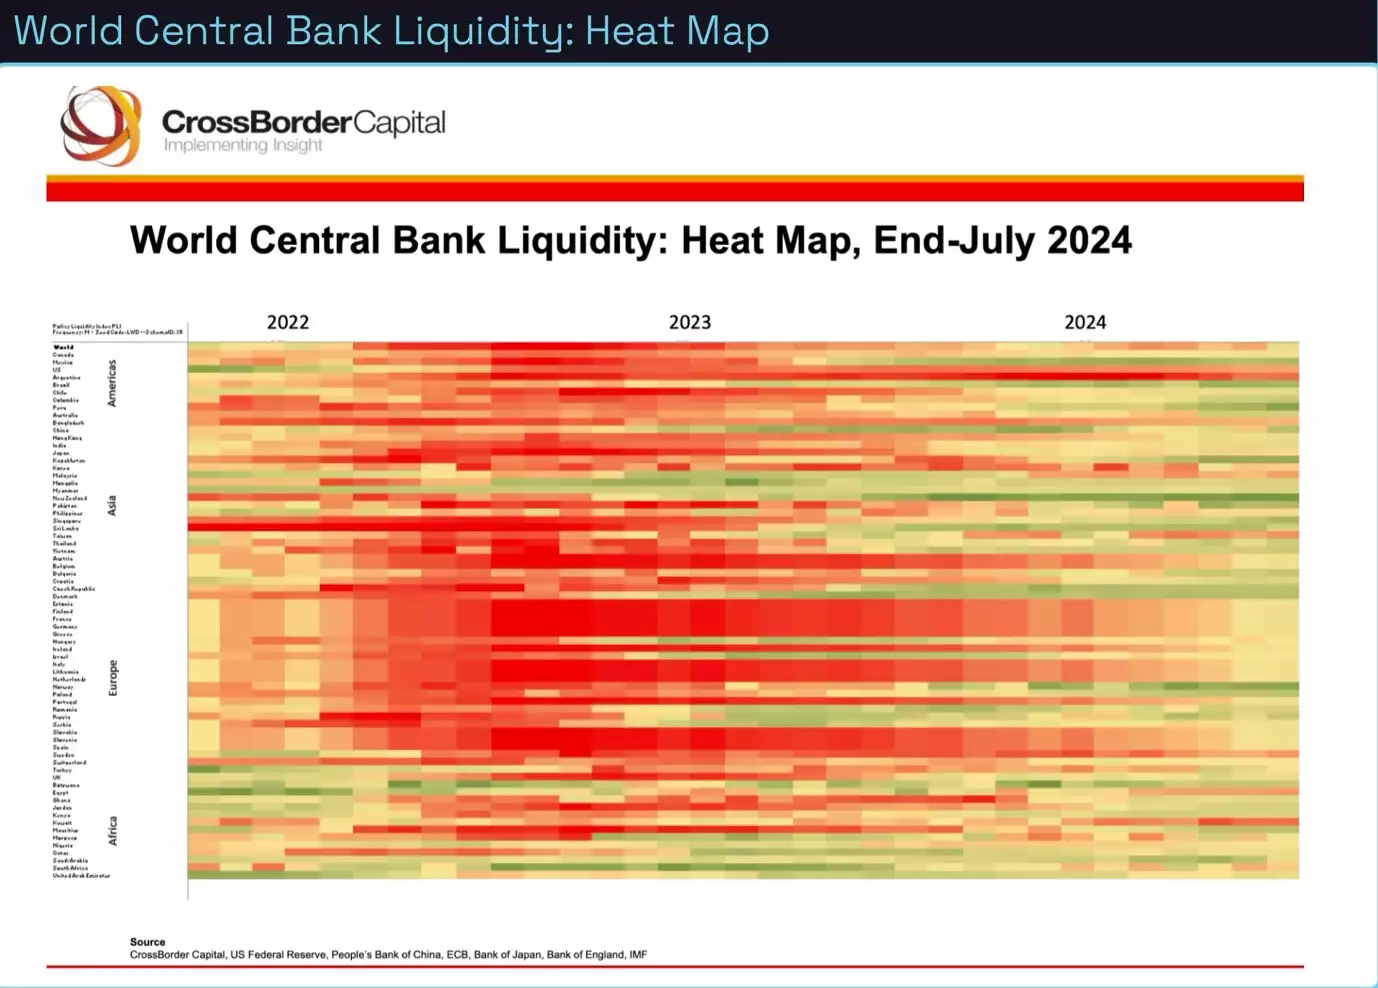
The World Central Bank Liquidity heat map continues to see green with most of the major central banks moving towards easing. As discussed, the Federal Reserve has all but cut rates before next week’s meetings, and it is expected the European Central Bank will cut rates at their next meeting. Other major economies such as Canada and England are set to continue loosening monetary policy from their respective Central Banks.
As pointed out at the start of the report, we have yet to receive our weekly data for Global Liquidity. When we receive the data, it is expected that liquidity will be flat due to seasonal factors such as corporate tax season in the U.S., which drains money from the banking system and into the Treasury General Account. However, this liquidity drain may be offset by rising collateral values. More on BTC’s seasonality later in the report.
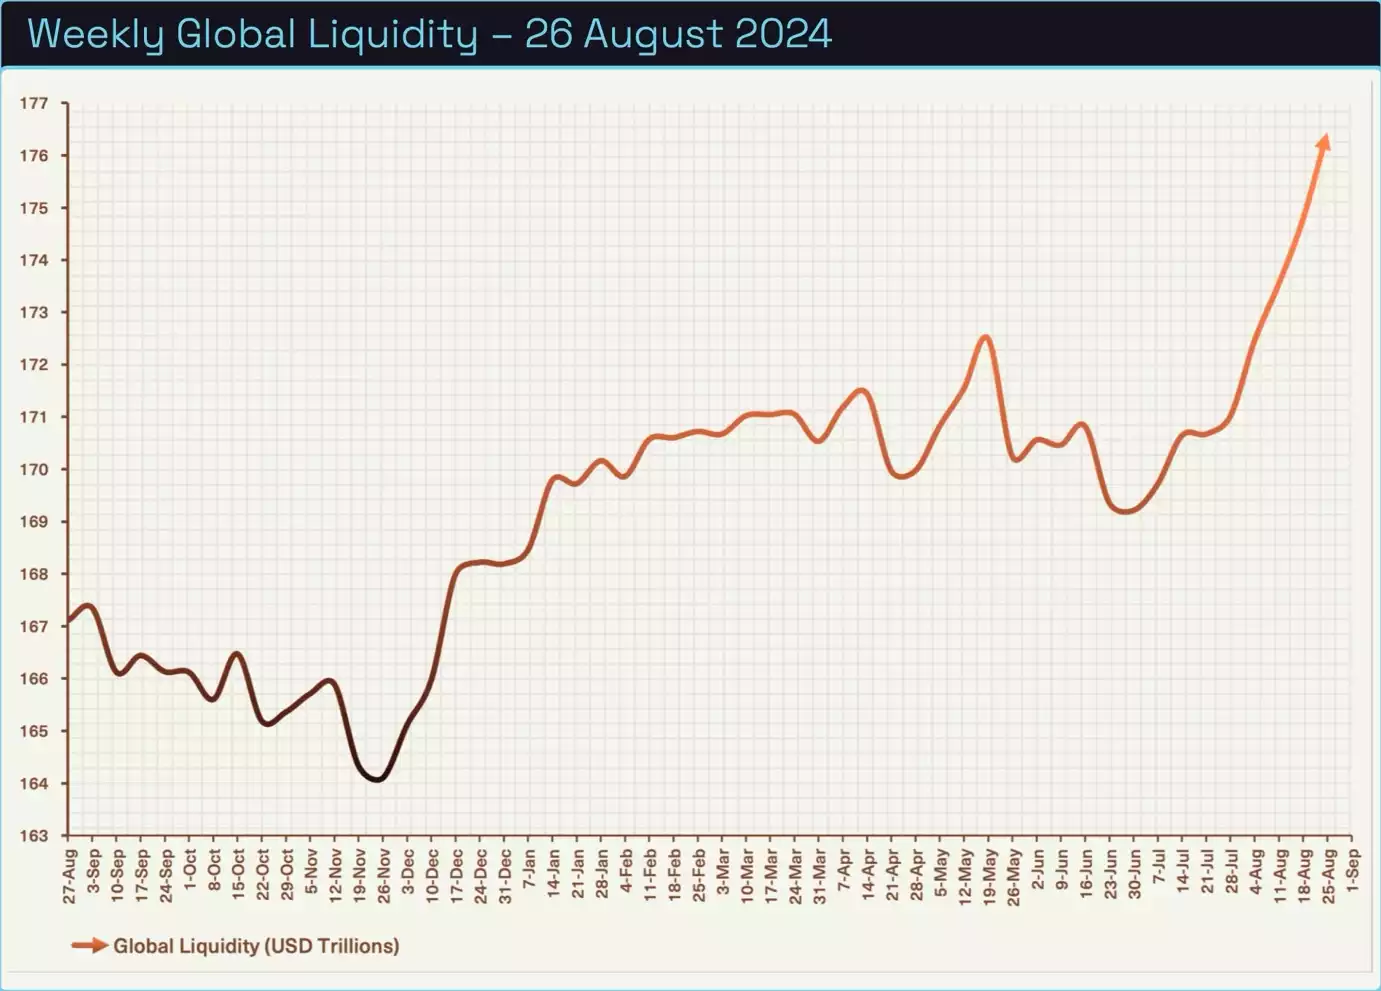
Knowing this, BTC’s stagnant price action has not been a surprise over the past month, though we continue to believe that Q4 of this year is going to be a very positive season for BTC as seasonal factors turn positive. BTC catching up to liquidity will likely happen at quite a rapid pace, catching investors off guard. As the saying goes, “time in the market beats timing the market”.

Seasonality and record ETF outflows.
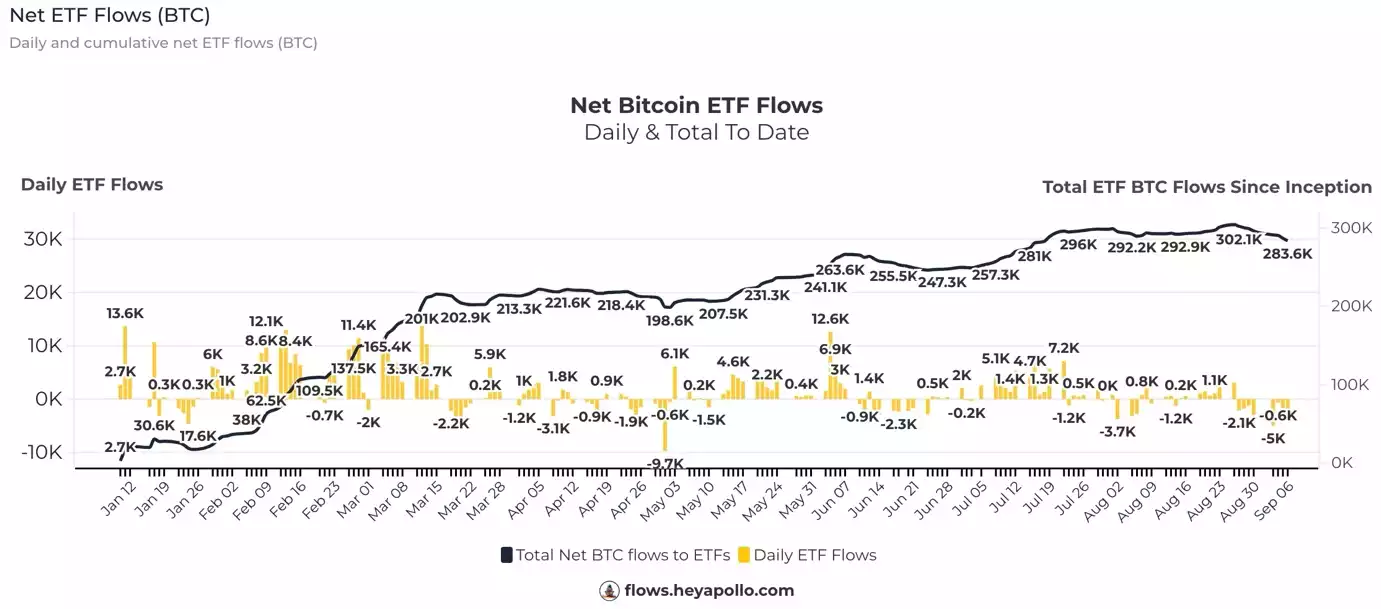
The last month has seen a record 8 days of outflows since inception of the BTC ETFs. While these outflows may seem like a large number, they are just a 6.7% drop from the peak of net inflows. While a 2.28% drop in total BTC holdings includes GBTC’s legacy holdings.
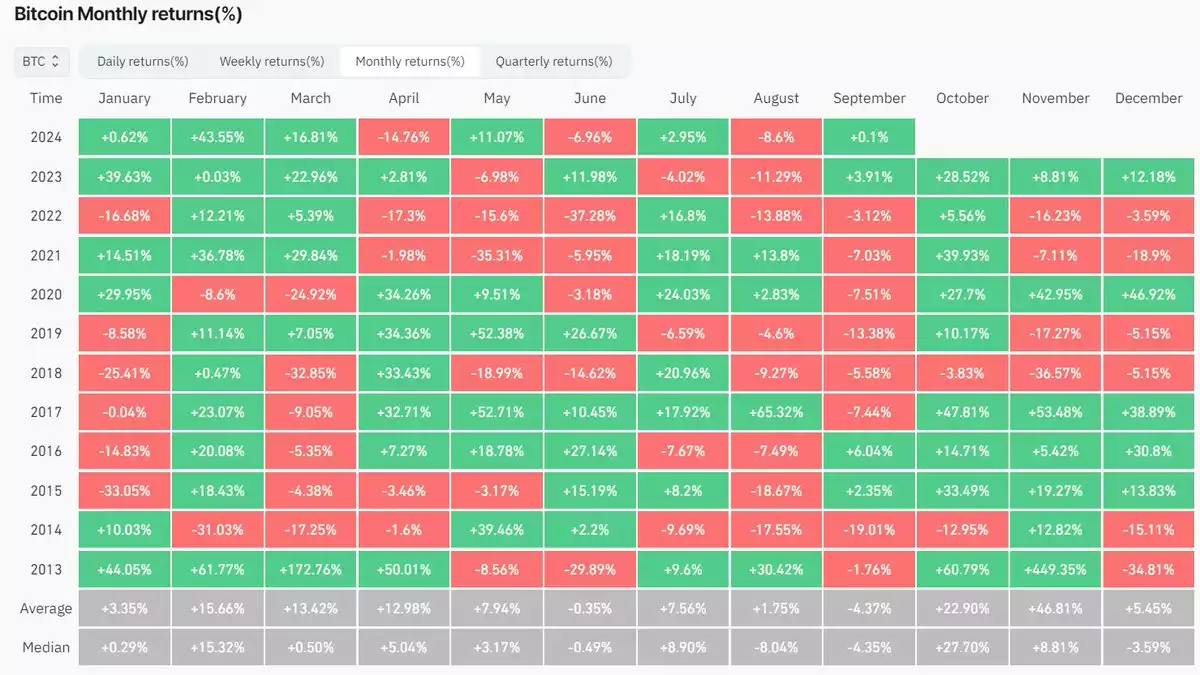
August and September are typically the worst months for price action. However, approximately 45% of BTC’s full-year performance comes from just the 4th quarter alone.
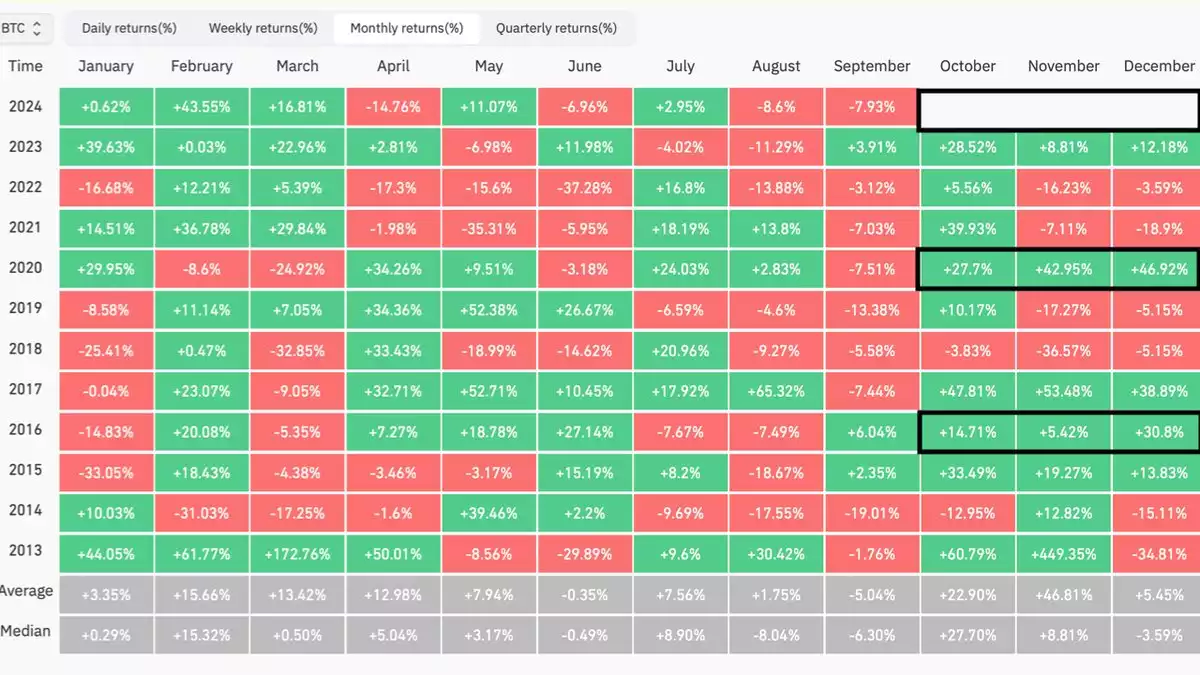
Combine the statistics of the previous chart with the fact we are now in a halving year, where we haven’t seen a red month in Q4 yet!
Conclusion
More consolidation appears to be on the horizon throughout September with seasonality and liquidity set to turn bullish in October. This time next month we will have a clearer picture of liquidity and markets as the data becomes available.
In saying that, we like to leave the reader with some data and thoughts on investing for a longer-term time horizon to not get caught up in the day-to-day price action.
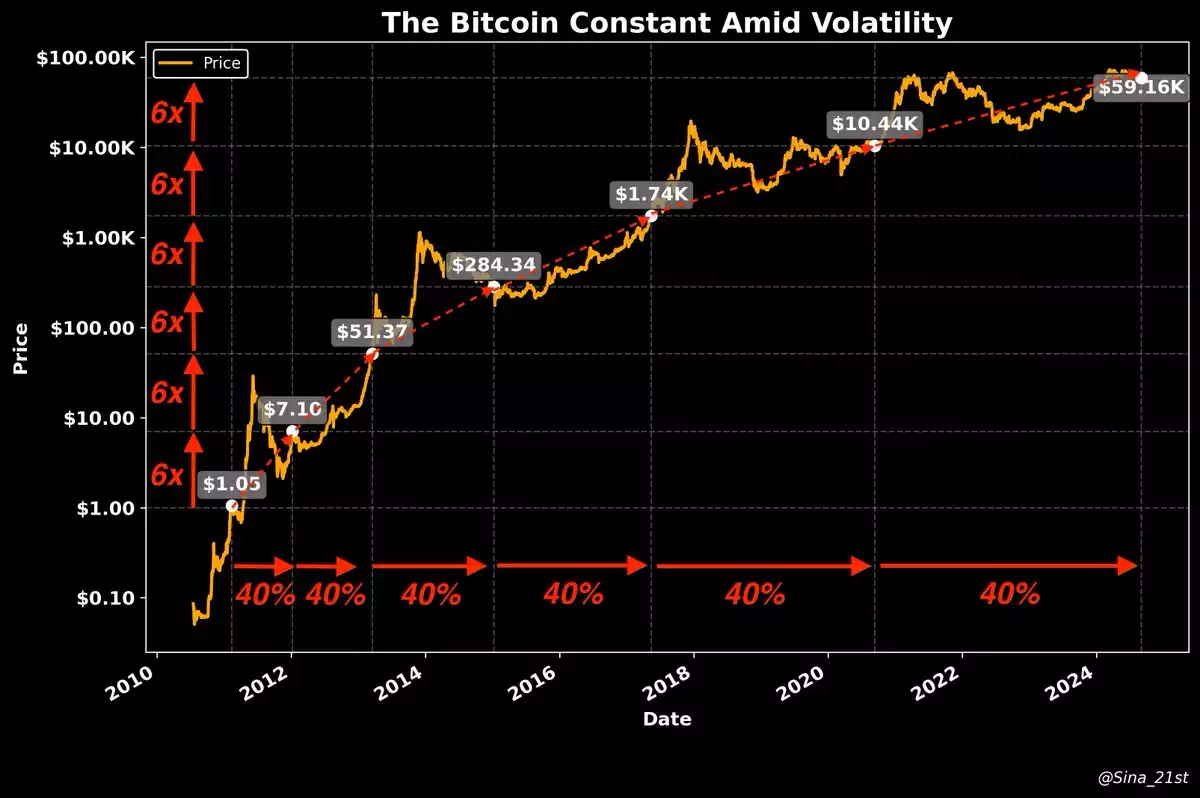
This chart shows the correlation between BTC and its growth in age. It suggests that for every 40% growth in age, the price will do a 6x multiplier. The next 40% growth will be in 2030 (or 21 years old) with a price target of $360,000 U.S. dollars. While conservative compared to some forecasting models like ‘Stock to flow’ or ‘The power law’ that suggests 1 million dollar BTC by 2030, we feel it’s better to overshoot, rather than than overshoot expectations. $360,000 by 2030 is still a 35% compounded annual return!
Compare this to the benchmark of the Nasdaq or S&P 500 which in the last 10 years have returned 20% and 15% respectively.
Watch the full presentation with detailed explanations and discussion on our YouTube Channel here:
Until we return with more analysis next month, keep stacking those sats!
Joseph Brombal
Research and Analysis Manager
The Ainslie Group
x.com/Packin_Sats
Share this Article:
Crypto in your SMSF
Top Movers
Get Started Trading Crypto with Ainslie.
Join Thousands of satisfied customers who trust Ainslie for their cryptocurrency and bullion needs.


