Bitcoin Analysis: Beyond the Block – June 2024
June 13, 2024
Today the Ainslie Research team brings you the latest monthly update on Bitcoin – including the Macro fundamentals, market and on-chain technical metrics and all of the other factors currently driving its adoption and price. This summary highlights some of the key charts that were discussed and analysed by our expert panel. We encourage you to watch the video of the presentation in full here for the detailed explanations.
Bitcoin and Global Liquidity
Bitcoin is the most directly correlated asset to Global Liquidity. Trading Bitcoin can be thought of as trading the Global Liquidity Cycle, but with an adoption curve that leads to significantly higher highs and lows each cycle. As such we look to buy Bitcoin during the ‘Bust’ phase or liquidity low, then rotate out of it during ‘Late Cycle’ where liquidity is over extended and downside protection is required (our preference is to rotate into Gold). When correctly timing and structuring the rotation, it is possible to significantly outperform ongoing monetary debasement. The Bitcoin cycle low was in November 2022, and since then the returns have been unmatched by any other major asset.
Where are we currently in the Global Macro Cycle?
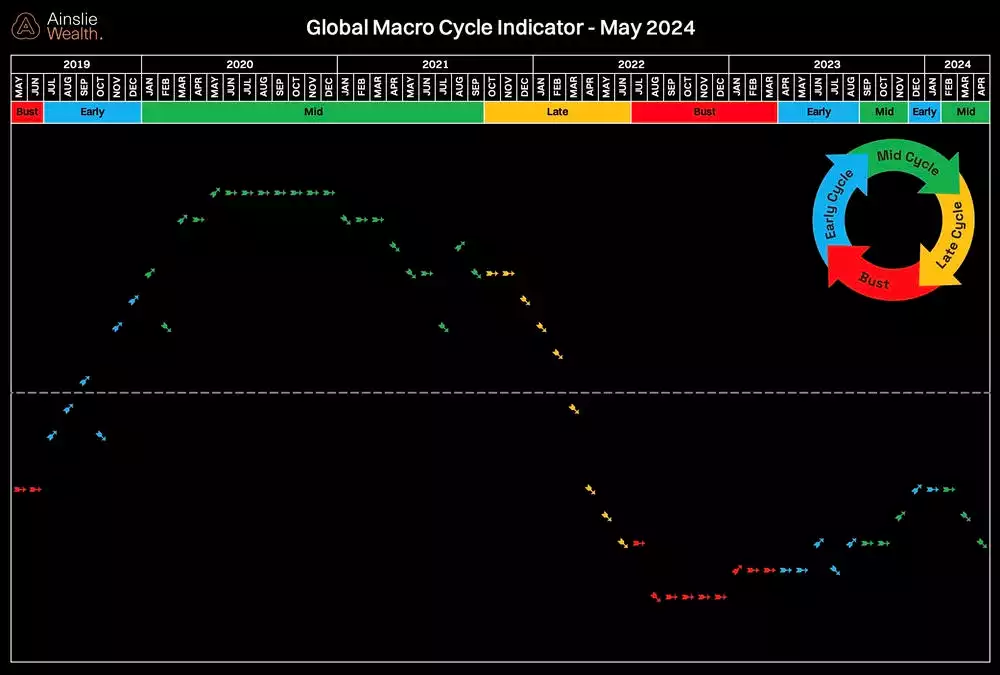
Although the Macro cycle indicator has turned down again this month, it remains in Mid Cycle. While it might seem contrary, a turn down is not necessarily a bad thing for risk assets going forward. As the world economy slows, governments and central banks will want to ‘goose’ the economy by adding more stimulus and liquidity to give growth a boost.
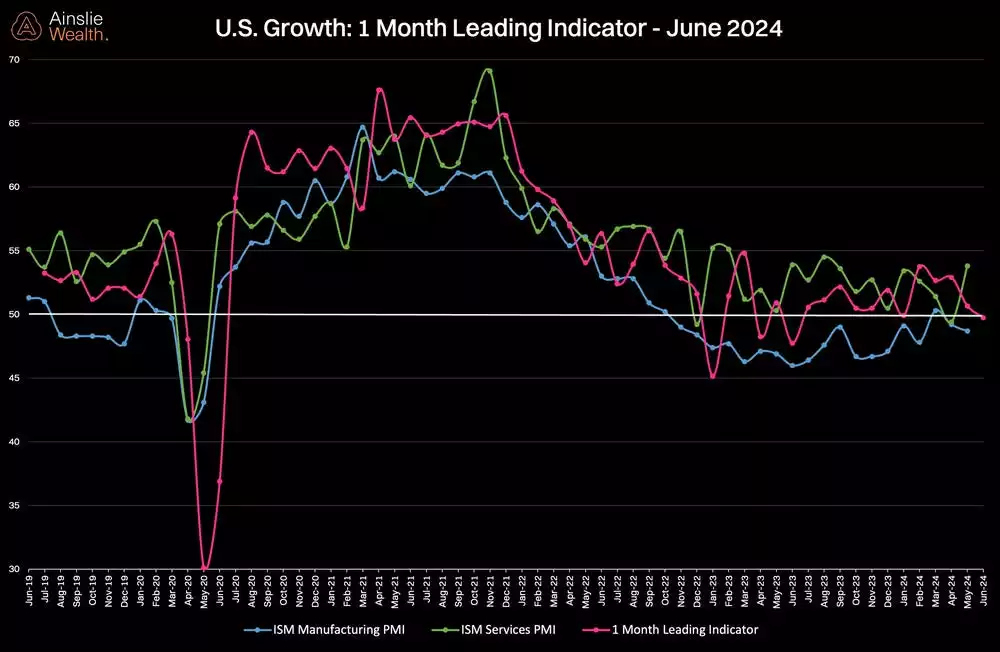
U.S. economic growth, as measured by the ISM data, is a useful tool to forecast the trajectory of the economy moving forward. This month, the service sector has seen a sharp bounce higher while manufacturing remains in slight contraction. The 1-month leading indicator is an average of the services and manufacturing new orders.
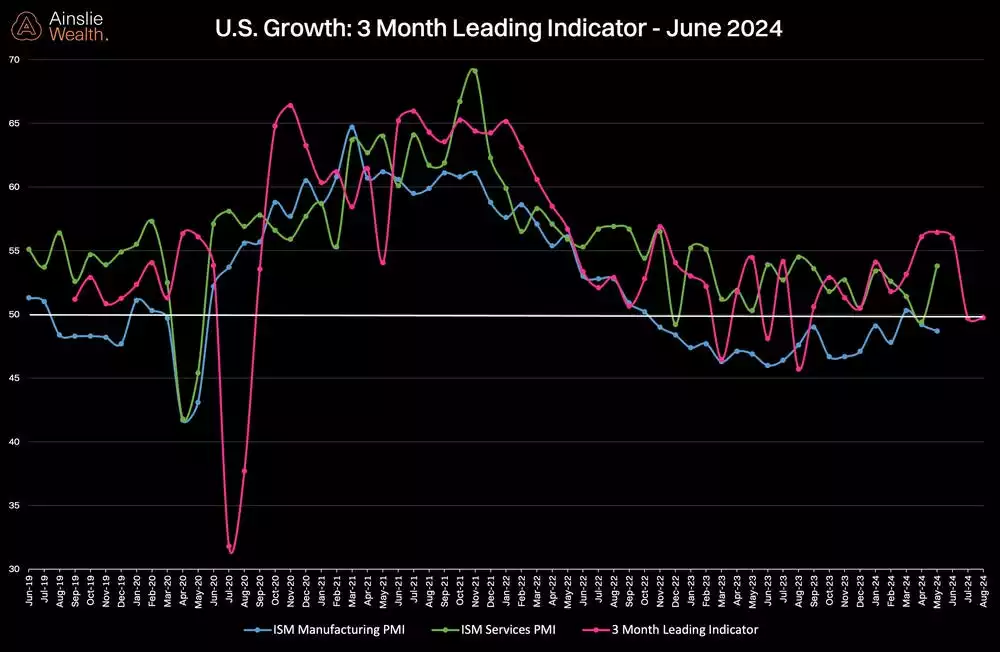
Like our 1-month leading indicator, the 3-month indicator which is new orders less inventories paints the same picture as we grind out a bottom before heading higher later in the year. Remember this data is usually a slow-moving beast, unlike the data to left of the chart during covid and unprecedented stimulus.
Where are we currently in the Global Liquidity Cycle?
Global Liquidity leads the movement of World financial assets, so this is the indicator we look most closely at to determine where the opportunities are to take advantage of Bitcoin’s cycles.
In the May update, we declared the liquidity ‘air pocket’ was over and is “ready to start heading higher”. That is exactly what has occurred, except for the last week where liquidity has flat lined due to volatility in the bond market. We expect this chart to continue going up and to the right throughout the rest of the year however.
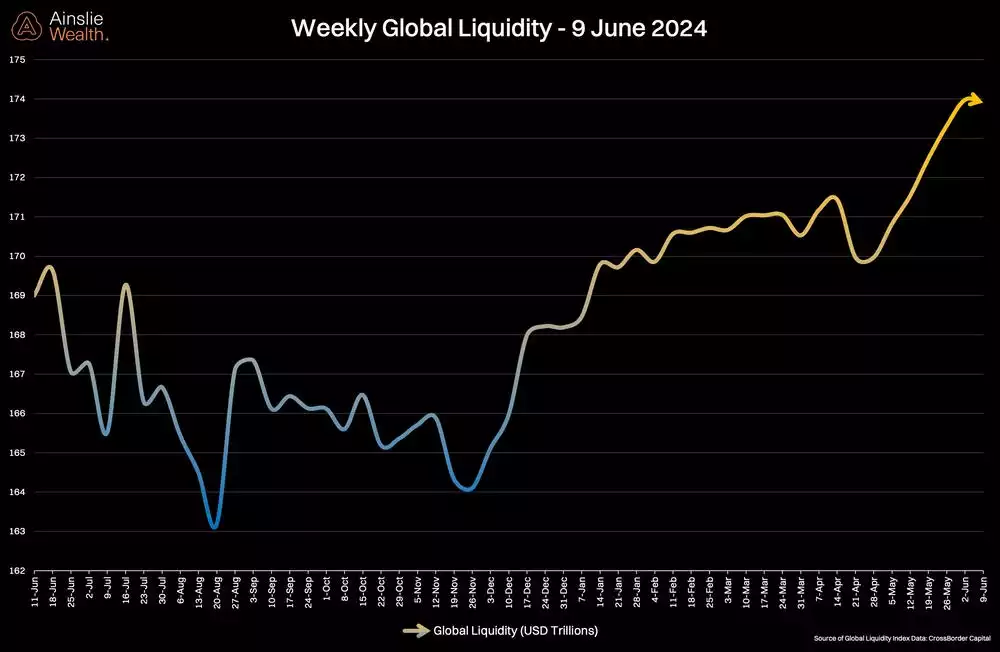
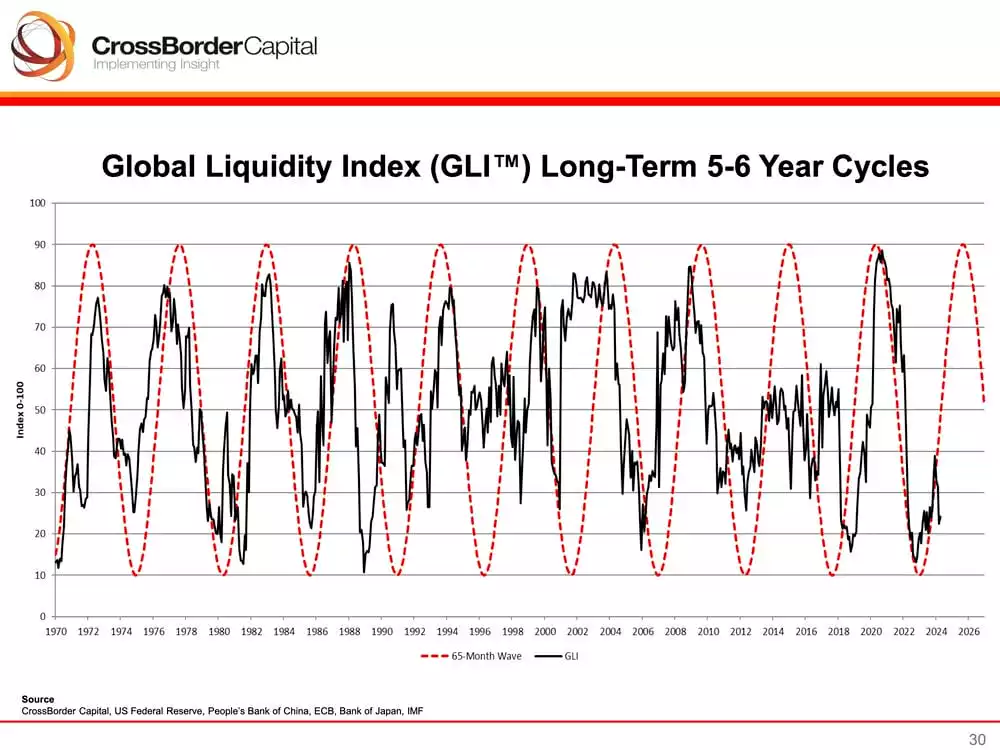
The Global liquidity index has been turning down over the past 2 months for the reasons mentioned above. The sine wave is a proxy for government debt cycles and with nearly 9.3 Trillion of debt needing to be rolled within a year in the U.S. alone, balance sheet capacity and therefore increased liquidity will be essential.
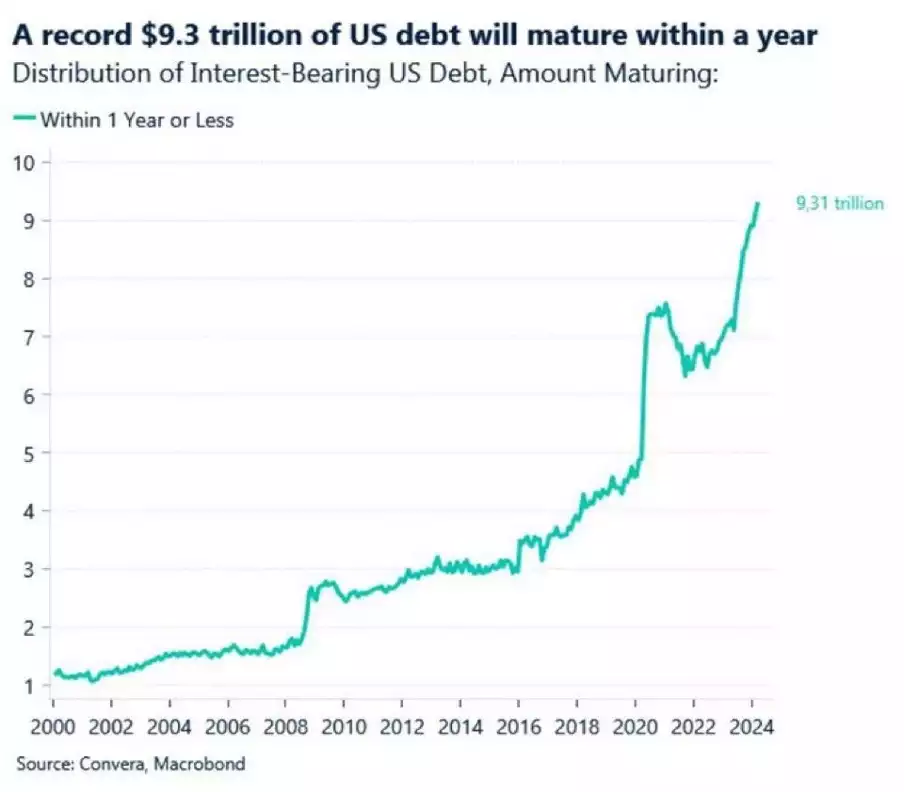
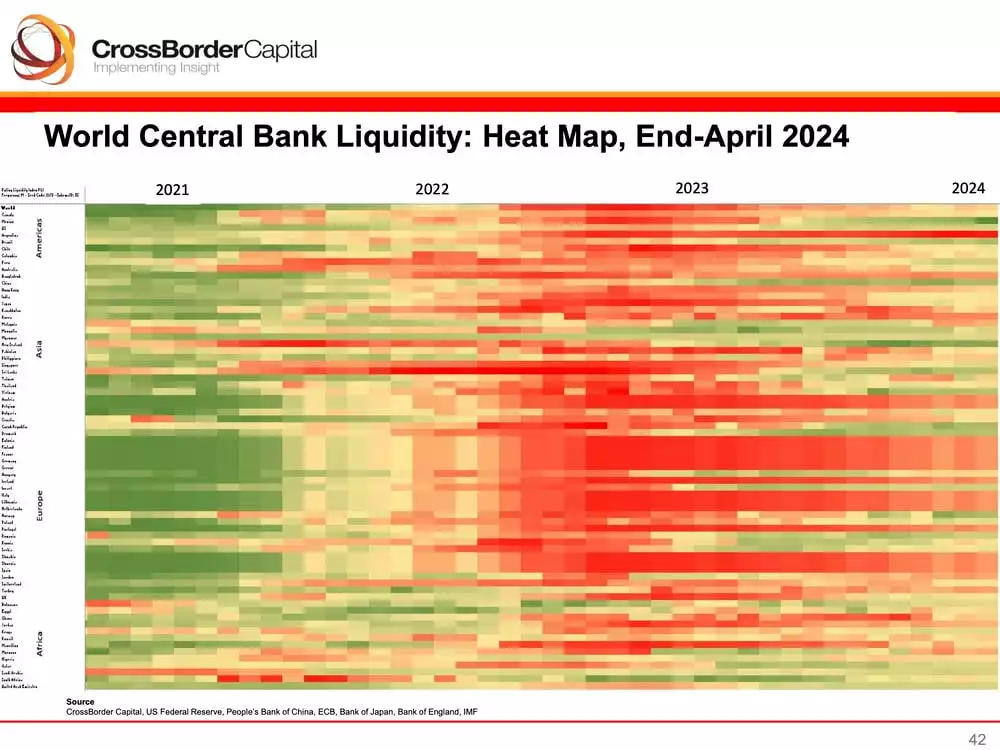
Speaking of balance sheet capacity, Central banks continue to ease globally which is clearly seen in the heat map below. The European Central Bank and the Canadian Central Bank both cut interest rates by 0.25% last week signalling the continuation of the easing policies. As the year progresses more liquidity (green) will be added by world central banks, having a positive impact on asset prices, particularly Bitcoin.
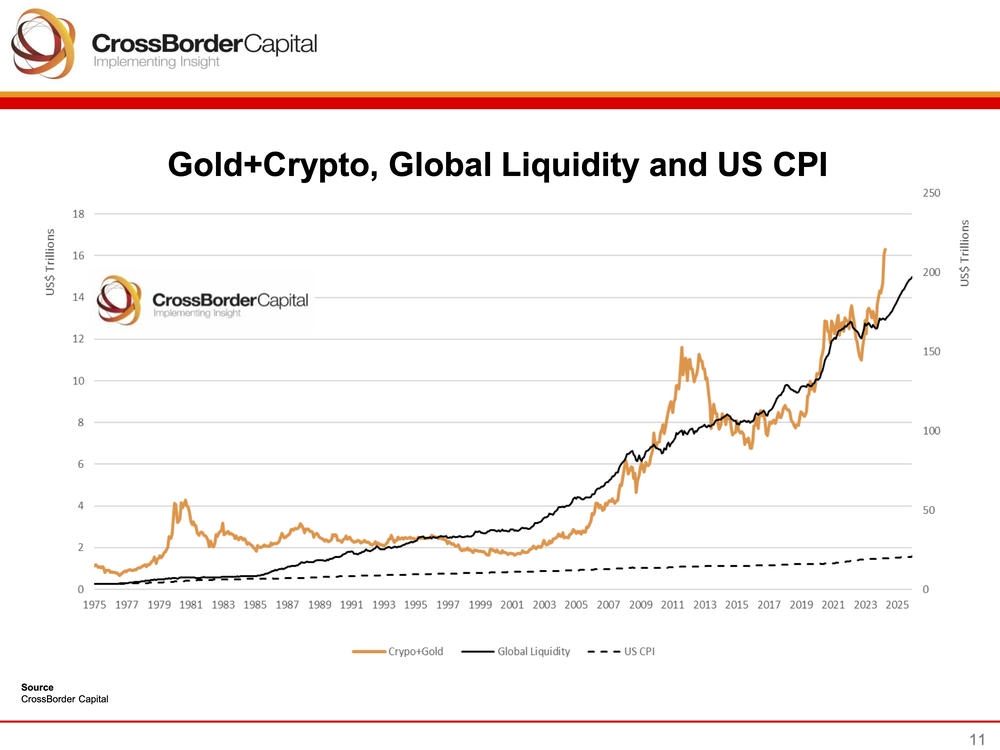
Global Liquidity against Gold + Bitcoin shows the correlation between asset prices and liquidity. Data suggests that for every 10% move in Global Liquidity, Gold moves 15%. Bitcoin acting as ‘Exponential Gold’ moves 50% for every 10% rise in Global Liquidity.
If we know the direction of liquidity, we know the direction of Gold and Bitcoin.
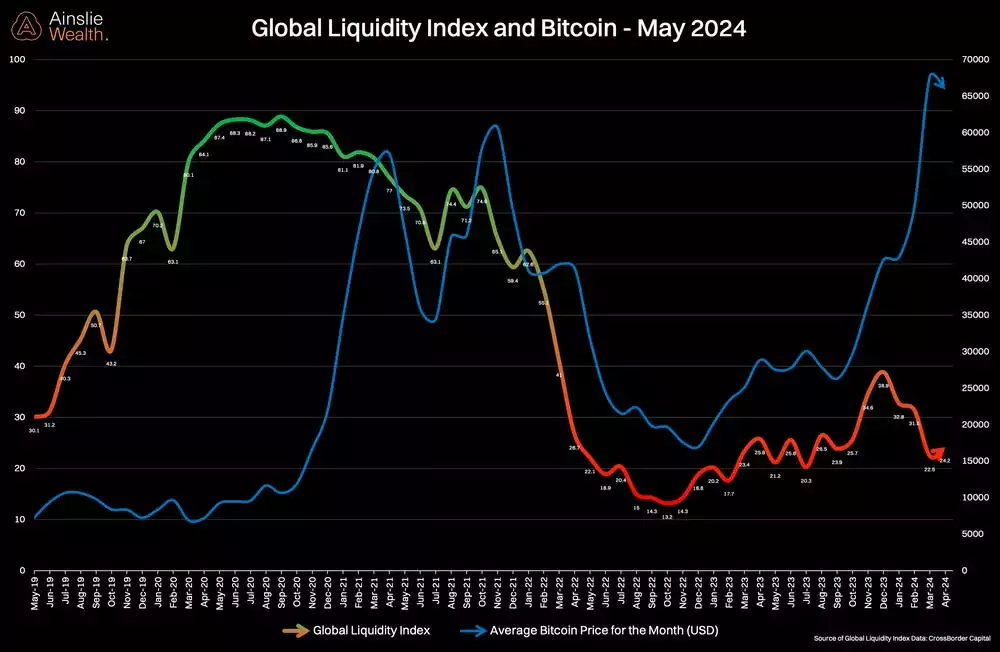
The Bitcoin monthly average price overlayed with liquidity tops and bottoms shows how sensitive it is to liquidity. The chop from last month has continued which is not a surprise, however Bitcoin has held up remarkably well during the liquidity ‘air pocket’. Consolidation was needed after a large run up from the start of the year, but based on our liquidity forecasts, Bitcoin could be a rocket ship in the second half of the 2024.
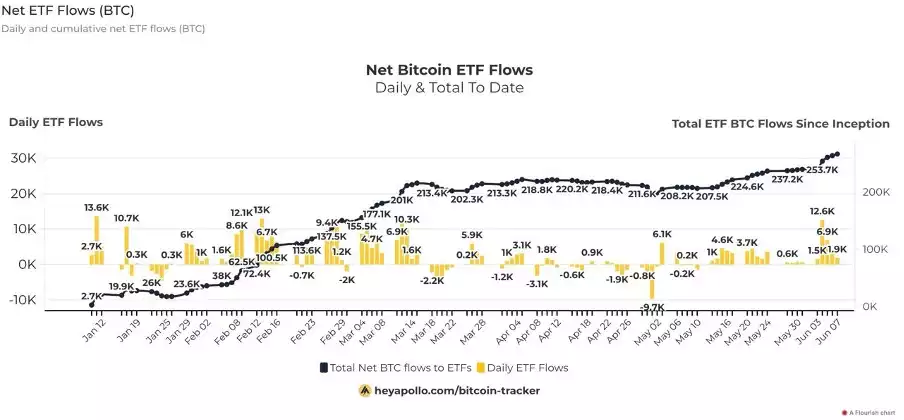
ETF flows up once again, but with a caveat
ETF volumes and flows have picked up since last month with 19 straight days of inflows. Last week alone saw just under 1 billion dollars of ETF inflows. However there has been a lot of ‘head scratching’ as to why these inflows have not directly impacted Bitcoin’s price to the upside.
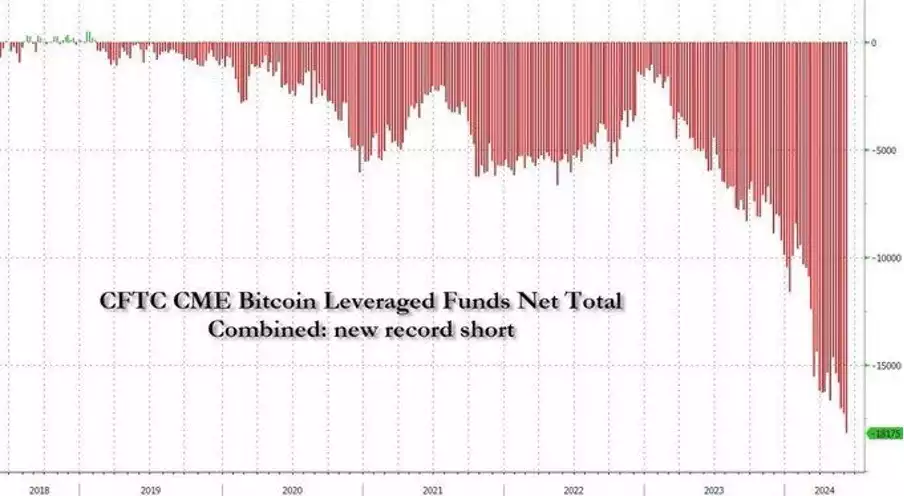
Below are the net short positions on the CME’s futures contracts. Since the ETFs launched in January there has been significant growth in these short positions. A large portion of these positions are hedge funds looking to capture the ‘basis trade’ where they short the futures contract to capture the premium, but also buy spot via the newly tradable ETFs. These two trades make the overall position for the hedge funds neutral and therefore have no impact on the underlying price of Bitcoin.
From our own analytics, there are around 91,000 in Bitcoin short positions on CME (approximately $6 Billion) which is offset directly with long positions in the Bitcoin ETFs. For perspective, the spot Bitcoin ETFs minus GBTC (since GBTC Bitcoin existed before the ETFs and can’t be included in flows) have had $42 Billion of inflows since launch.
CME shorts make up less than 15% of the total ETF flows, though that doesn’t mean the more recent inflows aren’t a product of these basis trades.
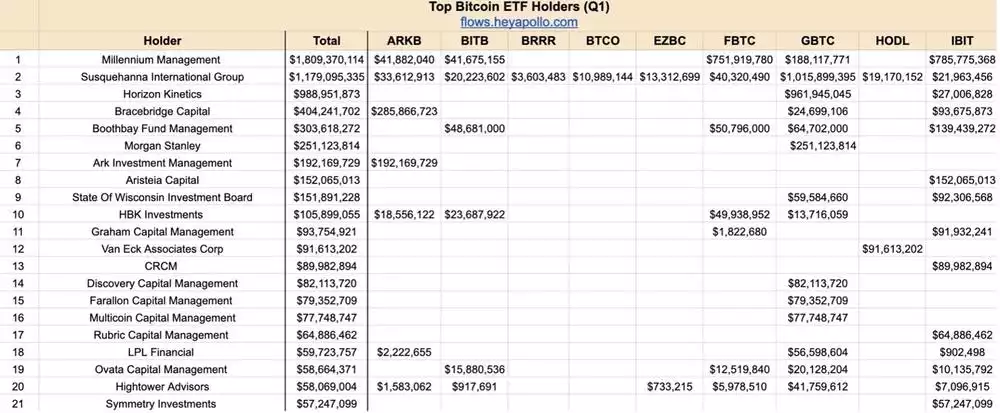
Below is a snapshot of the top 20 holder of Bitcoin ETFs. Yes, some of them will be conducting the ‘basis trade’ which neutralises their ETF position. However, from the analysis above, the long only holders are the majority.
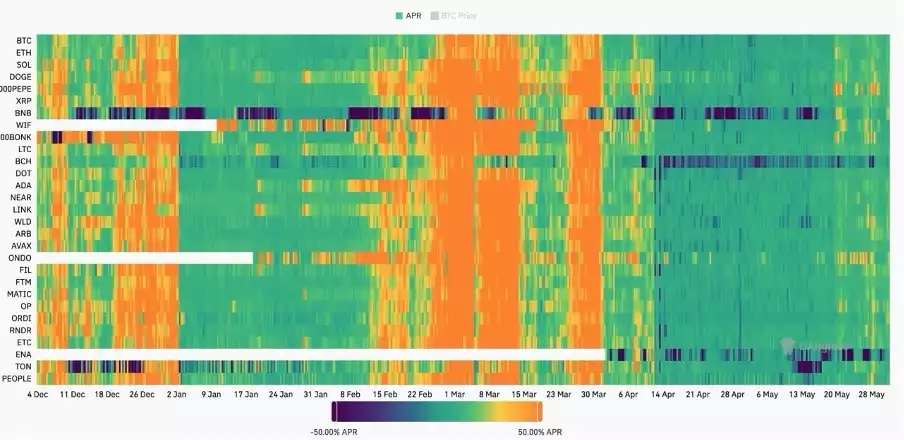
Finally, the chart below demonstrates the amount of leverage that is built up in the crypto ecosystem. You will notice that when the price is going up (orange bars) traders must pay a funding rate for the privilege to go long on perpetual contracts. The funding rate is designed to anchor the futures price to the spot price. When the market is bullish traders are happy to pay the fee.
Funding rates have pulled back significantly (green bars) allowing for a healthy reset of leverage since the majority of long traders have been washed out. This is a bullish contrarian indicator and it is only a matter of time until price and funding rates pick up again. In fact, it may have already started with the yellow bars beginning to appear.
Conclusion
While Bitcoin continues to consolidate through the months of April, May and June, it is important to remember that based on liquidity and economic growth indicators, we know that long term price appreciation is looking promising. The hard part is to not get shaken out during the boring times and add during dips to bring your dollar cost average down and stay in the market. If you wait for the market to move it will often be too late.
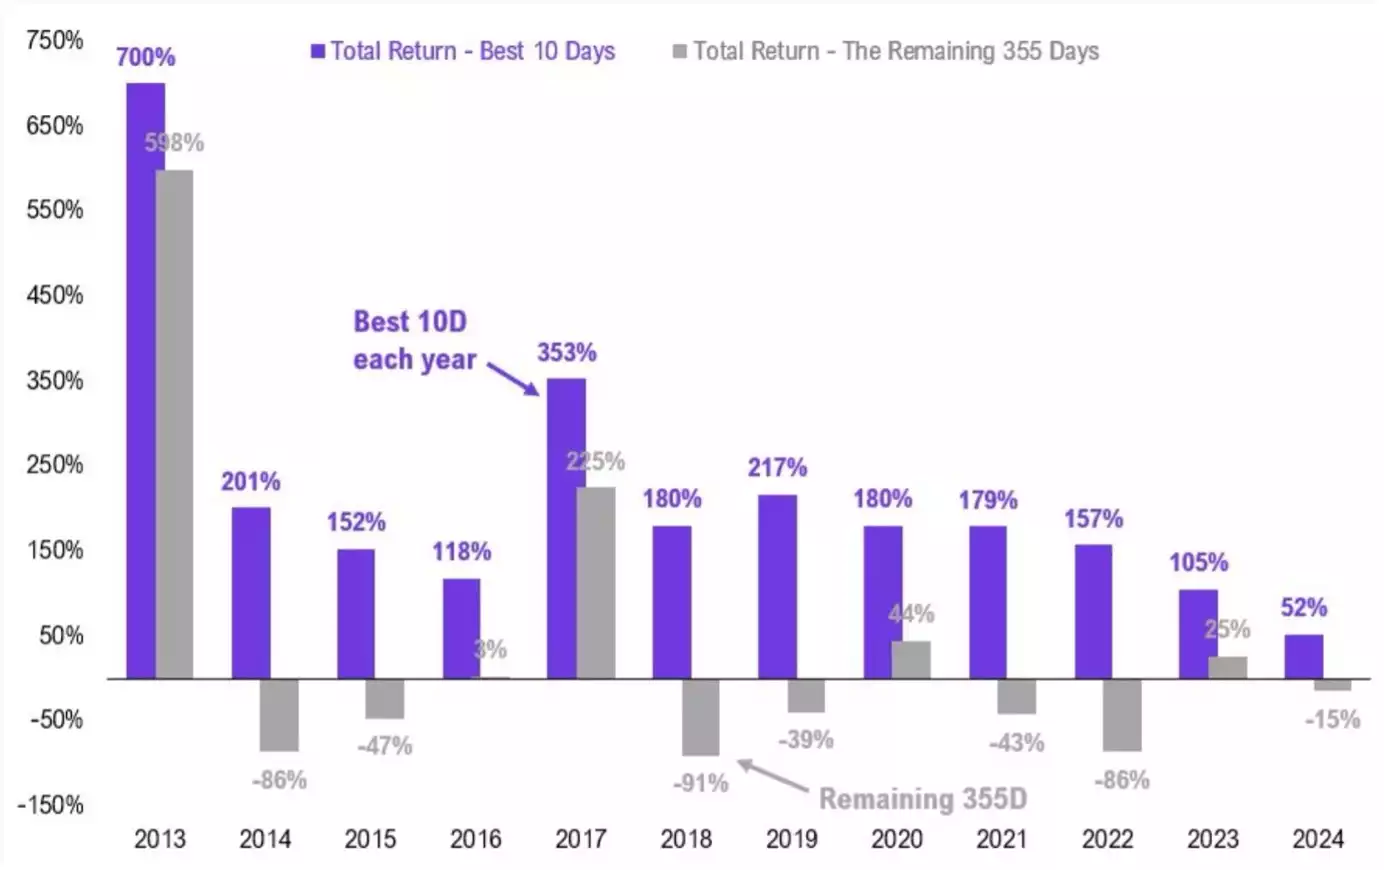
To reinforce our point, below is a chart of Bitcoin’s performance during the 10 best trading days of the year for the past 11 years. The 10 best days usually outperform the other 355 days and occasionally those 355 days are negative.
Patience is key.
Watch the full presentation with detailed explanations and discussion on our YouTube Channel here: youtube.com/watch?v=-0yxv73c8SI
Until we return with more analysis next month, keep stacking those sats!
Joseph Brombal | Research and Analysis Manager
The Ainslie Group
x.com/Packin_Sats
Share this Article:
Crypto in your SMSF
Top Movers
Get Started Trading Crypto with Ainslie.
Join Thousands of satisfied customers who trust Ainslie for their cryptocurrency and bullion needs.


