The Rise of New Investors Amidst Fluctuating Sentiments in 2023
September 19, 2023
Understanding Short-Term Holder Sentiment
Recent trends highlight a surge in negative sentiment among short-term holders, many of whom find their investments not performing as anticipated. However, this prevailing sentiment could potentially serve as a marker, helping us understand the current market trends and investor behaviours more intimately.
Examining Accumulation and Distribution Patterns
Looking towards the prevalent accumulation and distribution patterns in the market, we can examine alignment with local peaks and troughs. Leveraging on-chain data, we can decipher these patterns, offering a well-rounded view that could aid investors in understanding the market dynamics at a granular level.
At present, the Bitcoin market hovers around the US$26k bracket, indicating a transitional phase in market psychology and investor confidence levels. Despite facing hurdles in sustaining prices above the $31.4k midpoint, as seen in April and July, these patterns might signify a shifting market psychology, possibly heralding significant market movements ahead.
Unveiling Key Pricing Models for Robust Analysis
There are two essential pricing models we can utilise in analysing the digital asset market:
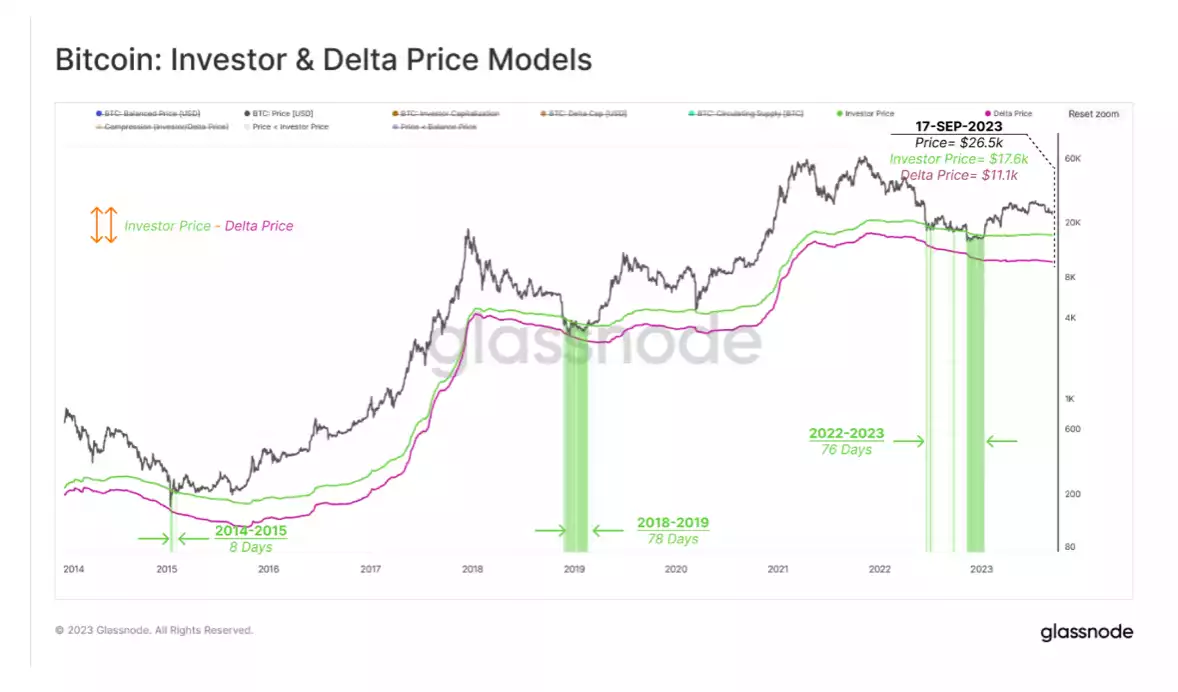
- Investor Price ($17.6k) – Representing the average entry price for investors, this model offers a vantage point to discern potential market support or resistance levels.
- Delta Price ($11.1k) – A holistic approach that combines on-chain and technical strategies to pinpoint potential cycle floors, aiding in anticipating market lows based on historic data and on-chain metrics.
Comparative Insights from Previous Market Cycles
Analysis of the 2018-19 vs. 2023-23 market reveals similarities in the timeframes where the market traded within these pricing models during low cycles, facilitating a better understanding of the market’s cyclical behaviour.
Recalling the dramatic events of March 2020, we notice the market reverting to the “Investor Price” during the sharp sell-off, underscoring this price point’s significance as a potential support level during market downturns.

The Significance of Duration Between Models
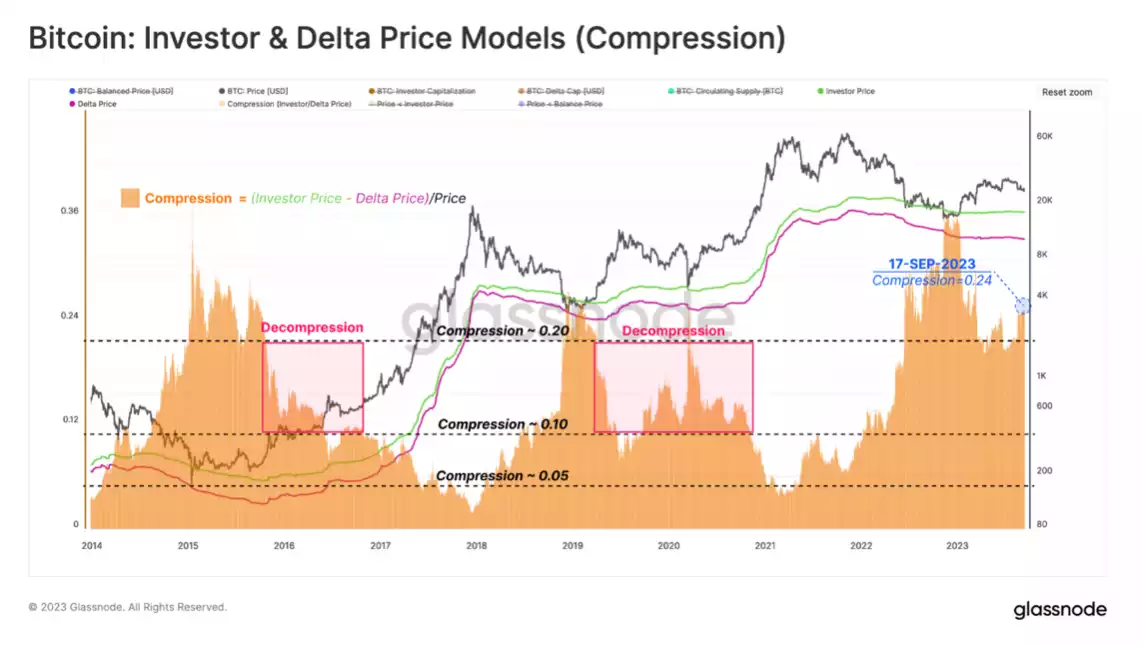
A notable facet of market analysis is understanding the compression and expansion observed between different price models. Here’s how these phenomena act as indicators of market trends:
- Compression Near Cycle Tops: A compression near the cycle tops usually signals a bullish phase, representing a time when substantial capital is channelling into the market. This phenomenon can be seen as a precursor to a potential upswing in market dynamics.
- Divergence Indicating Softer Capital Inflow: Conversely, a divergence or expansion between the models tends to indicate a softer capital inflow, which could hint at a bearish phase dominating the market, characterised by declining prices.
Drawing Parallels with Past Decompression Phases
Drawing attention to the resemblance between the current market structure and the decompression phases of 2016 and 2019 can be a beacon of optimism.:
- 2016 Decompression Phase: Reflecting on this period hints at an era marked by substantial recovery and growth, setting the stage for a booming market in the ensuing years.
- 2019 Decompression Phase: Citing this phase showcases a resilient market that managed to bounce back from a series of lows, offering hope for current investors.

A Closer Look at the Realised HODL Ratio (RHODL)
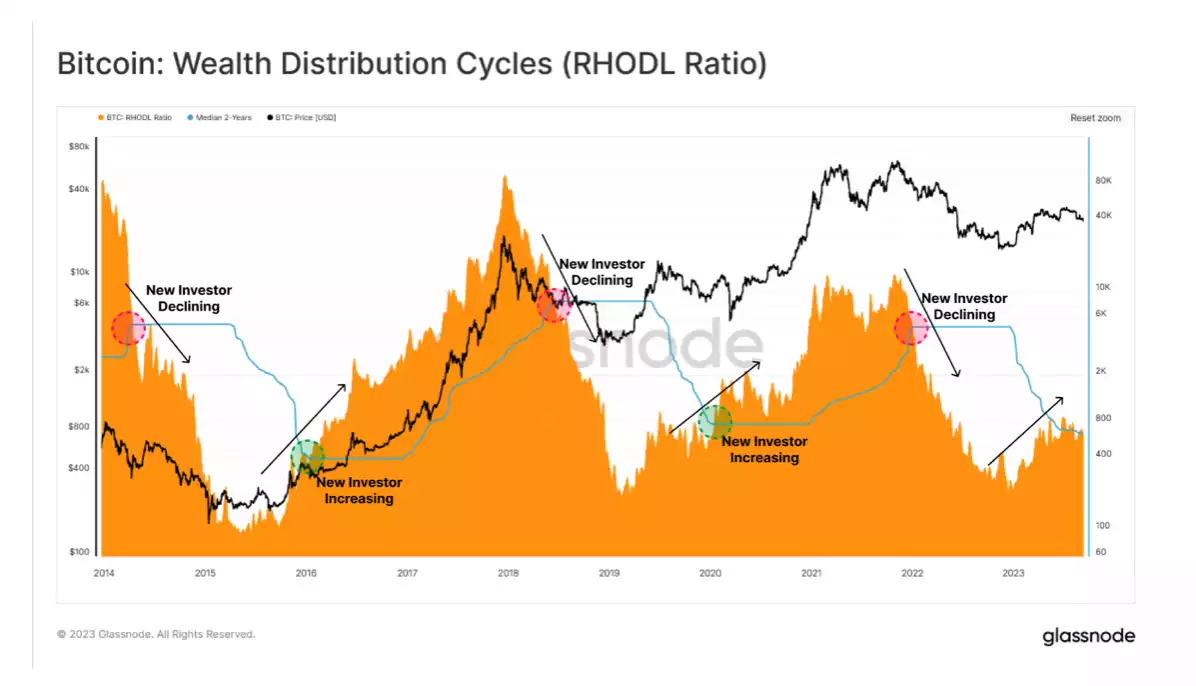
The RHODL serves as an insightful market indicator, adept at delineating the capital rotation dynamics in the crypto sector. It meticulously monitors the balance of wealth vested in recently moved coins (less than a week) and juxtaposes it against the investments nurtured by mature HODLers who have held onto their assets for a period of 1 to 2 years.
Harnessing the 2-Year Median as a Strategic Threshold
A 2-year median – equivalent to a half market cycle – functions as a benchmark for analysis. This threshold assists in pinpointing the transitions between bullish and bearish market phases, facilitating a nuanced understanding of capital flow regimes and overarching market trends.
Insights from the 2023 Market Analysis
A glimpse into the market scenario in 2023 reveals a modest yet promising surge of new investors gracing the crypto market. Notably, despite this influx, the RHODL ratio is only approaching the 2-year median level, hinting at a steady progression towards a crucial transition point in the market structure.
Capturing the Investor Momentum in 2023
The entry of new investors in 2023 marks a positive trajectory for the crypto market. However, it is prudent to note that the momentum displayed is not vehemently strong, indicating a softer pace of new investments. This scenario paints a picture of a cautious cadre of new investors, possibly adopting a vigilant stance before fully immersing themselves in the market dynamics.

The Bitcoin market is experiencing a pivotal shift in sentiment, particularly among short-term holders. A considerable segment of this group finds their investments currently valued at less than their initial investments, a phenomenon referred to as being ‘underwater’. This signals a growing negativity which might pave the way for a period of distressed selling in the market. We are witnessing signs of heightened anxiety among these investors, characterised by a trend of panic-like behaviour that has emerged prominently for the first time since the FTX collapse. We are at a crucial crossroads where investor behaviour could steer the market in significant new directions.
However, despite the prevailing undertones of uncertainty, the year 2023 has ushered in a wave of both fresh capital and new investors, illustrating a budding resurgence in the market. Though the momentum might seem restrained at this juncture, it is important to acknowledge this positive influx as a testament to the enduring allure and potential resilience of the crypto market.
Remember to subscribe to this newsletter and follow us on social for regular updates on the dynamic world of blockchain and cryptocurrency. If you’re interested in an easy and personal way to buy/sell/swap cryptocurrency, don’t hesitate to contact us – call 1800 AINSLIE. Our team of friendly consultants are ready to guide you, your company, or SMSF through the process, making your cryptocurrency buying journey effortless. We also offer industry-leading crypto custody with minute-by-minute internal audits to guarantee the safety of your assets.
Share this Article:
Crypto in your SMSF
Top Movers
Get Started Trading Crypto with Ainslie.
Join Thousands of satisfied customers who trust Ainslie for their cryptocurrency and bullion needs.


