BITCOIN’S BOLD DANCE AT THE US$30K MIDPOINT – IS A BREAKOUT LOOMING?
July 11, 2023
Bitcoin Market’s Resilient Performance Amid Consolidation
The cryptocurrency market’s undisputed titan, Bitcoin, has held its ground around the US$30k mark, demonstrating commendable resilience in the face of market turbulence. This value point characterises the ‘mid-point’ of the 2021-23 market cycle. Despite market flux, the year-to-date performance of Bitcoin remains historically robust, continuing to fascinate investors with its unparalleled volatility and potential for high returns.
The Bitcoin network’s inscription count, a critical indicator of activity, has seen a significant decrease, thereby clearing network congestion. Simultaneously, the volume of monetary transfers has noted a remarkable surge, increasing by a substantial +75% since its nadir in November. This indicates a shift in the dynamics of the market, reflecting a surge in Bitcoin transactional activity.
A state of equilibrium between the supply of Bitcoin held in profit and those in loss has been achieved, a scenario reminiscent of the ‘re-accumulation period’ seen in previous market cycles. These periods often span several months, signalling a phase of consolidation and potentially leading to a significant breakout.
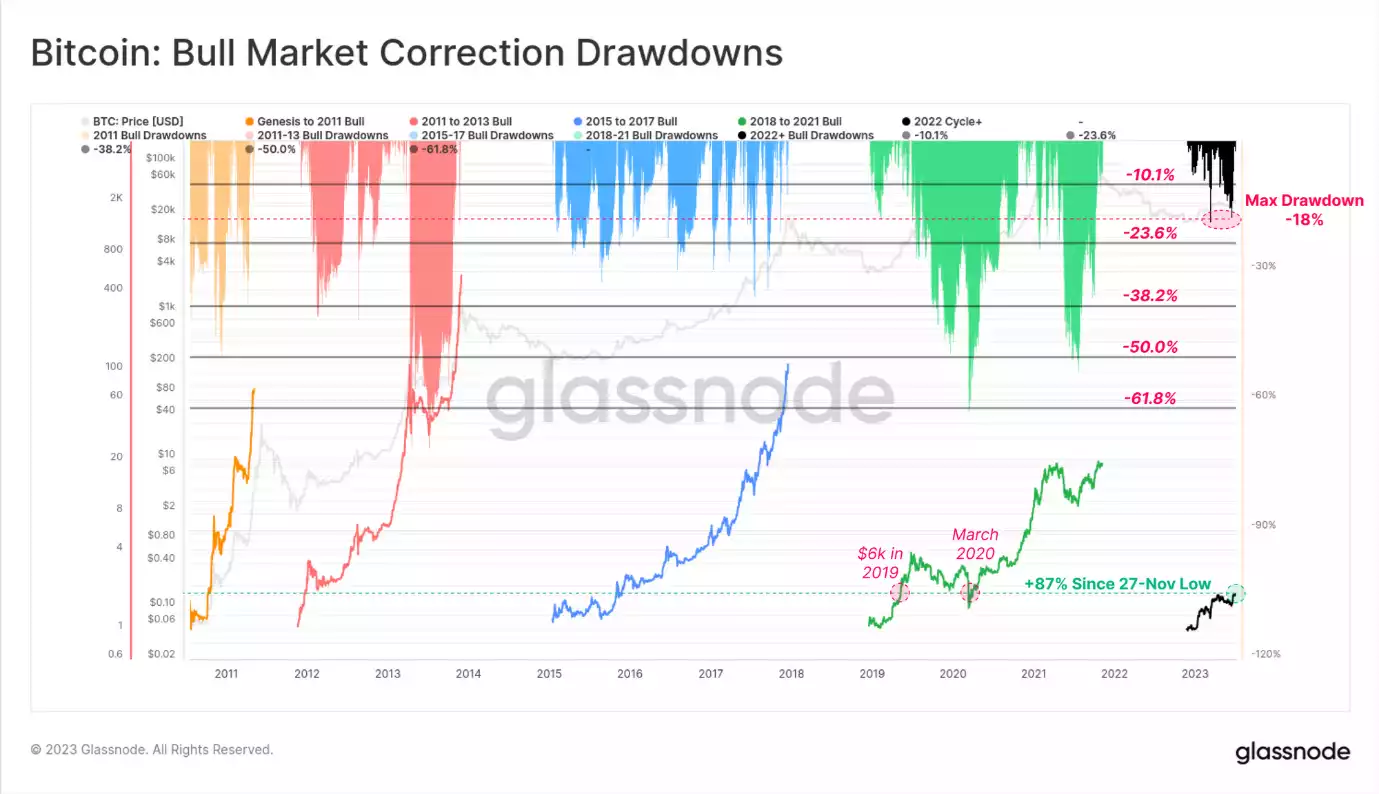
Despite the market turbulence, the Bitcoin market has managed to preserve most of its gains from 2023. The price has rebounded above $31k in recent weeks, a consolidation near annual highs. This provides an opportunity to analyse current price performance through the lenses of both bull and bear markets. Viewing the lows of November 2022 as the cycle’s floor, the ‘bull market corrections’ thus far indicate a modest peak drawdown of -18%, relatively shallow compared to all previous cycles. This potentially points towards a strong level of demand underpinning the asset.
Reflecting on the Bear Market Perspective
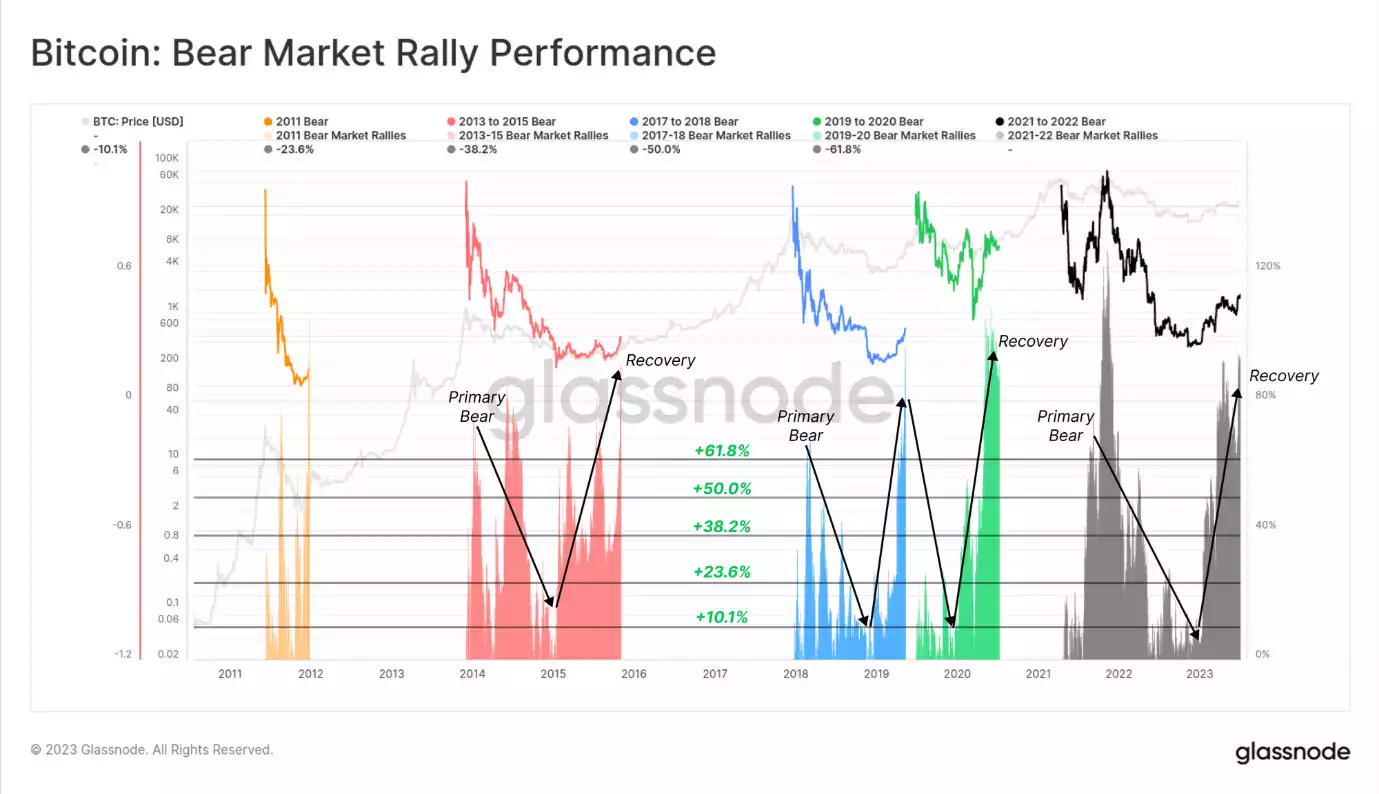
Analysing the 2023 market performance indexed from the cycle’s All-Time High (ATH) offers valuable insight from a bear market perspective. The strong recovery from the lows of November 2023 is noteworthy, up 91%, a recuperation that closely mirrors recovery rallies in previous market cycles.
Except for the year 2019, all prior market cycles that experienced a similar magnitude of recovery from their lowest points signalled the beginning of a new cyclical uptrend. This observation suggests that the current recovery might potentially indicate the commencement of a new uptrend in the market cycle.
The Advent of Ordinals and Inscriptions
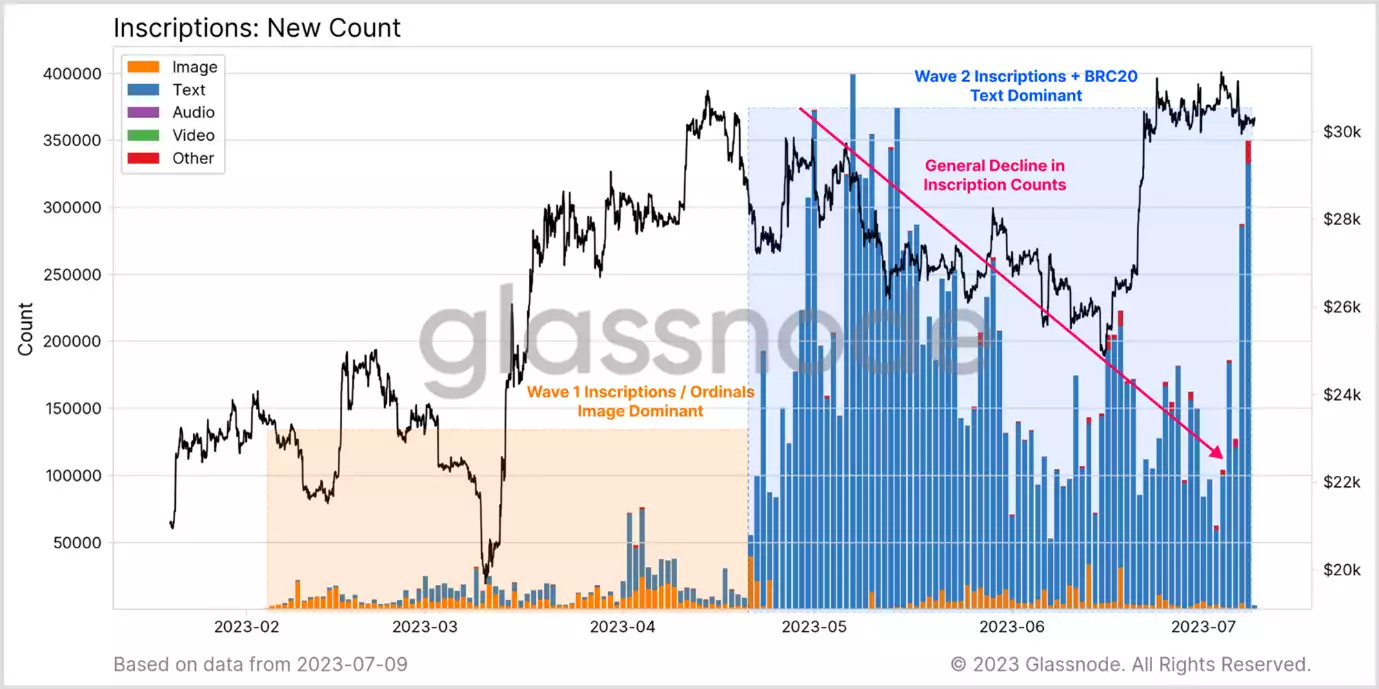
2023 has brought an unexpected development in the form of ordinals and inscriptions on Bitcoin, materialising in two distinct waves. The first wave mainly focused on image-based inscriptions, leading to the creation of Non-Fungible Tokens (NFTs) on the Bitcoin network. This creative surge resulted in an astounding 1.08 million images inscribed on Bitcoin to date.
The second wave was predominantly characterised by high fee-paying text-based inscriptions associated with ‘BRC-20 tokens’. In aggregate, Bitcoin now hosts a staggering 14.8 million text-based inscriptions. By the count of inscriptions, the second wave was significantly larger than the first. Despite a minor surge in text inscriptions during the current week, unconfirmed transactions across Bitcoin mempools are generally clearing.
Reinterpreting On-Chain Activity Metrics
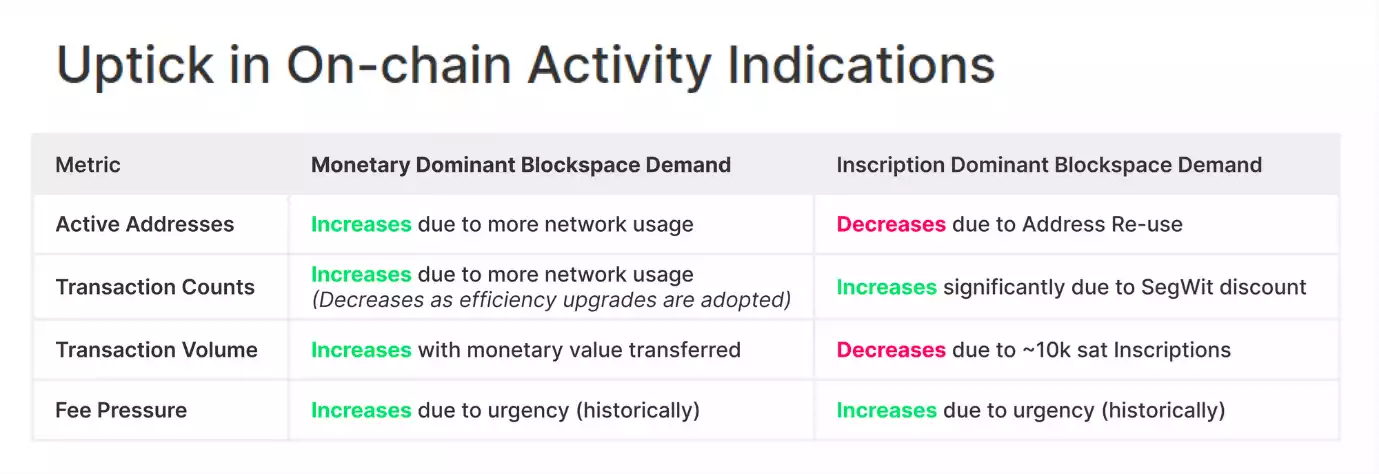
The emergence of inscriptions necessitates a shift in our understanding and interpretation of Bitcoin’s on-chain activity metrics. Conventionally, an increase in Bitcoin’s on-chain activity metrics is perceived positively, signalling burgeoning adoption and a robust network.
A New Perspective on Network Activity
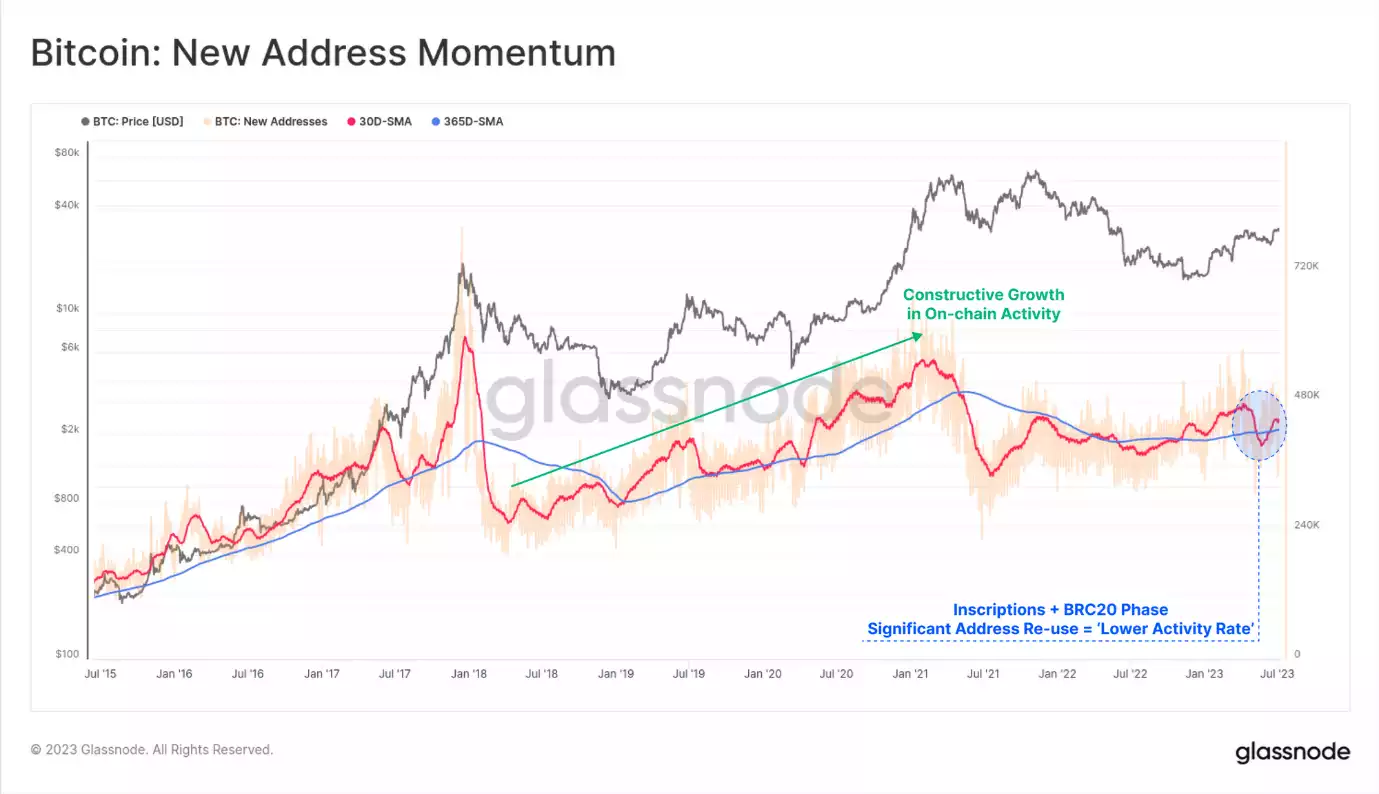
As activity related to inscriptions begins to decline, the momentum of active addresses in the Bitcoin network is starting to rise. Traditional analysis might interpret the events of the past 2-3 months as an implied decrease in Bitcoin network activity, suggesting a perceived decline in the use of the network.
However, a more accurate interpretation suggests that the apparent decline was due to significant address reuse by inscription traders. This does not mean less activity, but rather a consolidation of transactions to fewer addresses. In reality, network activity thrived during this period, indicated by blocks in the blockchain filled, signalling high transaction volume and network usage.
The Impact of SegWit on Transaction Counts
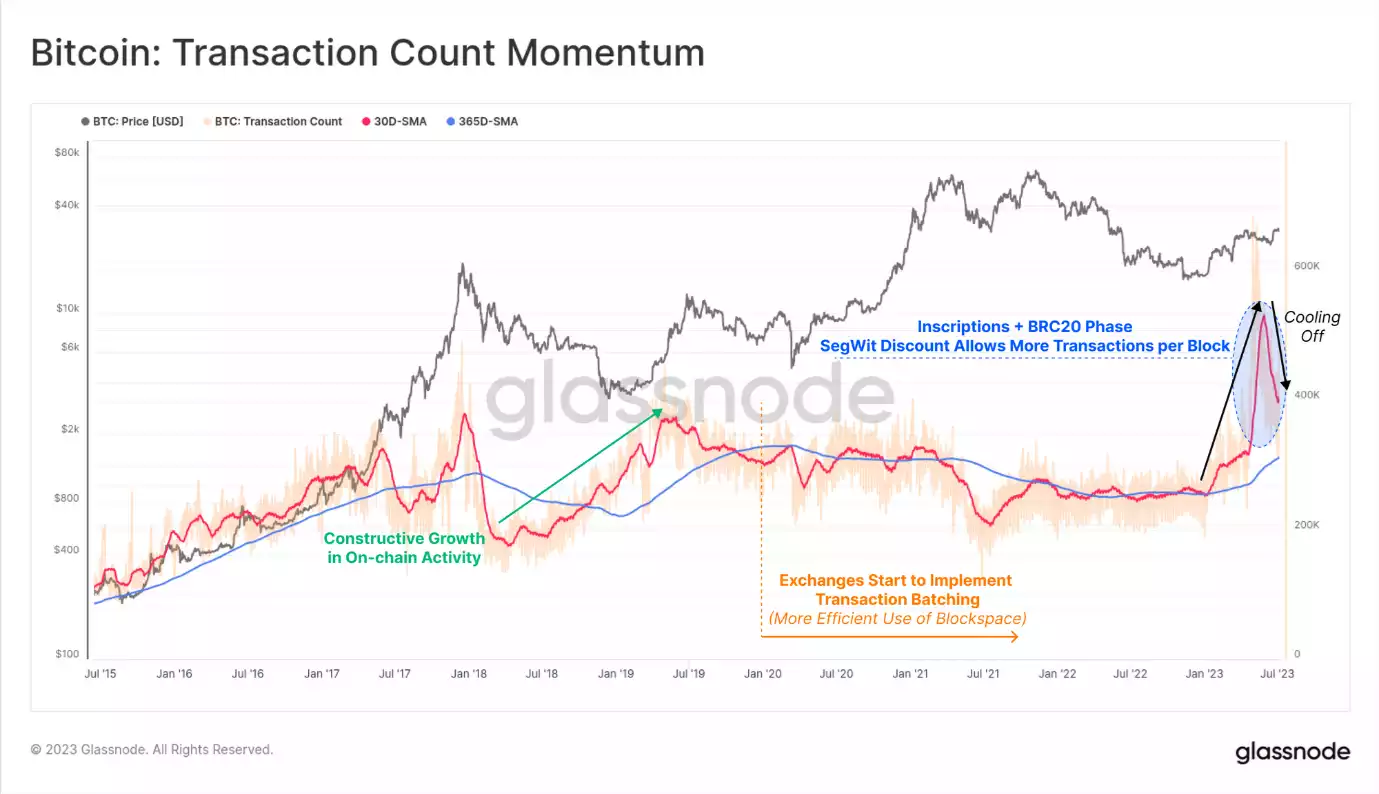
Blockchain transaction counts reached an unprecedented peak, driven by inscriptions leveraging the data discount offered by Segregated Witness (SegWit). The SegWit data discount allowed miners to include more transaction data in each block, with some blocks even approaching the theoretical hard limit of 4MB. Recent weeks, however, have seen a significant reduction in daily transaction counts, coinciding with the slowdown in inscription activity.
Mempools Clearing and Transaction Fees Declining
After several months of network congestion, Bitcoin mempools, the holding areas for unconfirmed transactions, are gradually clearing. Correspondingly, the on-chain transaction fees, which had surged due to the congestion, are now decreasing. Bitcoin network transaction fees in USD have seen a significant reduction of over 96% since the peak of the BRC-20 frenzy in May. The average transaction fee is now just $1.33, a stark decrease from its previous high, with the median fee standing at a mere $0.16.
The Significance of ‘Mid-Points’ in Market Cycles
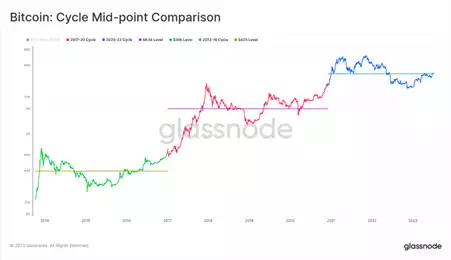
Cryptocurrency data exhibits fascinating patterns across different cycles. In the 2021-22 cycle, the $30k price level formed a ‘mid-point’, tested multiple times from both above and below. Comparable patterns were observed in the 2013-16 cycle around the $425 price level, and the 2018-19 cycle at approximately $6.5k.
These levels coincide with points where a similar volume of supply was held ‘in-loss’, further highlighting their significance in different market cycles. These ‘in-loss’ points often serve as crucial psychological barriers or support levels for traders.
Navigating the ‘Re-Accumulation Period’
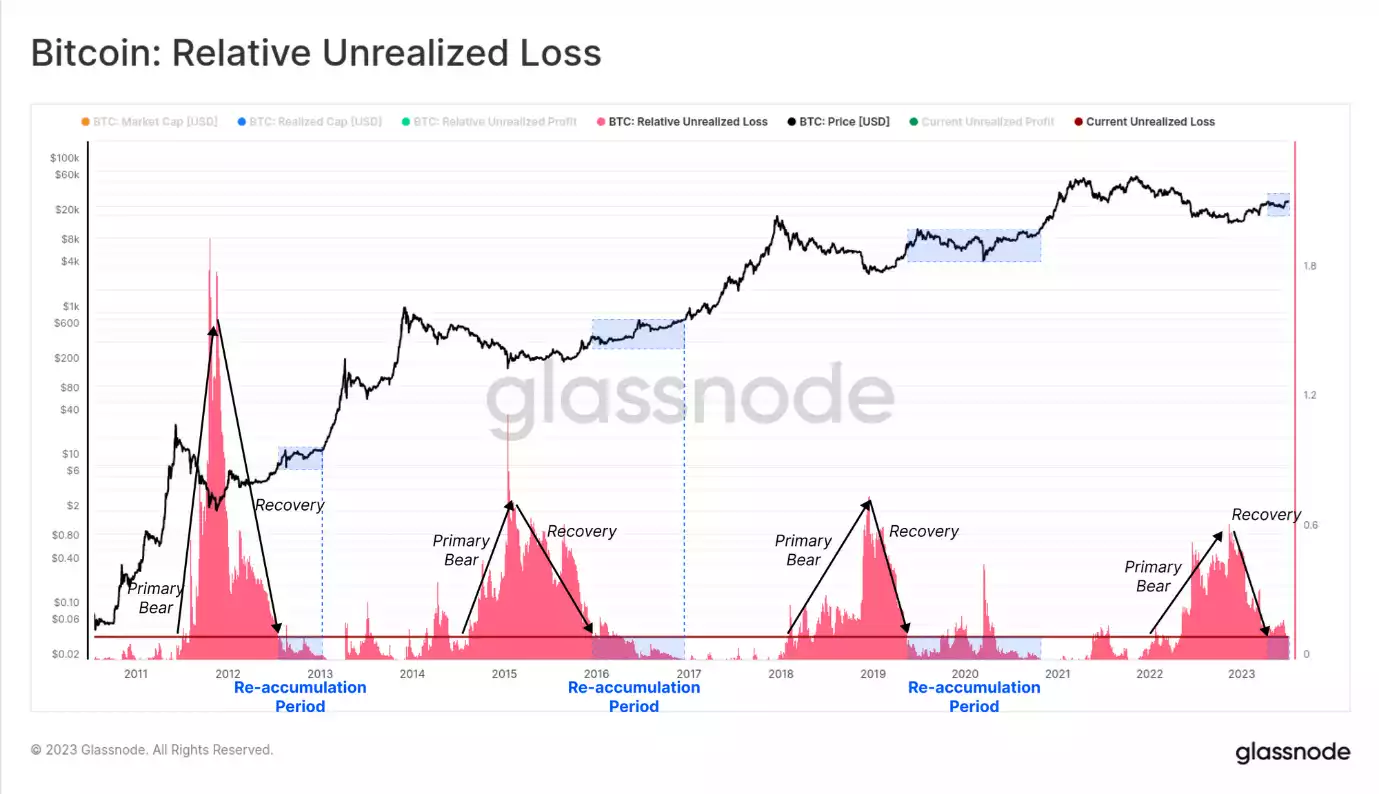
The cryptocurrency market is currently consolidating below the $30k ‘mid-point’, with about 75% of the total supply being in profit and 25% held at a loss. Interestingly, this 75:25 balance mirrors conditions seen during the mid-points in 2016 and 2019.
The 75:25 ratio of supply held in profit to loss can be considered an equilibrium point for Bitcoin. This equilibrium point takes time for the market to absorb and re-consolidate around. Bitcoin analysts often term this as the ‘re-accumulation period’, which typically occurs around the Bitcoin halving event.
Conclusion
Bitcoin’s current market state paints an interesting picture. Here are the key points to take note of:
- Bitcoin is currently in a consolidation phase, with prices trending below the $30,000 mark. This value marks the midpoint of the 2021-22 cycle. This consolidation is not an unusual occurrence. Similar patterns have been observed in previous cycles and represent a period of balance and equilibrium often referred to as the ‘re-accumulation period.’ During such periods, there is typically little macro direction for several months.
- Despite this period of consolidation, Bitcoin has demonstrated impressive resilience. Its Year-to-Date (YTD) performance remains robust, with the maximum drawdown so far being only -18%. This shows the enduring appeal and stability of Bitcoin even in times of market fluctuations.
- One notable trend has been the slowdown in on-chain activity for Bitcoin. This has been largely driven by a decrease in Inscription activity. The Inscription activity had seen a massive increase due to the advent of ordinals and inscriptions on Bitcoin. However, as the novelty of these features wears off, their usage is seeing a decline, resulting in a slowdown in on-chain activity.
- In contrast to the slowdown in on-chain activity, monetary transfer volumes on the Bitcoin network are showing an uptick. An increase in these transfer volumes is a positive sign, often associated with growing liquidity and increased adoption of the cryptocurrency. This suggests that despite the decline in Inscription activity, the overall use of Bitcoin for transactions continues to increase, indicating a healthy and thriving Bitcoin ecosystem.
Remember to subscribe to this newsletter and follow us on social for regular updates on the dynamic world of blockchain and cryptocurrency. If you’re interested in an easy and personal way to buy/sell/swap cryptocurrency, don’t hesitate to contact us – call 1800 AINSLIE. Our team of friendly consultants are ready to guide you, your company or SMSF through the process, making your cryptocurrency buying journey effortless. We also offer industry-leading crypto custody with minute-by-minute internal audits to guarantee the safety of your assets.
Share this Article:
Crypto in your SMSF
Top Movers
Get Started Trading Crypto with Ainslie.
Join Thousands of satisfied customers who trust Ainslie for their cryptocurrency and bullion needs.


