Bitcoin Aggressive Sell-Off – Is This Normal?
August 6, 2024
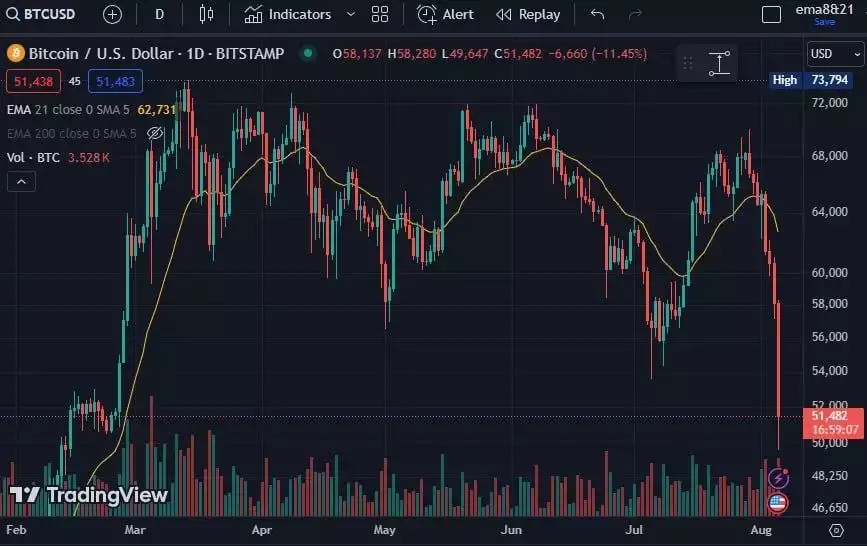
On Monday, Bitcoin surprised the digital assets market with a trademark move – a rapid decline, posting a -13% 24-hour candle. From all-time highs of approximately US$73k in March, to just below US$49k, we discuss whether this is the end of Bitcoin’s run or just a textbook Bitcoin bull market drawdown…
The recent sharp drop in Bitcoin’s price, although alarming, is not unprecedented. Similar declines have occurred multiple times throughout Bitcoin’s history, particularly during previous bull markets.
Bitcoin is known to have -33% drawdowns during its run-ups to all-time highs. The behaviour is repeated during the 2017 and 2021 bull markets:
2017 Bull Market:
- September 2017: 37% drawdown, recovered to new highs in ~2 months.
- November 2017: 40% drawdown, recovered to new highs in ~1 month.
2021 Bull Market:
- April – July 2021: 53% drawdown, recovered to new highs in ~4 months.
This begs the question, how about this time? Well, charts speak a thousand words. As shown below, Bitcoin is currently experiencing a significant drawdown…

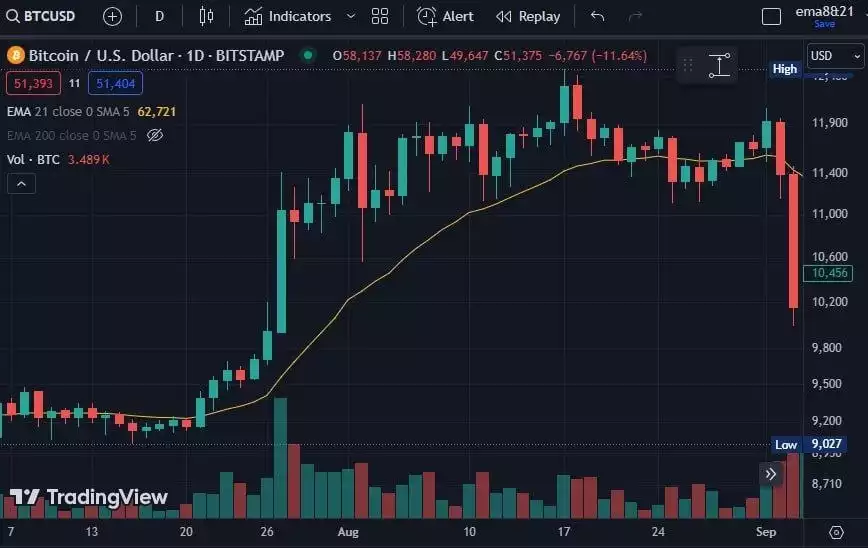
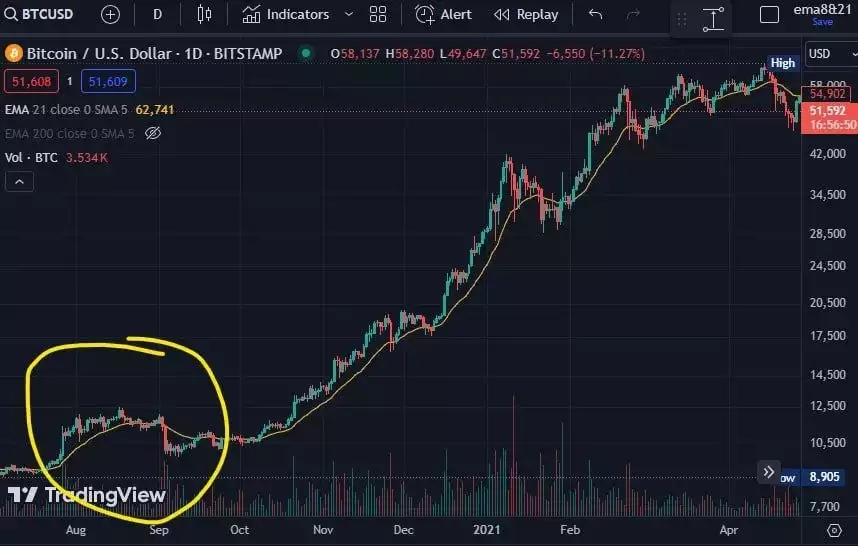
A similar trading pattern occurred in 2021 when Bitcoin underwent a rapid decline…

…followed by a 7-month-long rally.

Will Bitcoin post new highs in the next 1-4 months? Time will tell, but history suggests what is ahead.
With wobbles (putting it lightly) in traditional markets coinciding with Bitcoin’s retracement (-9%~ in S&P500 and -13%~ in Nasdaq – down into crash-like territory) and VIX hitting records, many are anticipating a response from global central banks to stem the bleeding.
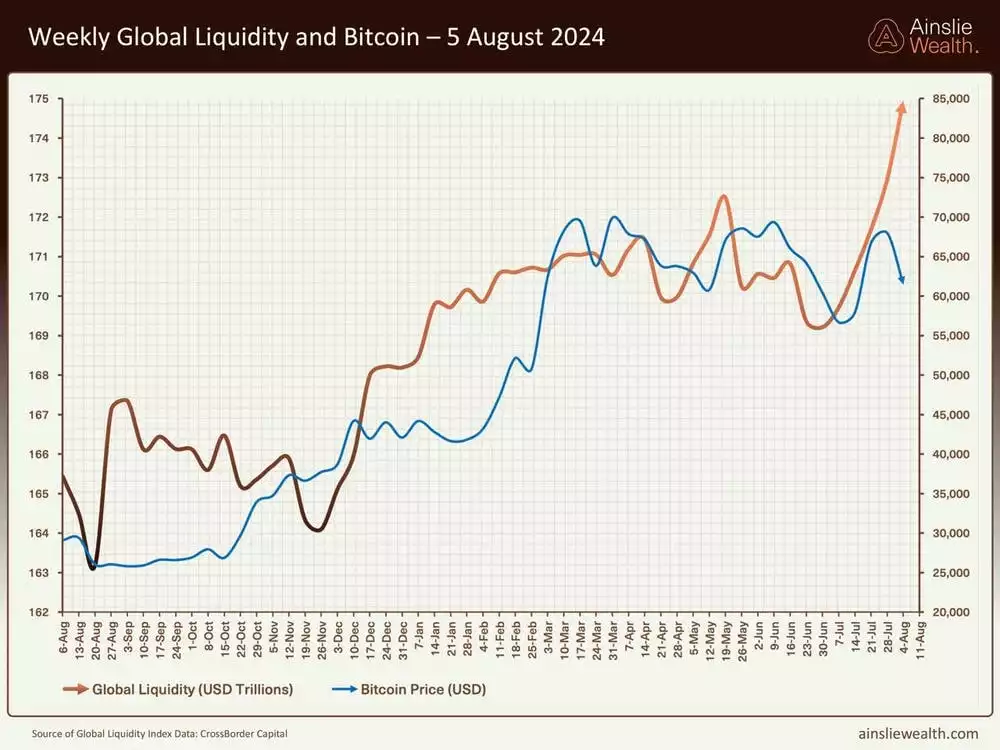
Arguably, this has begun already, as demonstrated by our Global Liquidity Weekly Chart…

As you can see, the Bitcoin and Global Liquidity lines have been positively correlated, only bucking the correlation this last week. Given the historical correlation between these two data points, one of two things can happen;
- Financial assets (Bitcoin) are leading, and we will see global liquidity decrease over the coming weeks, or
- Central banks cut rates, pump liquidity (stem the bleeding) and financial assets (Bitcoin) will ‘re-correlate’ themselves to the global liquidity line.
Ask yourself which of these two outcomes is more likely.
Share this Article:
Crypto in your SMSF
Top Movers
Get Started Trading Crypto with Ainslie.
Join Thousands of satisfied customers who trust Ainslie for their cryptocurrency and bullion needs.


