Bitcoin Analysis: Beyond the Block – November 2024
November 21, 2024
Today the Ainslie Research team brings you the latest monthly update on Bitcoin – including the Macro fundamentals, market and on-chain technical metrics and all the other factors currently driving its adoption and price. This summary highlights some of the key charts that were discussed and analysed by our expert panel. We encourage you to watch the video of the presentation in full for the detailed explanations.
Bitcoin and Global Liquidity
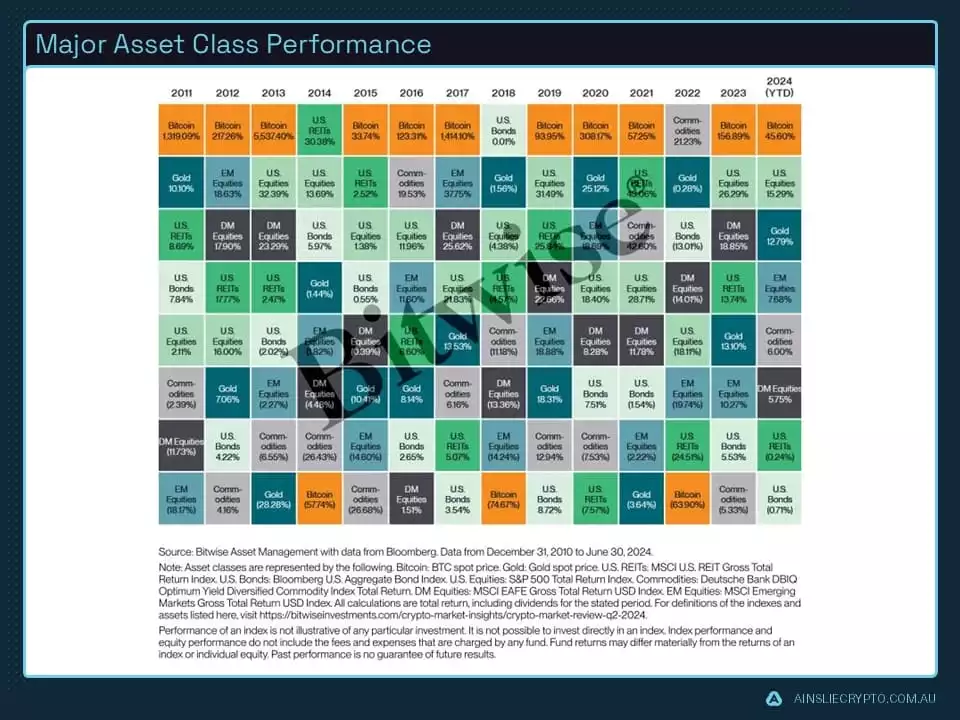
Bitcoin is the most directly correlated asset to Global Liquidity. Trading Bitcoin can be thought of as trading the Global Liquidity Cycle, but with an adoption curve that leads to significantly higher highs and lows each cycle. As such we look to buy Bitcoin during the ‘Bust’ phase or liquidity low, then rotate out of it during the ‘Late Cycle’ where liquidity is over-extended and downside protection is required (our preference is to rotate into Gold). When correctly timing and structuring the rotation, it is possible to significantly outperform ongoing monetary debasement. The Bitcoin cycle low was in November 2022, and since then the returns have been unmatched by any other major asset.
Where are we currently in the Global Macro Cycle?
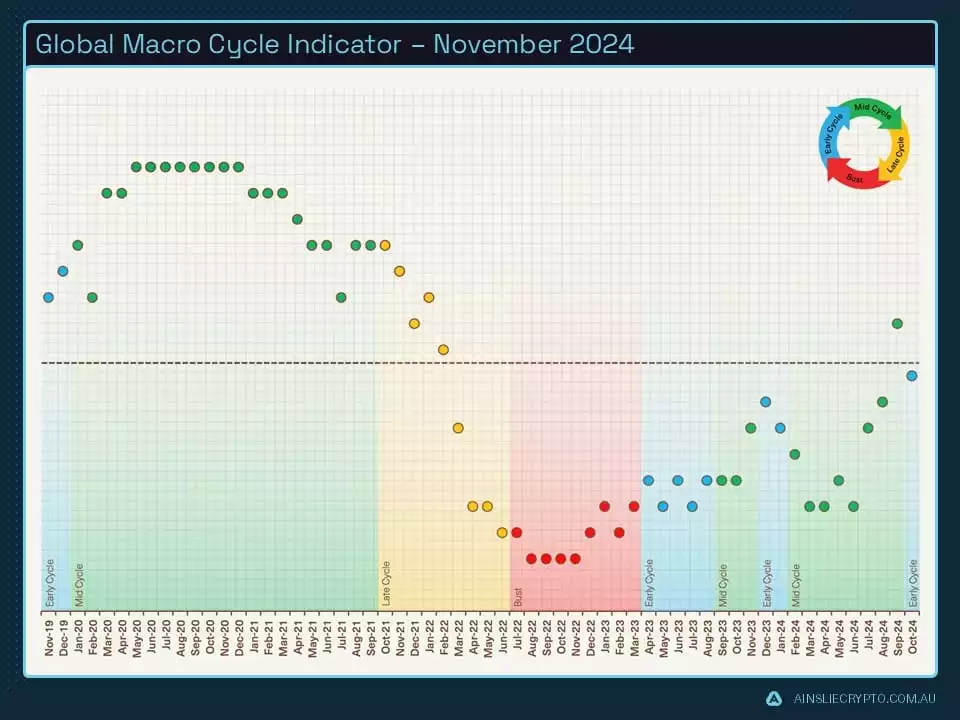
November presents us with some volatility in the Global Macro indicator. Last month we firmly believed we were transitioning into ‘Mid cycle’ however we have now slipped back into ‘Early cycle’. This is not necessarily a bad thing since it is telling us we are earlier in the cycle than we otherwise thought, asset allocation doesn’t change and is still risk on. The Global Macro Indicator is now sitting neutral halfway through a full cycle. By our best estimate, moving into the ‘Late cycle’ which is a risk off environment will occur somewhere in mid to late 2025, possibly 2026 if it is an extended cycle.
U.S. economic growth, as measured by the ISM data, is a useful tool to forecast the trajectory of the economy moving forward. When the economy starts to expand, businesses sell more goods and services to consumers which leads to more hiring and an increase in employment and wages. Those employees now have more money to spend on the economy which becomes a virtuous cycle for economic expansion.
Post-election, small, medium and large businesses now have clarity around how they are going to operate going forward. Trump is very ‘Pro Business’ with promises of tax cuts, deregulation and onshoring of manufacturing via tariffs.
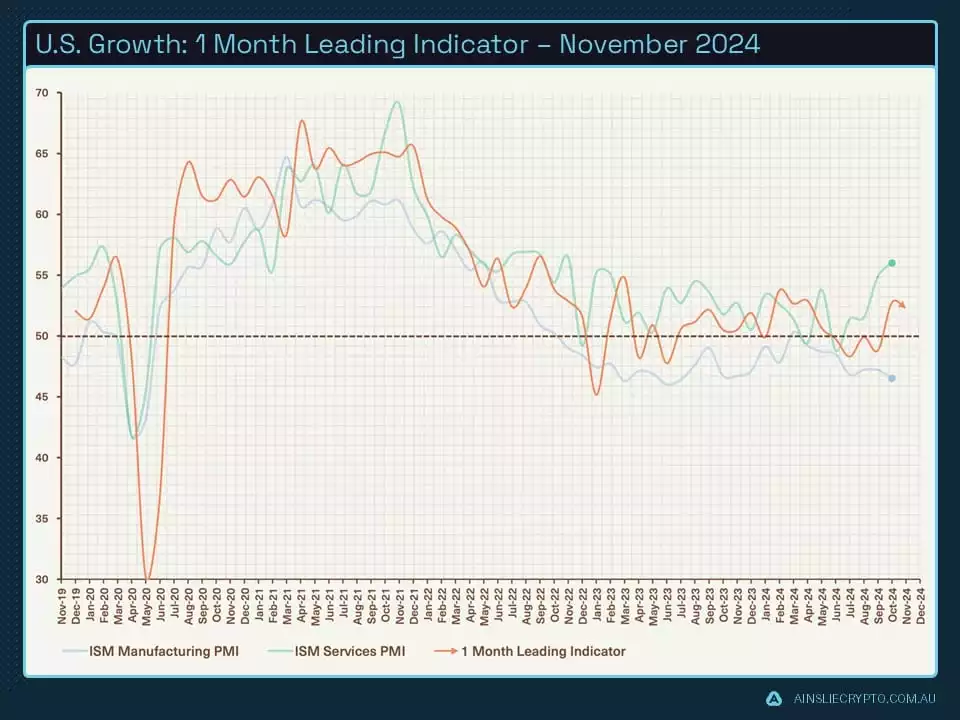
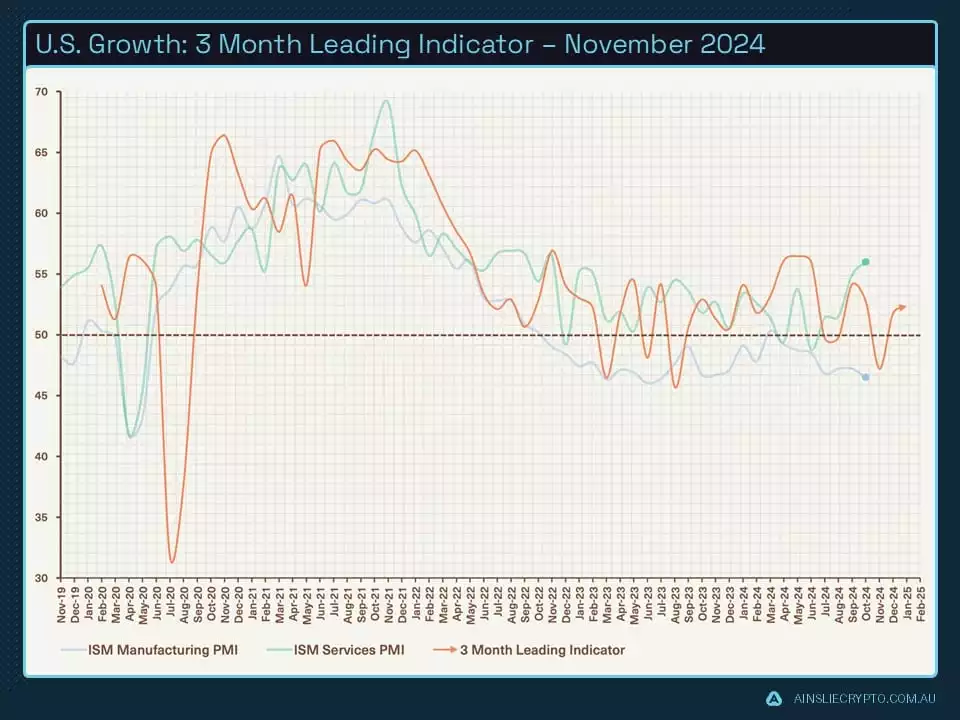
With that being said, we continue to expect manufacturing to have a strong move into expansion in the coming months as business confidence builds around pro-business legislation. Services like last month continue their march higher with no sign of slowing while also dragging up our lead indicator.
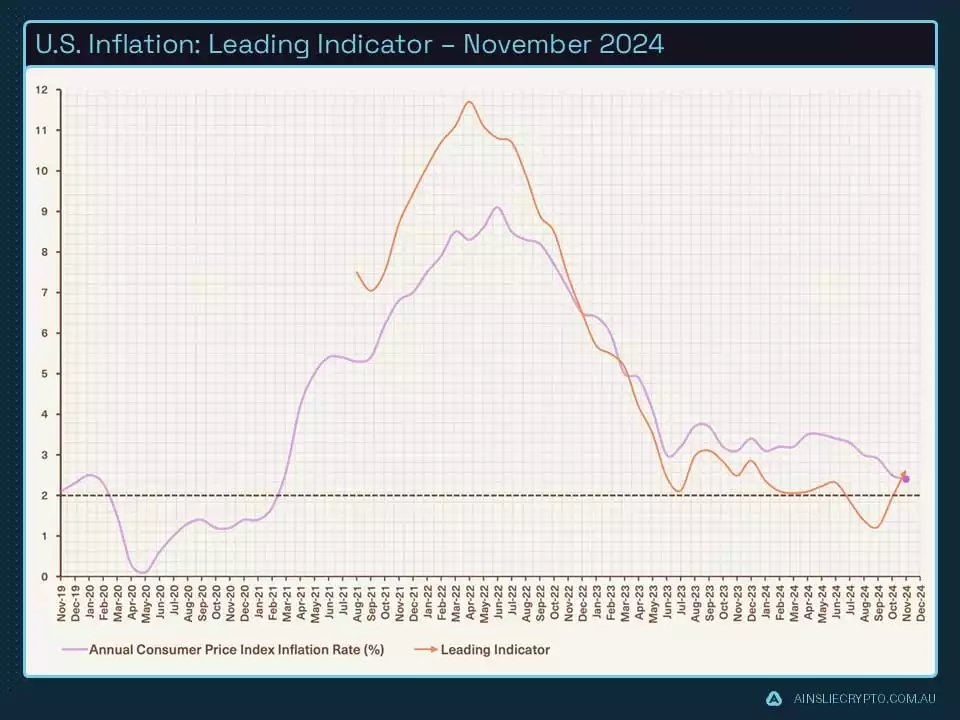
One thing about pro-business and growth policies is inflation will more than likely start to tick higher over the course of the economic expansion. We don’t expect the inflation cycle of 2021 and 2022, though we do expect inflation to stay above the historical benchmark of 2%. Inflation bottomed in September and has been turning up ever since, along with growth rising, these 2 data points validate our Macro Indicator which is teetering on ‘Early’ and ‘Mid’ cycle. Expect higher growth and inflation over the next year as we transition into the ‘Late cycle’.
Where are we currently in the Global Liquidity Cycle?
Global Liquidity leads the movement of World financial assets, so this is the indicator we look most closely at to determine where the opportunities are to take advantage of Bitcoin’s cycles.
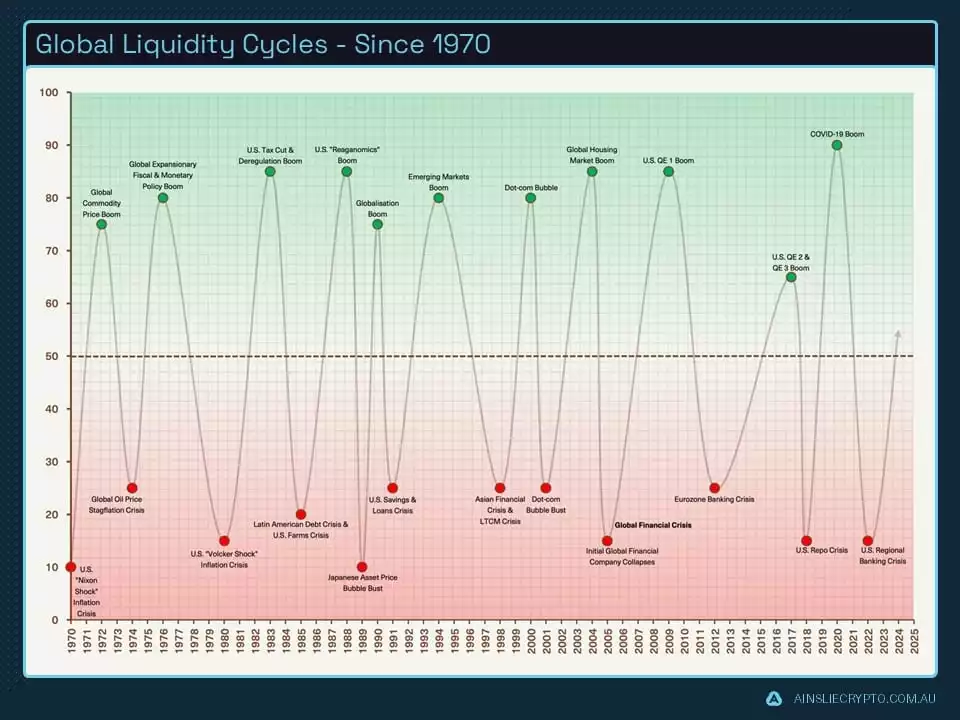
A historical illustration of Global Liquidity cycles since 1970 shows the ebbs and flows of liquidity and its impact, both positive and negative on financial markets. When liquidity is scarce, currency, banking and sometimes financial crises can follow. On the other hand, when liquidity is abundant, global markets experience asset booms.
Governments and central banks, rightly or wrongly try to smooth the business cycle by adding liquidity during deflationary busts and removing it during asset price booms. We would argue they are failing at their mandate of ‘smoothing’ the business cycle, though it does present opportunity when trading assets such as Bitcoin.
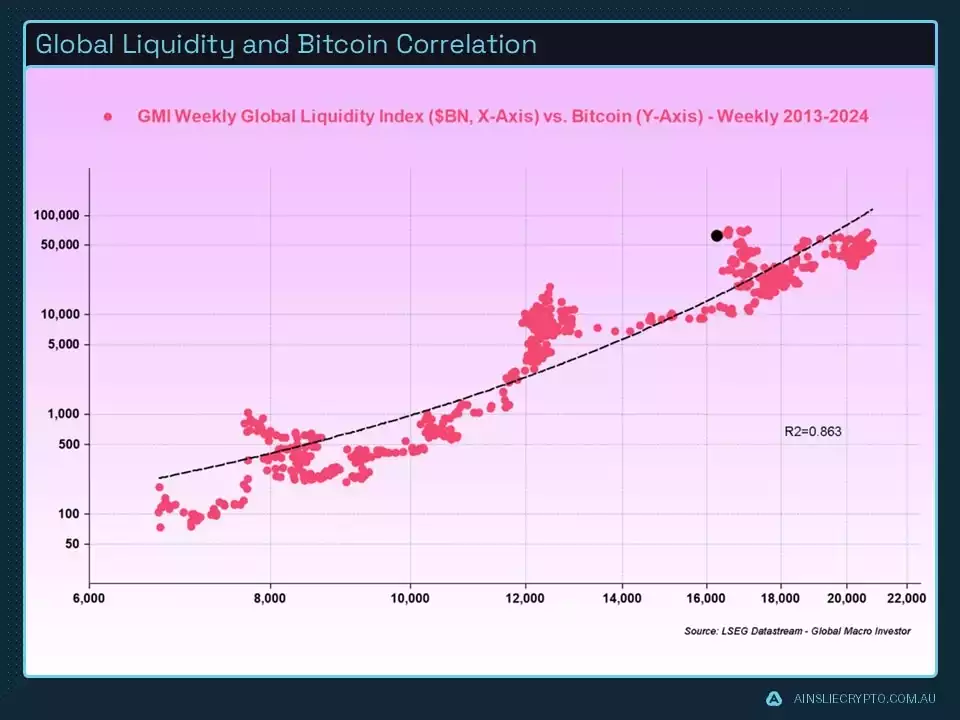
While on the topic of liquidity correlation to booms and busts, the dot plot below shows why understanding liquidity and its direction plays a pivotal role in our analysis. Bitcoin itself has an R2 correlation coefficient of 0.863 which is extremely high and only exceeded by the Nasdaq 100. Arguably, Bitcoin would have a higher coefficient if it wasn’t for the extreme moves to the upside when liquidity is abundant, and large drawdowns when liquidity is scarce.
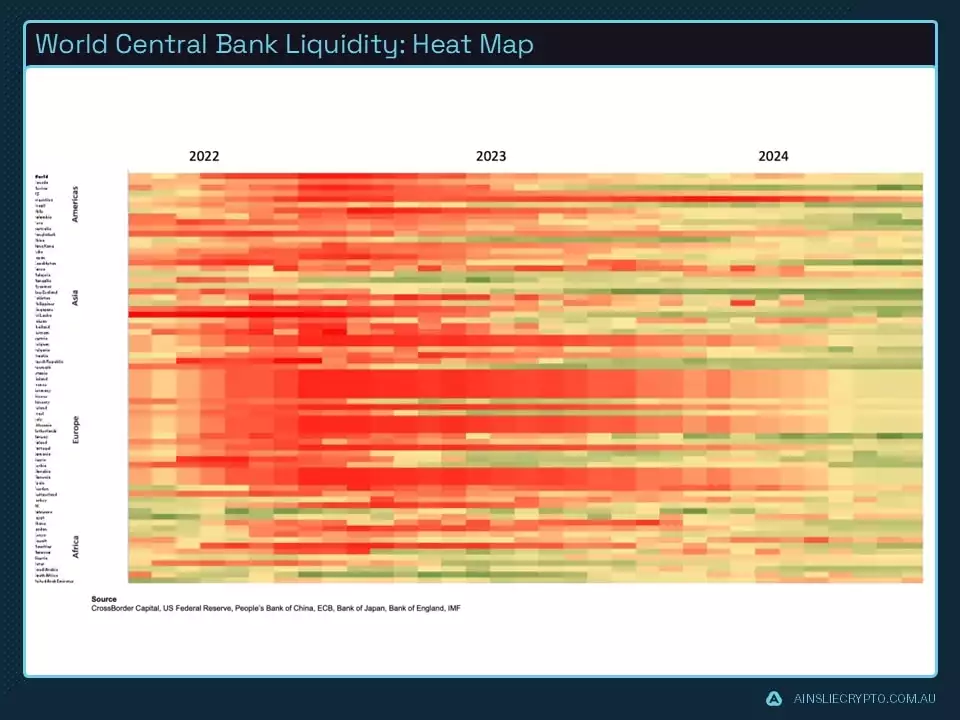
The percentage of Central Banks easing has continued from last month which is again showing up clearing in our liquidity heat map. We forecast that Central Banks will continue to lower rates and provide liquidity injections in one form or another for the foreseeable future.
This is an opportune time to remind our readers that Central bank balance sheets and interest rates are not the be-all and end-all of the Global Liquidity index, particularly in a world of fiscal dominance over monetary. Though it certainly provides an indicator of intent from officials going forward.
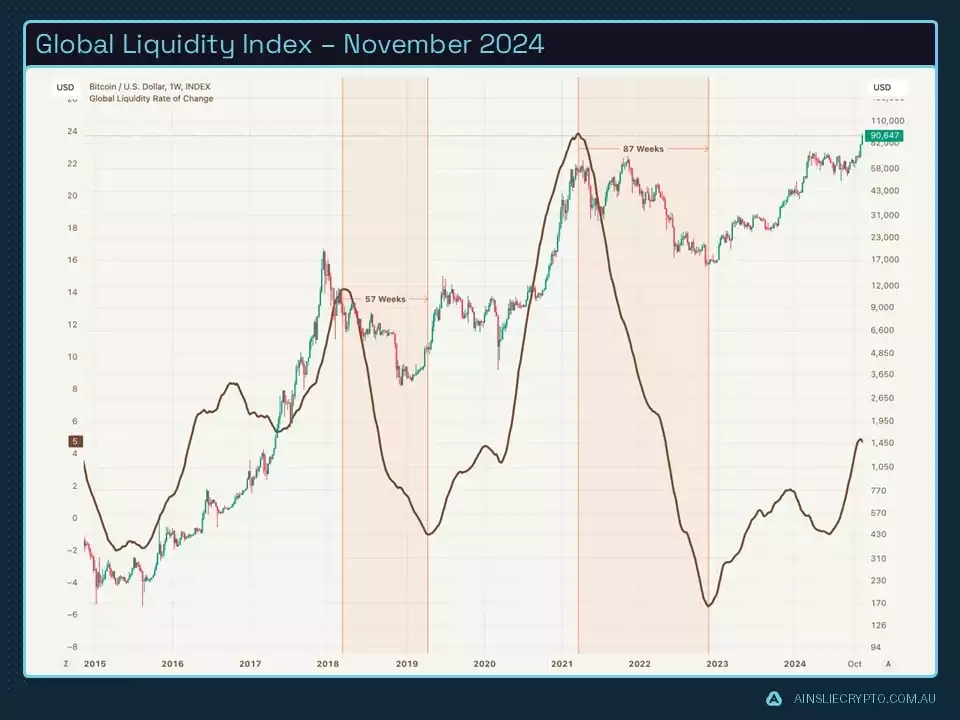
Our Global Liquidity Rate of Change has seen a slight dip after rising significantly over the past few months. Like anything in markets and nature, nothing moves in a straight line. The positive news is we still have quite a significant amount of time before we believe this indicator rolls over, liquidity momentum will play a pivotal part in getting out near the top.
Our final macro chart for this month shows the alligator jaws not just closing but crossing over as Bitcoin appreciates and liquidity drops. We expect Bitcoin to maintain strength here while a pick-up in liquidity is likely to occur in the coming weeks as bond volatility moves lower along with the USD strength.
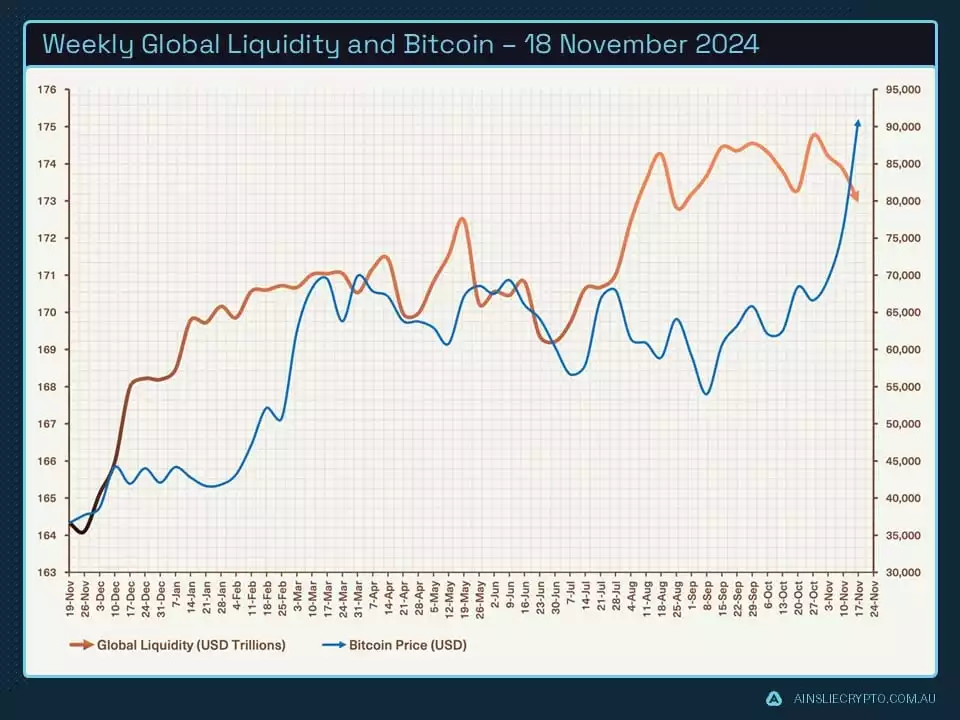
The ‘Trump trade’ in full effect
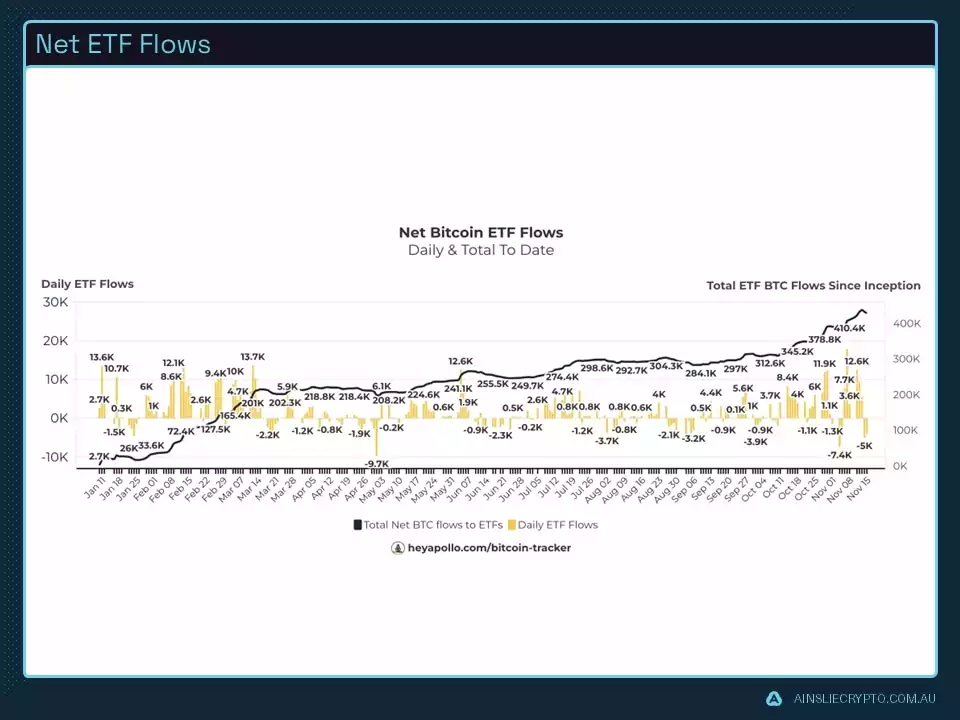
We’ve been saying for several months that ETF flows would explode once Bitcoin breached an all-time high and that’s exactly what happened when it became apparent there would be a ‘Red sweep’ for the Republican party.
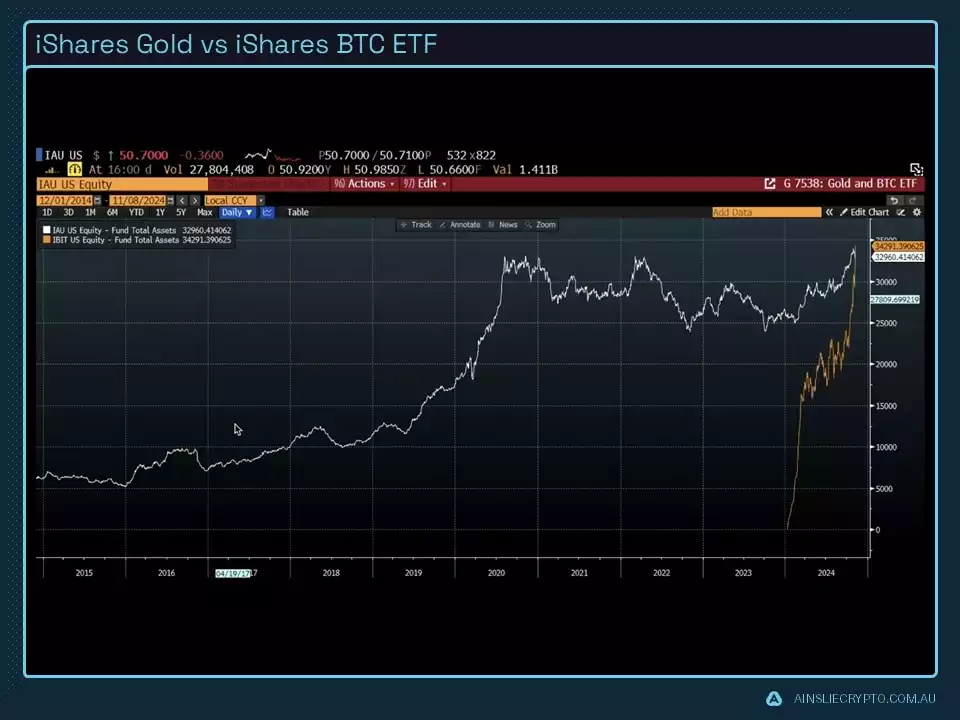
An amazing comparison between BlackRock’s Gold ETF launched in 2005 versus their Bitcoin ETF launched at the start of 2024. The iShares BTC ETF has now surpassed gold in terms of assets under management in less than 1 year with no signs of slowing.
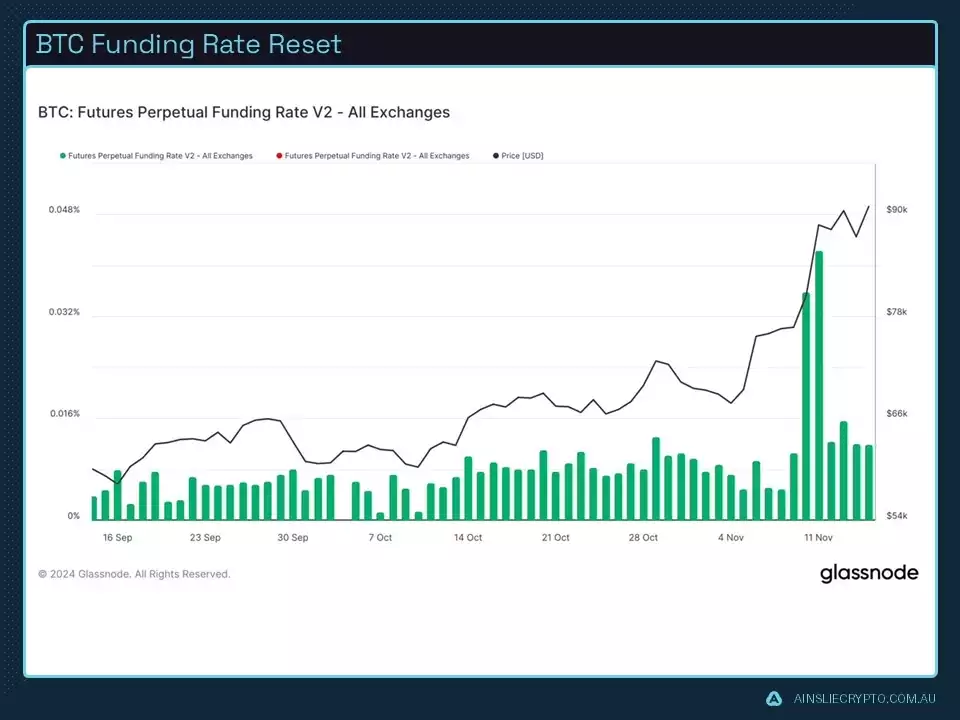
Funding rates are an excellent indicator of market position and sentiment. Once Bitcoin broke an all-time high funding rates exploded which was to be expected. Since then, the market has cooled off with funding rates dropping back to somewhat normal levels, ready for the next leg higher.
Zooming out, it is fair to say we are seeing a pattern emerge with Bitcoin being the number one asset to hold 3 out of every 4 years. In the fourth year, which happens to align with the ‘Bust’ phase in our Macro indicator, we want to have minimal allocation to Bitcoin. However, for now, 2025 is shaping up to be another fantastic year for Bitcoin, at the very least the first half of the year.
Something that may not come to pass initially, but is certainly an indicator of how the next administration thinks about Bitcoin adoption is s.4912 – Bitcoin Act of 2024, written by Republican Senator Cynthia M. Lummis. She plans to have this legislation introduced and passed within the first 100 days of the Trump presidency. Key points within the legislation are:
- Proposes a US Strategic Bitcoin Reserve to strengthen the dollar and maintain crypto leadership.
• The proposal includes acquiring 1 million Bitcoins over five years and using Federal Reserve remittances to fund the program.
The full Bill can be read here https://www.congress.gov/bill/118th-congress/senate-bill/4912/text
In addition to this bill, the repeal of ‘SAB 121’ which passed the House and the Senate, but was vetoed by President Biden earlier this year, would have allowed banks to hold Bitcoin without penalising their balance sheet, can now be resubmitted with a much better chance of passing now the Republicans have full control of the government.
Conclusion
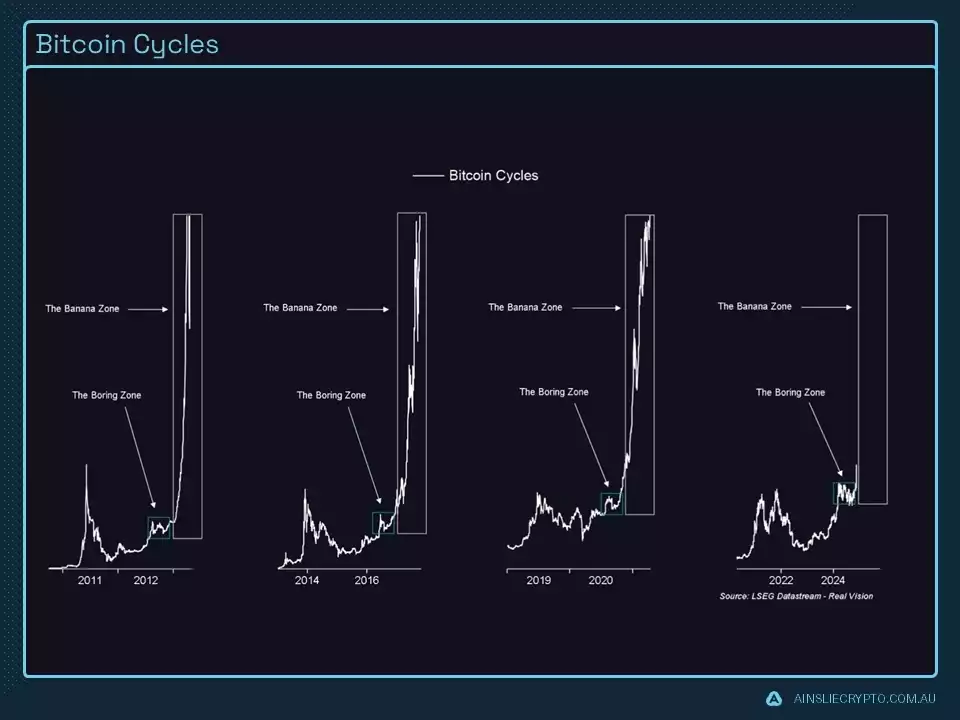
Finally, we enter the zone of the yellow fruit ripening. That’s right, the banana zone! This is the fun part of the cycle where the fastest price appreciation occurs, and everyone starts to lose their minds after months of consolidation. Our regular readers know that we have been calling for bullish price action in Q4 for a while now and everyone’s Bitcoin bags should already be loaded.
It will not be a straight line up, and expect drawdowns of 15-20%, possibly more which are great times to add if you have a long-term investing horizon. Remember it’s ok to take ‘lifestyle chips’ off the table as your portfolio grows, that may include paying down debt or simply starting a ‘rainy day’ fund. Regardless, we look forward to seeing you all in January for our next update.
Until then, enjoy the ride!
Watch the full presentation with detailed explanations and discussion on our YouTube Channel here:
Until we return with more analysis next month, keep stacking those sats!
Joseph Brombal
Research and Analysis Manager
The Ainslie Group
Share this Article:
Crypto in your SMSF
Top Movers
Get Started Trading Crypto with Ainslie.
Join Thousands of satisfied customers who trust Ainslie for their cryptocurrency and bullion needs.


