
Bitcoin Analysis: Beyond the Block – Aug 2026
August 14, 2026
News
Today the Ainslie Research team (ainslieresearch.com) brings you the latest monthly update on Bitcoin, including the Macro fundamentals, market and on-chain technical metrics and all of the other factors currently driving its adoption and price. This summary highlights some of the key charts that were discussed and analysed by our expert panel. We encourage you to watch the video of the presentation in full https://www.youtube.com/watch?v=BitctCZrytE for the detailed explanations. The setup this month is important to name up front. July CPI printed exactly on consensus with headline at 3.4 percent year on year and core at 2.5 percent, and yet the 10 year Treasury auction the same day cleared at 4.683 percent, the highest yield on a 10 year auction since 2007. The July budget deficit came in at US$432 billion, a record for the month of July. Something is happening in the plumbing that the inflation print alone does not explain, and that is one of the threads we pull on below.
Bitcoin and Global Liquidity
Bitcoin is the most directly correlated asset to Global Liquidity. Trading Bitcoin can be thought of as trading the Global Liquidity Cycle, but with an adoption curve that leads to significantly higher highs and lows each cycle. As such we look to buy Bitcoin during the ‘Bust’ phase or liquidity low, then rotate out of it during ‘Late Cycle’ where liquidity is over extended and downside protection is required (our preference is to rotate into Gold). When correctly timing and structuring the rotation, it is possible to significantly outperform ongoing monetary debasement. The Bitcoin cycle low was in November 2022, and since then Bitcoin has outperformed every other major asset class, including equities, gold, bonds, and commodities.
Where are we currently in the Global Liquidity Cycle?
August’s written note picks up where last month left off. If you follow the podcast side of Beyond the Block you already know we hammer the same themes for weeks at a time, and the reason is simple. Liquidity does not care about our calendar. It grinds for months, then turns, then runs for many months more. That means the harder job is not calling the low to the day. The harder job is being ready to move when it turns, which is why we spend so much time going through the same charts.
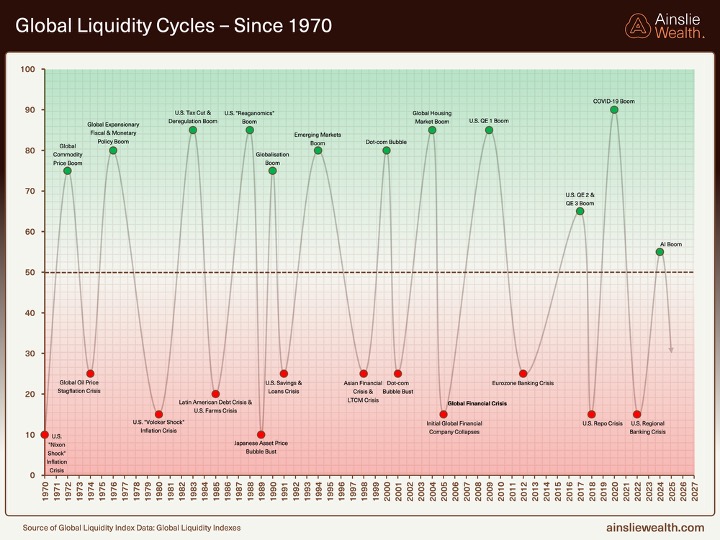
The message this month is not that anything has changed. It is that the picture we drew last month has hardened. Bitcoin is essentially unchanged at around US$64,000. The monthly Global Liquidity Index has now delivered four consecutive lower prints. We are inside the rollover, not waiting for it, and that changes what we should be doing. We are not trying to catch the next leg up, because there is not one. We are sitting tight while the low forms and staying ready to lean in when the fuel returns. If you go all the way back to 1970 the shape does not change. The cycle expands and contracts around the same 50 line under whichever narrative was hot at the time. Reaganomics, dot com, QE, COVID, and now AI. Different labels, same rhythm, and this rhythm has now aged into its late innings.
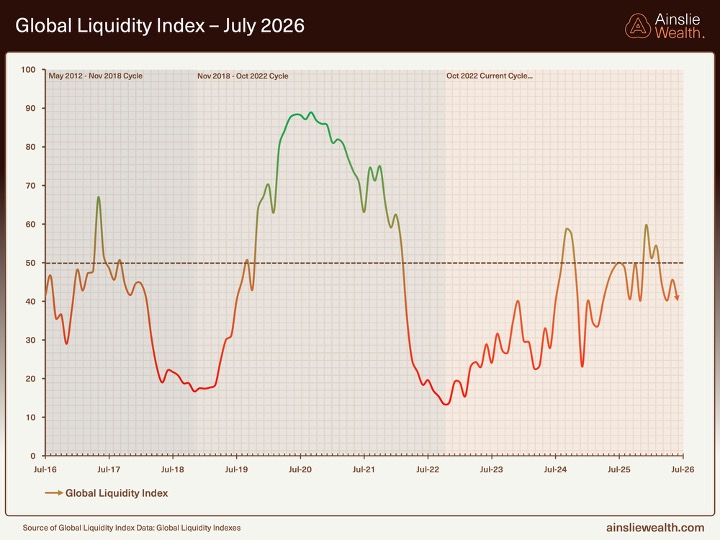
The past decade tells the same story at higher resolution. Look at where the weakness is coming from this month and it is unambiguous. The central bank sub index has dropped to 45.8, from 54.7 in the prior print. That is a single month move of almost nine points and it is the largest drag inside the composite. Advanced Economies sit at 42.9. The headline monthly GLI has held at 40.0, roughly in line with last month, and comfortably below the 57 print at the last peak. Every previous rollover in this series has looked exactly like this on the way down, and every previous rollover has been resolved lower before the next real up leg starts. The bottom has not yet arrived.
Where does the trough actually land? We are not going to pin a number on it. The last cycle bottomed near 15 in late 2022 and that is where we bought. This cycle might bottom at 15, or 20, or 25, or it might undershoot on a panic. The exact number is not the point. What matters is the timing, and the recent modelling still puts the low somewhere in mid to late 2027, which is consistent with the 65 month bottom to bottom rhythm we have been walking through all year. That is the road map. From here the path of least resistance for the index is down, and planning for the environment we are actually in rather than the one people want beats every version of hope.
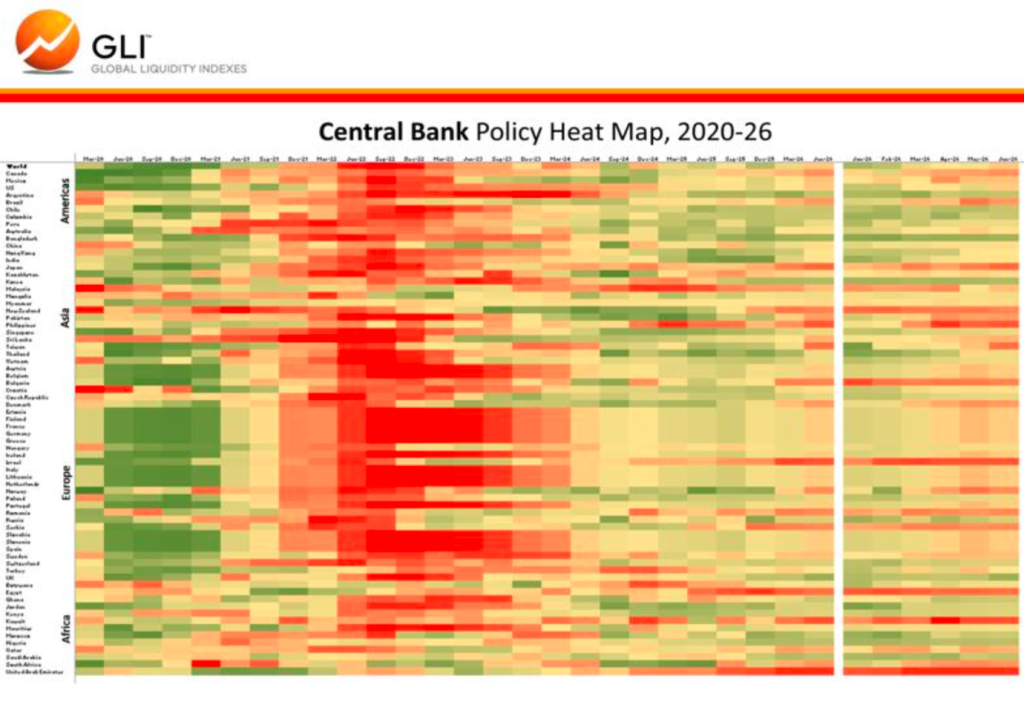
If you only get to look at one chart from this month’s report, make it the Central Bank Policy Heat Map. It is the piece that explains why the composite is rolling over even though nothing in the mainstream news feels particularly dramatic. Across the Advanced Economies the map is a wall of orange and yellow. That is the signature of central banks that are either neutral or actively pulling liquidity out of the system. The Bank of Japan sub reading is around 26, sitting at the very bottom of the pack, which is remarkable given how disorderly Japanese Government Bonds have been and how much intervention we might have expected by now. The Fed sub reading is around 46, still leaning restrictive rather than supportive.
Worth being crystal clear on what this map is measuring, because it is not what most people default to when they hear the word tightening. This is not about interest rate cuts and hikes. Rates can sit dead still for months while central bank liquidity keeps quietly draining out of the plumbing on the other side of the balance sheet. Quantitative tightening, reserve management, standing repo usage, and outright bond purchases or sales are where the real liquidity gets created or destroyed. Measured that way, about 16 percent of Advanced Economy central banks are easing right now against 61 percent across Emerging Markets. Emerging Markets are already leaning in. The Advanced Economies, which run the reserve currencies and the balance sheets that actually matter for global liquidity, are still not. Kevin Walsh has taken the Fed chair and the market is measuring him against Paul Volcker. His first FOMC on 29 July delivered exactly what the modelling flagged, no fresh balance sheet reduction, no dovish pivot, precisely the profile that fits this map. Any thesis that assumes the Fed shows up early with the printer has a problem. We called that risk last month and nothing has moved to soften it.
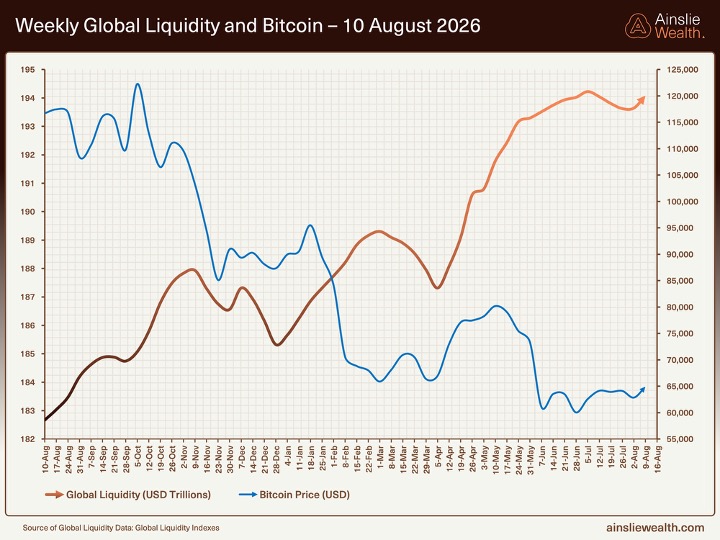
The weekly nominal series is the one built to fool you if you take it at face value. Total global liquidity is sitting near US$194 trillion, just off the July peak of around US$194.2 trillion, and the 12 month growth rate is still running near 6 percent. Those two numbers are what the headlines and the bulls point at. Now look at the deceleration underneath them. The 3 month annualised growth rate has slowed to around 3.9 percent, down from 5.6 percent a few weeks earlier, and the recent modelling flags this line as clearly peaking. The weekly series printed that peak in early July, rolled off through the rest of the month, and has only just bounced back toward it in early August without breaking through. This month’s daily flash update has taken the world Total Liquidity index down to 32.2, from 45.6 last month, and financial conditions down to 32.5, from 51.7. The weekly flash is not the locked in monthly print, but it is a real time precursor to where the monthly line is heading, and it is heading lower. Support is real. Fresh impulse is not.
The Shadow Monetary Base, which is the engine driving the nominal series, is sitting around US$109.5 trillion. On a 3 month annualised basis it is contracting at minus 5.7 percent. Read that again. The engine is running backwards while the headline number keeps setting records. That divergence is the trap. When the fuel is contracting and the top line is expanding, the top line is being carried by SLR tweaks, Treasury buybacks, and volatility suppression rather than by any organic money creation. This is a late cycle profile, not an early cycle one. And the regional daily flash prints only make it sharper.
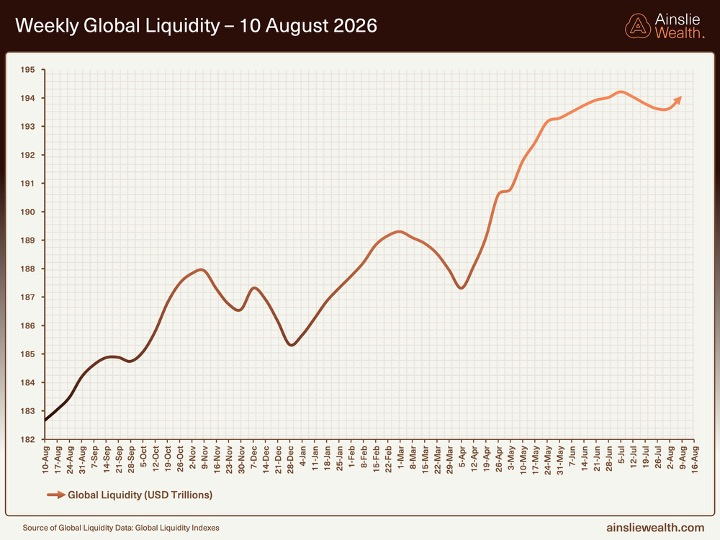
Do not trade the nominal line. Trade the momentum line. The GLI has now rolled from 57 to 40 across four consecutive monthly prints, and the daily flash reads are already pointing lower into the low 30s. Meanwhile Bitcoin at US$64,000 has already discounted a lot of the late cycle headwind we keep flagging, while the nominal liquidity line still has not followed, yet. That combination is what allows Bitcoin to drift sideways or lower for longer than most people expect, even as the top line chart is still sitting near its all time high. If your entry trigger is a strong weekly nominal liquidity print, you are reading the wrong indicator.
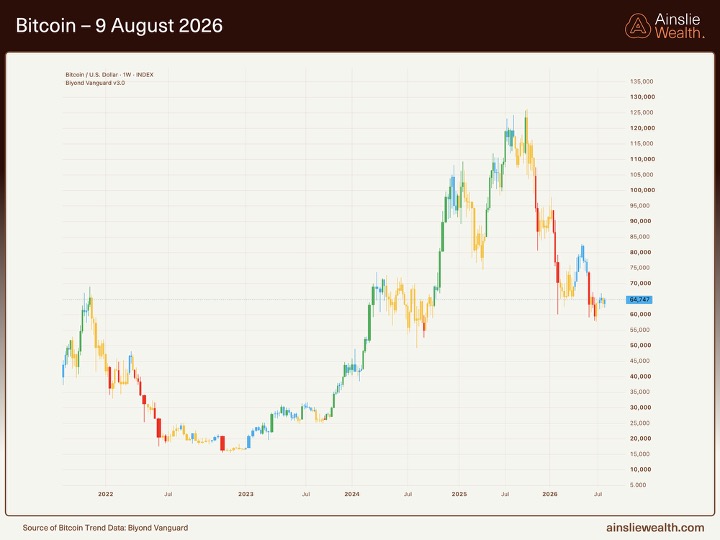
Turning to Bitcoin itself, price is trading around US$64,000, which is essentially the level we mapped out for right now this time last month. What matters more than the closing print is the colour of the candles on the Biyond model. The current candle has flipped back to blue, and we once again choose to ignore that blue candle because the GLI remains pointing down and every other read on the framework says we are still inside the rollover. This is not the first time the model has flickered blue during this leg of the cycle. Earlier in the year price ran into the low 80s and a handful of blue candles printed, and plenty of people read that as the all clear. We ignored those on the basis of the liquidity fundamentals underneath, and that call has aged well. Since then, the candles have chopped between yellow, red, and the occasional blue, and price has drifted sideways with a slight downward bias. That kind of colour chop is exactly what a late cycle Bitcoin looks like while GLI momentum keeps rolling. The colour tells you the regime, and the regime is still late cycle.
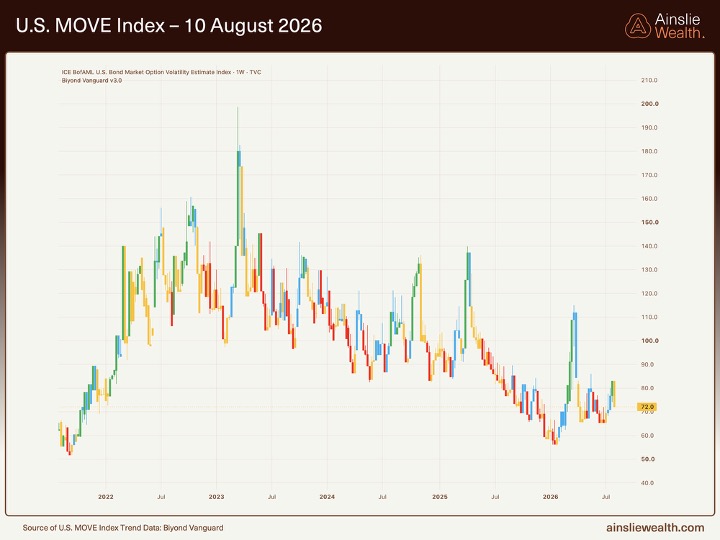
MOVE is the chart in focus again this month. It sits around 70, essentially flat on last month, and that flatline is deliberate. A ten-point move in MOVE is worth around US$2 to 3 trillion of global liquidity, or roughly a 1.5 percent swing in the GLI. Keeping MOVE pinned at 70 does serious work in the background even when the headlines look benign. And the tool doing the work is not a bazooka. It is a set of quiet plumbing operations that most people never see.
Here is what has been happening under the surface. The Fed ended quantitative tightening on 1 December last year. Eleven days later, on 12 December, it started the Reserve Management Program, buying Treasury bills at a starting pace of US$40 billion a month. That program is what has been holding volatility down since. The pace has been tapered as the year has progressed. From US$40 billion at the start, to around US$25 billion by April, to roughly US$10 billion at the latest read. The tap is not shut. It has been throttled back to about a third of where it started. Layer in coupon to bill issuance, buybacks, and eSLR reform, and the Fed and Treasury together have pushed roughly US$600 billion of front end support through the system since October. The program still running, but at a slower pace, is exactly the setting that lets MOVE drift sideways rather than compress further.
Add up what all of that means for the pipes. Bank reserves are hovering around US$3 trillion. By the Fed’s own research that is right around what they define as ample, not comfortably above it. We are not saying intervention is imminent, and we are not going to say that, because a system can sit near ample for a long time without anything breaking. What we are saying is that the buffer between calm plumbing and stressed plumbing is thinner than it was a year ago. Any material funding shock from here shows up first in MOVE and in cross currency basis before it shows up anywhere else.
Macro Indicators
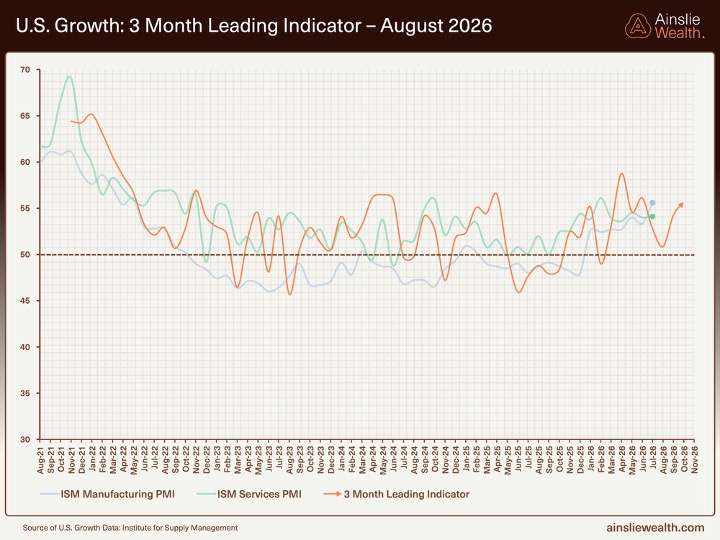
Our 3 month leading indicator on US growth held its ground this month rather than pushing higher. The composite is still above the 50 breakeven line, so this is not a recession call. But the shape of the line has turned choppy and is struggling to break higher, which is exactly what a late cycle expansion losing altitude looks like. Growth is still there. It is grinding, not surging. Underneath that composite the ISM Manufacturing internals for July are firmer than the top line suggests. New Orders at 56.7, Production at 58.5, Employment at 52.8, and Prices at 71.1. That last one, the price sub index, is the tell for where the near-term inflation risk still sits. The real economy is still absorbing liquidity through working capital, hyperscaler AI capital expenditure, and stubborn energy costs, and that absorption is part of why the financial market side of the liquidity index is the piece rolling over. Stronger commodities have been the confirmation.
This is exactly what a late cycle liquidity backdrop is supposed to look like. Deficit spending and the AI capex build are holding the real economy up, and both of those need ever larger doses of stimulus just to keep the composite above 50. Line that up against a 60 to 65 month cycle rolling over through 2026 and the picture snaps into focus. This is not a crash call for the real economy. It is a warning that the growth engine is running on borrowed fuel.
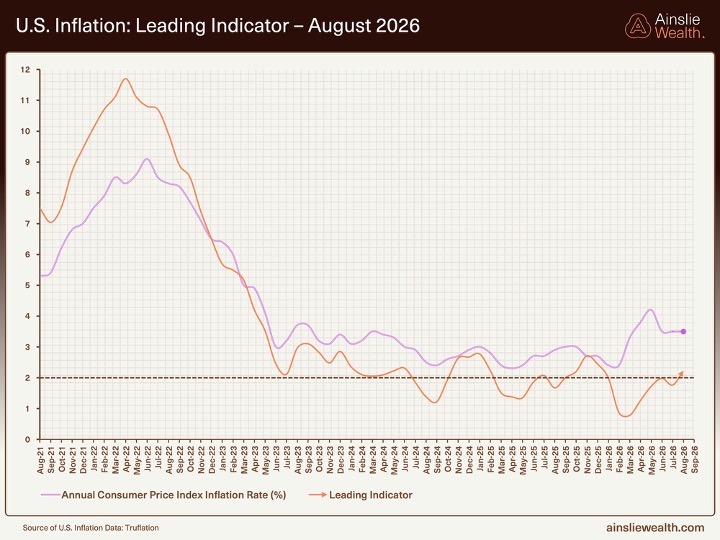
Truflation as a leading indicator has been pointing lower for a while and the official prints have finally started to reflect it. June CPI came in at minus 0.4 percent month on month with the annual rate slipping to 3.5 percent from 4.2 percent in the May release. Core CPI held flat on the month, with the annual rate at 2.6 percent, from 2.9 percent. Energy fell 5.7 percent and did most of the heavy lifting on the downside, though the softness was broad enough that bond markets rallied on release day. Long end yields have already crept back higher since, which means the market has faded most of that reaction. That fade is where the real signal sits, because it is telling you where the risk actually is.
Deflation is still doing quiet work underneath the surface. AI driven productivity gains, white collar repricing, and ongoing cost cutting are all stripping cost out of the system. But the recent modelling flags a nominal GDP based fair value for the US 10 year yield closer to 6 percent against the 4.68 percent the market is actually paying. That is a big gap and it is exactly the gap Walsh at the Fed appears to be responding to. He has kept the balance sheet where it is and made no move to lean against the long end. If he really is the hard money man the market thinks he is, the pivot most people are still waiting for is coming later and smaller than they expect, and the risk to bond yields is up rather than down.
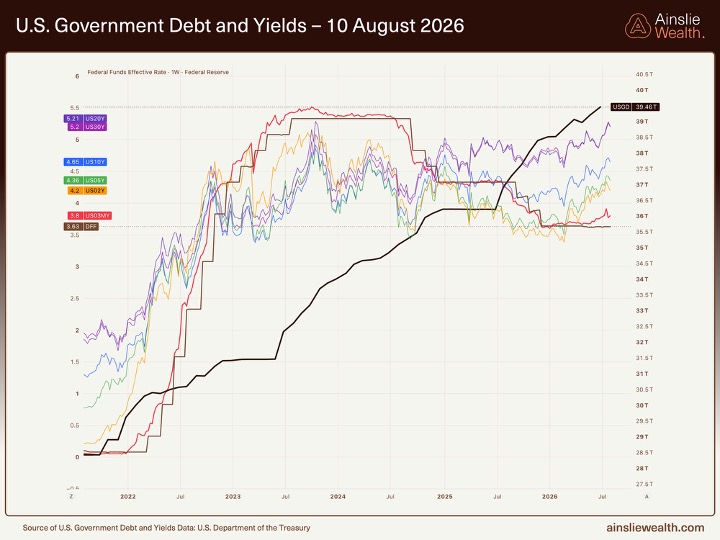
Some numbers on the fiscal side that keep getting bigger. US government debt is north of US$39 trillion. The last trillion was added in about six months, which puts the current run rate at somewhere around US$5 billion a day. A fresh trillion every six months, and neither political side is showing any real appetite to slow it down. Yields have followed. The 10 year is around 4.68 percent, up from 4.54 percent last month. The 30 year is around 5.24 percent, from 5.08 percent. The short end has stayed pinned as the front end swallows the rolling supply. Around 80 percent of US gross issuance now sits under 2 years in maturity. Treasury is rolling somewhere in the order of US$500 billion a week to keep the show on the road. For scale, France runs about 50 percent of issuance short, Germany 45 percent, and the UK and Japan closer to 25 percent. The US is far and away the most exposed to a jump in short end yields, and that is a lot of pressure to be sitting on a system that is already leaning on plumbing.
The refinancing picture is now bigger than the inflation picture. The 10-year auction on August 12 came in at 4.683 percent, the highest since 2007. The 30-year auction on August 13 was widely expected to print at the highest yield in around 25 years, and while the results were not in at the time of writing, even the pre-auction expectation tells you what the market was pricing in. This is not an inflation surprise, it is issuance pressure, and Treasury is already pulling every lever short of the Fed. Around 85 percent of gross marketable issuance is now in bills, the Fed is quietly absorbing roughly US$26.5 billion of T bills a month between Reserve Management Purchases and MBS reinvestments, and Treasury is running active buybacks in the belly. On July 31 the US even joined Japan in a rare, coordinated yen intervention, with the New York Fed selling euros for yen on behalf of Treasury, and Japan announcing use of the Fed FIMA repo facility so it can borrow dollars against its US$1.14 trillion of Treasury holdings without dumping them into the open market. This is not the behaviour of a system with a spare inflation problem. This is the behaviour of a system that must keep the front end absorbed at almost any cost. At 4.68 percent, the 10 year is still well below where the modelling says it should be, closer to 6 percent on a nominal GDP basis. The gap between what yields would be doing without all this plumbing and what they are actually doing tells you how much quiet suppression is already in the system.
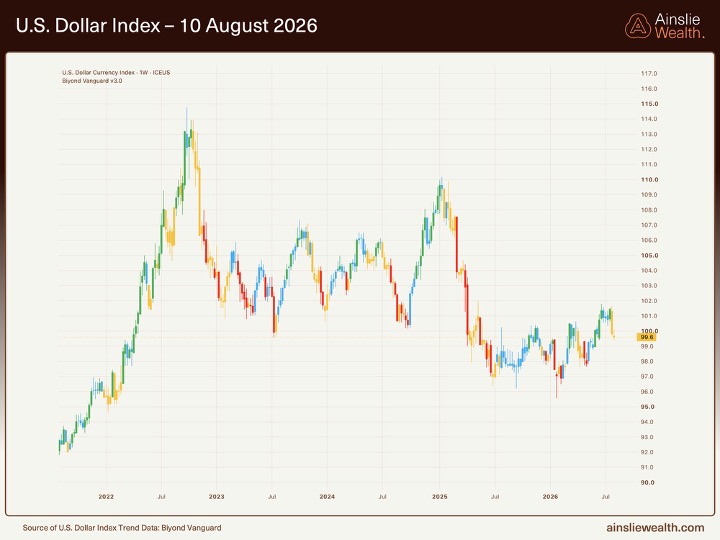
The US dollar is still the swing factor for global liquidity, and it is still carrying most of the load on the nominal numbers. DXY is trading around 99 to 100, right on the level we flagged last month as the line in the sand. The recent softness has come from yen intervention, with the Bank of Japan raising rates to defend a weakening yen. And even with that, the yen has kept sliding, which is a genuine currency problem rather than a temporary wobble. Interventions like this almost always fail. Base case is that DXY strength resumes from here as global liquidity keeps deteriorating.
Two levels matter on this chart. On the top side, 102 has capped every rally attempt for the past year. A clean break and hold above there opens up 105 as the next real ceiling, and after that the 110 area from the last cycle high. If DXY runs through 102 into the 102 to 105 corridor, that is the air pocket scenario for global liquidity, for Emerging Market risk, and for Bitcoin. On the bottom side, 99 is the level to watch. A weekly close below 99 begins to unwind the late cycle dollar strength narrative, and that would be a genuine tailwind for the rest of the year. Our lean is still to the firmer dollar side while global liquidity deteriorates, but the asymmetry both ways is why this chart earns its spot in the report.
The Bigger Picture
The macro backdrop is the reason we hold Bitcoin. How we hold it is a completely separate problem, and this month it landed on a lot of people. Coldcard is one of the most trusted hardware wallets in the space. If you searched “best hardware wallet” a week ago, it was at the top of the list, and the reason the hardcore crowd trusted it was because the code was open source and had been sitting out in the open for years. That did not save anyone. A bug in the way the device generated seed phrases quietly narrowed the entropy down to roughly one trillion possible combinations, and once modern AI compute was pointed at that problem the search space collapsed. Around 2,000 Bitcoin has been drained from something like 7,000 to 7,500 wallets so far, and the hunt is still active.
The important part is what did not break. Bitcoin itself was not hacked, the network was not hacked, and the cryptography was not hacked. What broke was one implementation, and it broke because it did not use the standard properly. A correctly generated 24-word seed has a search space so large that even in an AI world it is not brute forceable. The takeaway is not to abandon self-custody. The takeaway is that in an AI world, anything encrypted is going to face a level of scrutiny it has probably never been through, and Bitcoin holders are among the very few groups already thinking about this the right way. Where this leaves us is very simple. If you self-custody, do it properly, on a device and setup with a real entropy story, ideally with multi sig at scale, geographic separation of backups, and a written recovery plan a partner or executor could actually follow. Bad self-custody is worse than good third party custody.

This is the table we walked through on the podcast, and the point of it is that there is no one size fits all answer. Full self-custody with a hardware wallet gives you the keys and all the responsibility, no ongoing fee, and it is the correct answer for people with the technical skill and the discipline to run it. For everyone else, an Australian spot BTC ETF like Monochrome IBTC or VanEck VBTC is very easy through any local broker, held in institutional custody, at around 0.25 to 0.45 percent a year. Offshore US ETFs like IBIT are cheaper on fees but bring W-8BEN paperwork and US estate tax exposure over US$60,000. Exchange custody is the easiest to operate and the worst risk on the table, because in a failure you are an unsecured creditor of a bankruptcy estate rather than someone who owns their coins. And an Ainslie crypto storage account gives you segregated institutional cold storage under an AUSTRAC registered business with over fifty years of continuous operation, phone support, physical offices, and no ongoing storage fee.
Two things to keep in mind. First, the fee drag on ETFs looks small in any single year and compounds hard over a full cycle, so over a five to ten year hold you are handing over a real slice of your capital for the convenience. Second, most serious stacks are not held in one bucket. They are split across two or three depending on size, purpose, and estate structure. What you should not do is pick the option that is convenient today and pretend the failure mode does not exist. FTX taught the ecosystem that lesson at very high cost, and the current temptation to slide back onto exchanges because self-custody had a bad month is a short memory in action.

Zooming out and building on the accumulation argument. This chart is the Bitwise Q3 2026 study of what happens when a 5% Bitcoin sleeve is added to a standard 60/40 portfolio, rebalanced quarterly, over the full back test window. Every single three-year rolling period is positive. The median contribution is 15.23 percentage points on top of the baseline 60/40, the maximum contribution is 47.60 percentage points, and even the worst three-year window still added 2.66 percentage points. The win rate is 100 percent. And that is with the rebalancing rule forcing you to sell Bitcoin when it runs and buy bonds when they lag, which is exactly the wrong direction if you had perfect foresight. Even fighting the position, you have never lost by holding 5%.
5% is nothing. For an institutional investor running billions of dollars, a 5% sleeve is inside the noise of a normal quarterly rebalance, but the asymmetry it introduces is enormous. That is really what this chart is saying. You do not need to bet the farm to change the shape of the whole portfolio. What is genuinely strange is how many professional investment managers still ignore the single best performing asset of the last two decades in a portfolio construction conversation, when the historical answer to “how much” is now known and is not zero. If a client asks how much Bitcoin belongs in a diversified allocation, this chart is the answer.

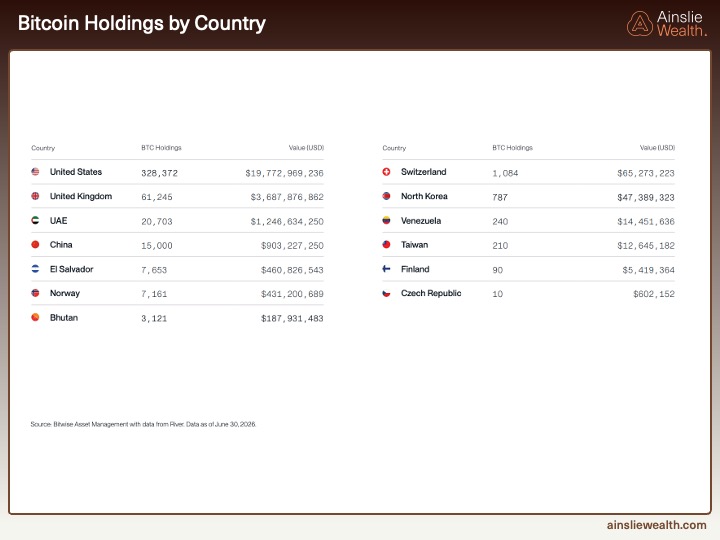
And it is not only investors. It is also countries. The United States sits well out in front with 328,372 BTC, close to US$20 billion at current prices. The United Kingdom is next at 61,245, the UAE at 20,703, then China at around 15,000, El Salvador at 7,653, Norway at 7,161, and Bhutan at 3,121. Further down the list are Switzerland, North Korea, Venezuela, Taiwan, Finland, and even the Czech Republic at 10 coins. This was a huge story twelve or eighteen months ago and it has been quietly forgotten because sentiment is poor, but the balances have not gone down. They have gone up.
The list is what matters. These countries disagree on almost everything, and they agree on keeping the Bitcoin. Reserve currency issuers, emerging market central banks, small strategic accumulators are all sitting on the same asset, which is exactly the shape you would expect from something transitioning into a monetary reserve. The absolute numbers are still tiny relative to what any of these treasuries could hold, well under one tenth of one percent of foreign reserve equivalents for the US position. If the framework is right and Bitcoin continues to move up the reserve stack over the next cycle, the sovereign bid has barely started.
Conclusion
Wrapping up, nominal liquidity is sitting near its all-time high. The monthly Global Liquidity Index has rolled from 57 to 40, the daily flash update is already at 32.2, and the Shadow Monetary Base is contracting at minus 5.7 percent annualised.
A record July federal deficit landed in the same week as a 10-year auction that cleared at the highest yield since2007. The 30-year is pricing at its highest yield in around 25 years. Around 85 percent of gross marketable issuance is now in bills, and the Fed is quietly absorbing roughly US$26.5 billion of them a month across Reserve Management Purchases and MBS reinvestments. Treasury is running active buybacks in the belly. The US even joined Japan in a rare, coordinated yen intervention, with the New York Fed selling euros for yen on behalf of Treasury and Japan tapping the FIMA repo facility so it can borrow dollars against its US$1.14 trillion of Treasury holdings instead of selling them. That is a lot of duct tape for a market that is supposedly fine, and every piece of it is a form of quiet support that has to sit on top of the official policy stance.
We remain structural bulls and we will still be structural bulls when the next cycle rips. What August has done is sharpen the map of what could pull that turn forward. The bond market this month is telling us that the ingredients for a funding accident are already on the table, and when the tape finally gives, the only balance sheet big enough to catch the long end is the Fed. The Fed is not in that trade yet. Other things on the radar remain, a disorderly move in Japanese Government Bonds that drags US yields with it, a deeper rollover in US growth and labour, and a sustained restart of Chinese liquidity that would print in gold before it prints in anything else. Any one of those forces the pivot earlier than the base case, which is still a proper liquidity trough sometime in 2027. Until then, sideways with a downward bias is the working call. Bitcoin at around US$64,000 is not expensive on any four year plus measure, but that is not the same as leaning in heavily today. A cleaner entry is very likely available over the next few months, and the right tone remains disciplined dollar cost averaging and quiet accumulation.
One thing this month has added is a reminder that the how matters as much as the why. The Coldcard exploit did not break Bitcoin, but it did remind everyone that a single device, a single seed, or a single custodian is a single point of failure. If you have taken the time to understand this framework, take the same time to run your storage properly. Multisig at scale, geographic backups, or a segregated institutional cold storage account with a real business behind it are all legitimate answers. Bad self-custody is worse than good third party custody, and this month put that under a spotlight. The macro thesis and the storage thesis point in the same direction. Own the hardest asset, hold it properly, and let time and the next liquidity turn do the work.
Watch the full presentation with detailed explanations and discussion on our YouTube Channel here: https://www.youtube.com/watch?v=BitctCZrytE
Until we return with more analysis next month, keep stacking those sats!
Joseph Brombal
Research and Analysis Manager
The Ainslie Group
x.com/Packin_Sats
Share this Article:
Crypto in your SMSF





Get Started Trading Crypto with Ainslie.
Join Thousands of satisfied customers who trust Ainslie for their cryptocurrency and bullion needs.