Bitcoin Analysis: Beyond the Block – June 2026
June 19, 2026
News
Today the Ainslie Research team (ainslieresearch.com) brings you the latest monthly update on Bitcoin, including the Macro fundamentals, market and on-chain technical metrics and all of the other factors currently driving its adoption and price. This summary highlights some of the key charts that were discussed and analysed by our expert panel. We encourage you to watch the video of the presentation in full (https://www.youtube.com/watch?v=HYIV5MlLxIo) for the detailed explanations.
Bitcoin and Global Liquidity
Bitcoin is the most directly correlated asset to Global Liquidity. Trading Bitcoin can be thought of as trading the Global Liquidity Cycle, but with an adoption curve that leads to significantly higher highs and lows each cycle. As such we look to buy Bitcoin during the ‘Bust’ phase or liquidity low, then rotate out of it during ‘Late Cycle’ where liquidity is over extended and downside protection is required (our preference is to rotate into Gold). When correctly timing and structuring the rotation, it is possible to significantly outperform ongoing monetary debasement. The Bitcoin cycle low was in November 2022, and since then the returns have been unmatched by any other major asset.
Where are we currently in the Global Liquidity Cycle?
Welcome to the written report for June Beyond the Block. Those who also view our Beyond the Block podcast on YouTube will be aware of our new product, the Ainslie Bitcoin Bullion Fund. In short, the fund is a wholesale managed fund that actively allocates between Bitcoin, gold, and silver, aiming to deliver strong capital growth while protecting downside risk with precious metals during Bitcoin drawdowns. Our dynamic investment approach is directly guided by the macro and liquidity cycles covered in Beyond the Block analysis, which forms the core foundation of the Fund’s investing framework and asset allocation decisions.
If you qualify as a wholesale investor and would like to learn more about the Ainslie Bitcoin & Bullion Fund, visit our official information page at https://www.ainsliewealth.com/ainslie-bb-fund.
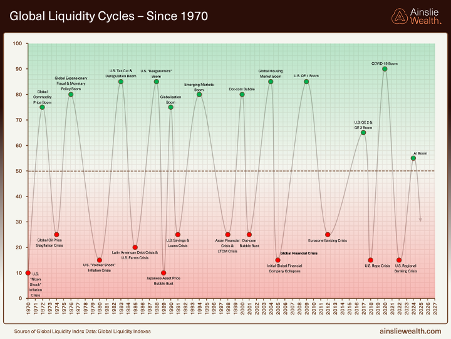
Not much has changed on the long view this month, and that is the point. Going back to 1970 the cycle still expands and contracts around the same 50 line, with each peak carrying its own narrative, the Reaganomics boom, the dot-com bubble, the QE eras, the COVID surge, and now the AI boom. The labels change, the catalysts change, but the rhythm holds. What that long history tells us is that liquidity cycles die of old age, and the current upswing has now run long enough that we should be looking for the rollover, not the next leg up.
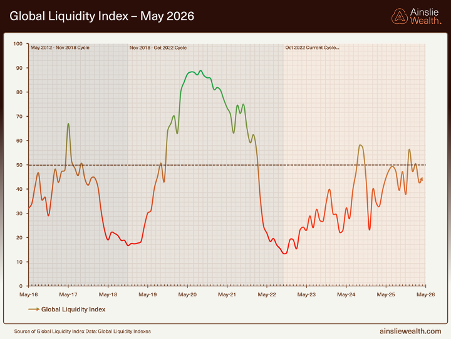
Zooming into the past decade gives us the same message at higher resolution. The monthly Global Liquidity Index has now slipped to 45.0 in the latest read, down from 50.4 in February and 57 at the late-2025 peak. That is a meaningful step lower, and it has been delivered in a series of sharp rallies that quickly lose momentum followed by equally sharp drawdowns. That is exactly the kind of choppy, sideways action we expect when a liquidity cycle is rolling over in stages rather than launching into a fresh multi-year expansion.
For context, the previous cycle bottomed near 15 in late 2022, which was the buy signal we acted on at the time. We are not pretending to know the exact level of the next trough, it may be 20 or 25 rather than the deep teens, but the direction of travel is what matters. The modelling now points to a 2027 low, which aligns with the 60 to 65 month bottom-to-bottom rhythm we have been tracking all year. From here the path of least resistance for the index is lower.
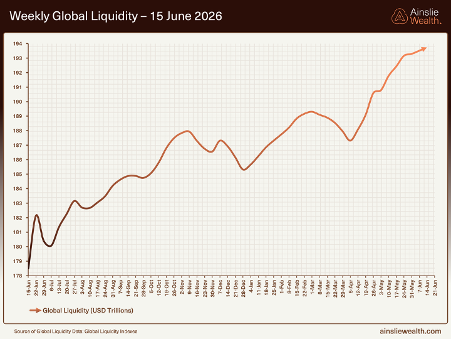
The weekly nominal series is the chart that traps people. Global liquidity just printed another fresh record at US$193.5 trillion, up from US$191.8 trillion last month, and on a 3-month annualised basis it is now growing at 9.7%. If we just showed you this chart in isolation, the conclusion would be that everything is fine, liquidity is up and to the right, life is good. We have flagged month after month that it is not that simple, and this is exactly where the framework earns its keep.
The thing to focus on is the rate of change at the margin, not the absolute level. The Shadow Monetary Base, which is the engine underneath, has slipped to US$109.7 trillion and is now running at minus 1.6% on a 3-month annualised basis. Read that again. The headline goes up, the foundation contracts. The lift in nominal liquidity is being supported by dollar stability and a suppressed MOVE index, both of which are running out of road. The nominal level can keep grinding up while the underlying cycle is rolling over, and that is the regime we are in right now.
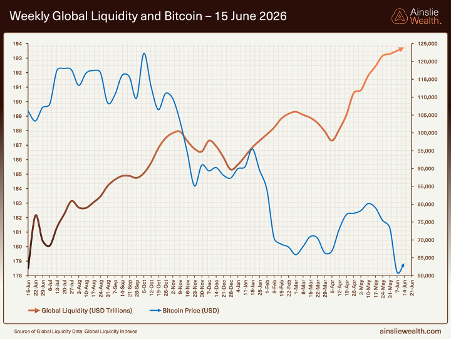
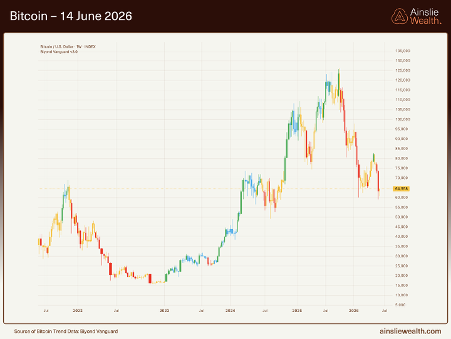
Overlay Bitcoin on top of that weekly liquidity line and the divergence has, if anything, widened. Liquidity has grinded higher to fresh nominal highs while Bitcoin sold off from the US$125,000 peak last year all the way down to roughly US$60,000 at the early-February low, recovered from there into early May, and is now grinding back lower again as we write. The price action over the past month has been weak, with falling momentum candles and a series of bearish closes that have not been able to reclaim pre-reset structural ground. Money flows where it is treated best, and right now that is AI, semis, and gold, not Bitcoin.
Our read has not changed. Bitcoin has already done the heavy lifting on pricing in the late-cycle headwinds we keep flagging, while the nominal liquidity line is yet to fully reflect them. That creates a setup we still find attractive on a multi-year horizon, plenty of macro headwinds for liquidity from here, but a Bitcoin price that has moved well ahead of the deterioration we actually see in the underlying drivers. The short to mid-term remains somewhat negative until we see a new low in liquidity and price.
On the Bitcoin chart itself, the bounce off the early-February low near US$60,000 has not held its early gains. Price spent February through early May trying to build a recovery, and June has rolled back into failed retests and bearish momentum candles. That is exactly the kind of staircase price action that fools a lot of people into calling the bottom in real time and then trapping them. We are not in that camp. The rally so far looks transitional rather than confirmed bullish, and the historical bear-market lows have almost always involved one final flush after a recovery of this size, not a V-shaped recovery straight to new highs.
The point is not to predict the exact path, it is to be honest about the fuel. The macro is not supplying the kind of liquidity impulse that drives a sustained breakout from here, so even if we grind a little higher, we struggle to see what funds the next leg toward six figures and beyond before liquidity bottoms. Bitcoin spends the bulk of its time in chop rather than trending, and with the liquidity backdrop rolling over, our base case is sideways and lower before the next real cycle low.
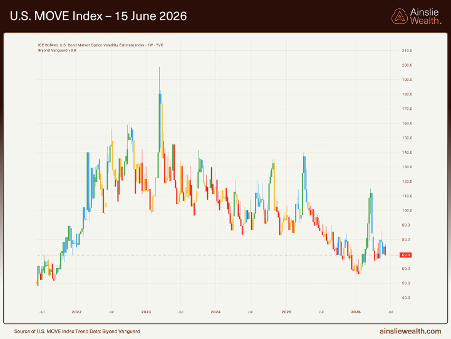
The MOVE index is again the chart we want everyone to pay attention to this month. It sits at 69.4, retreating from the 115 spike earlier in the year and broadly in line with last month’s 67, but critically the index is yet to make a lower low. The US Treasury is actively engineering this through buybacks, roughly US$28 billion of long-end buybacks for every 10-point rise in the MOVE, funded by issuing more short-term debt. The correlation between the MOVE and Treasury buybacks now runs at 0.71, with the relationship pegged at US$30 to US$40 billion of buybacks per 10-point move. The whole point of the operation is to keep bond volatility low so collateral haircuts compress, and the multiplier on the rest of the liquidity stack can stay high.
Add to that the roughly US$600 billion of front-end support that has been injected since October, and the picture gets clearer. There are three pieces running in parallel. First, the Fed has expanded its balance sheet by around US$200 billion through Reserve Management Purchases since December, buying T-bills and short-dated Treasuries to keep reserves at what they call ample levels. It is not officially QE, but it is the same plumbing dressed in a different jacket. Second, the Treasury itself is running its own version of QE, buying back long-dated bonds to suppress the MOVE and replacing them with short-dated issuance, which keeps the long end well-behaved while term premium stays compressed. Third, the eSLR reform that came into effect on 1 April lets the largest US banks hold materially more Treasuries on balance sheet, freeing up an estimated US$200 billion plus of Tier 1 capital at the depository level. The theoretical headroom that creates is multi-trillion, but the realistic delivery in practice is measured in hundreds of billions of additional Treasury and repo capacity, not trillions, and it will be a gradual build rather than a sudden surge. Balance sheet expansion, stealth Treasury QE, and bank deregulation, all working in the same direction. It is real plumbing support, but it is not a new cycle. You can only push a beach ball under water for so long. The MOVE is sitting near the complacency floor, which historically is where volatility shocks come from, not where they get absorbed. The benign backdrop we have enjoyed for the past few months is not the new normal, it is a fragile equilibrium, and the moment bond volatility starts to re-price higher, the same mechanism that has been supporting risk assets flips and becomes a headwind.
Macro Indicators
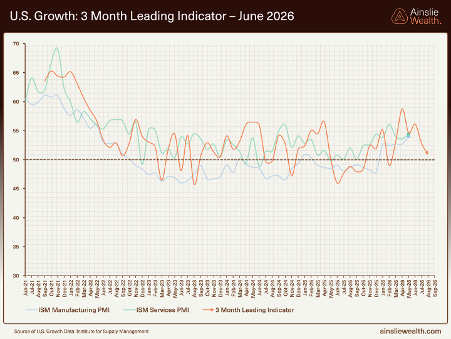
Our 3-month leading indicator on US growth has rolled further this month, with the composite slipping closer to the 50 expansion threshold. ISM Manufacturing and Services are both still printing in the low 50s, which means the economy is technically still in expansion territory, but the leading indicator has now rolled over from its peak earlier in the year and is grinding lower at the margin. Main Street activity is holding up, particularly off the back of the AI capex boom and ongoing fiscal support, but the rate of change is no longer working in its favour.
This is exactly what we expect to see late in a liquidity cycle. The US economy is being propped up by deficit spending and the AI build-out, both of which need ever-larger doses of stimulus to keep the party going. The forward indicator is starting to call time on that, and when you line it up against a 60 to 65 month liquidity cycle that should be rolling over right about now, the picture is consistent. None of this means recession tomorrow, it just means the strongest months of this expansion are behind us.
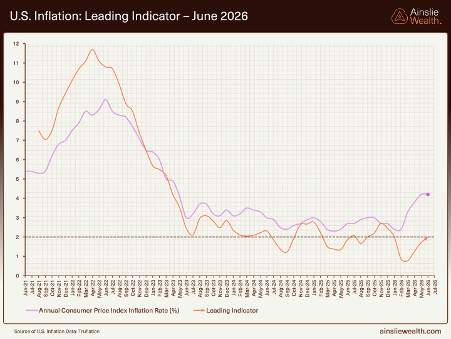
The Truflation leading indicator continues to point lower over the next few quarters, while headline prints have stayed sticky in the high 3s. The headline noise is being driven by oil, and oil has rolled from the recent flare-up but is still not cheap, with WTI trading around US$75 a barrel and Brent in the high 70s. That is a long way from the panic-pricing we saw earlier in the year, and at these levels oil is no longer adding fuel to the inflation print, but it is also not yet acting as a clean disinflationary tailwind.
On the PCE side, the latest April release printed core at 3.3% year-on-year and the one-month annualised headline read at 4.9%, well off the 8.3% headline spike we saw out of the March release but still running multiples of the Fed’s 2% target. The reason that matters is that the Fed has now been over target for the better part of five years, and Kevin Walsh has just taken the chair as a known hard-money man. That combination means the Fed is not going to be pre-emptively easing into any wobble, and a sticky inflation print at these levels is exactly the kind of cover the new chair needs to keep policy tight for longer than markets are positioned for.
Underneath all of this, the deflationary forces are still doing their work. AI-driven productivity gains, white-collar repricing, and ongoing cost-cutting are quietly stripping cost out of the system. The labour market is softening at the edges, with unemployment drifting higher and participation slipping. In that world, the bigger medium-term risk is growth rolling over into a disinflation problem that eventually drags the Fed into deeper cuts and, if needed, full QE, a backdrop that historically has been far more supportive for Bitcoin and global liquidity than for the real economy in the short term. With Walsh at the chair though, we think that pivot is going to be later and smaller than markets currently expect.
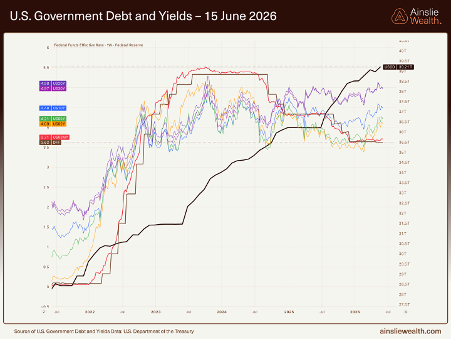
Not much has changed on debt and yields. US government debt sits north of US$39 trillion and continues to climb on its parabolic path, with no political appetite to slow it down. The Fed funds effective rate is still in the high 3s, and since early 2026 the curve has been flattening from the short side, with bill yields drifting up faster than the long end as the market re-prices the cut path later and shallower under Walsh. The Treasury is helping that flattening by issuing heavily at the front and buying back duration at the back, while the long end refuses to come down materially given sticky inflation and the term premium the market is finally demanding back. The market does not trust the fiscal picture, and it is no longer prepared to lend to the Treasury at the 30-year for free. That is the regime signature of late-cycle liquidity. The next round of Fed support, when it comes, is unlikely to be much further on rates, it will come through balance-sheet plumbing and bank deregulation, both of which are already quietly running in the background and visible in the US$600 billion of front-end support we walked through earlier.
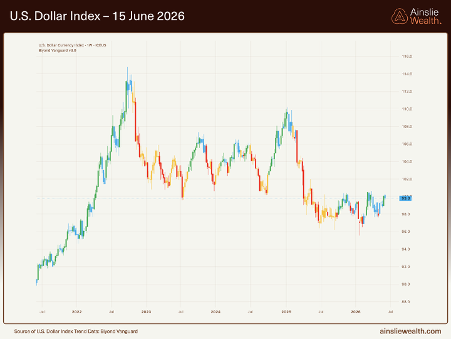
The US dollar is still the swing factor for global liquidity, and it is still doing the heavy lifting on the nominal numbers. The DXY has continued to bleed lower through May and June, lifting the dollar value of non-US central bank liquidity and improving financial conditions for offshore borrowers. That is supportive at the margin, but the more interesting point is what has not happened. Even with the Iran flare-up earlier in the year and ongoing geopolitical noise, the kind of backdrop that would historically drive a sharp risk-off dollar rally, the DXY has refused to spike.
That is either the calm before something nasty, or a sign that the dollar has quietly peaked in cyclical terms. What we are watching closely right now is the DXY pressing up against resistance at the 100 mark. A clean break above 100 would open the door to 104.5 as the next target, and a move of that size would be a meaningful headwind for the nominal liquidity tailwind we have been leaning on. The room for further dollar weakness from here is also limited, you can only fall so far before the move loses its juice as a liquidity input. A sustained dollar squeeze through 100 would tighten conditions fast, which is the tail risk we keep one eye on, but the base case is more range-bound action and a slow drag on the headline liquidity tailwind.
ETF Flows, Capex, and the Real Economy
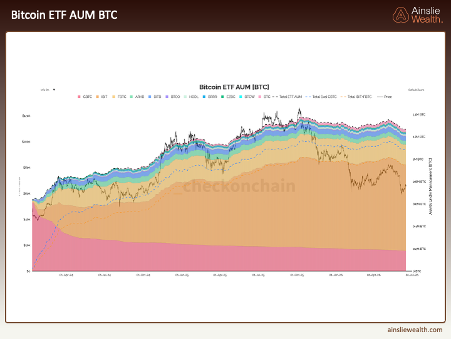
The big story this month sits in the ETF flows. Spot Bitcoin ETF AUM peaked at US$169.5 billion on October 6, 2025, holding roughly 1.376 million Bitcoin, about 6.6% of total supply. As of early June, AUM has collapsed to roughly US$80 billion holding 1.277 million Bitcoin. That is a US$90 billion drawdown in AUM, and roughly 99,000 Bitcoin shed from ETF balance sheets in eight months, a 7.2% reduction in coins held. Through early June we saw 13 straight days of net outflows draining US$4.4 billion, the longest streak since the products launched. This is the impatient money chasing momentum, and it is doing exactly what impatient money always does at the wrong end of a cycle.
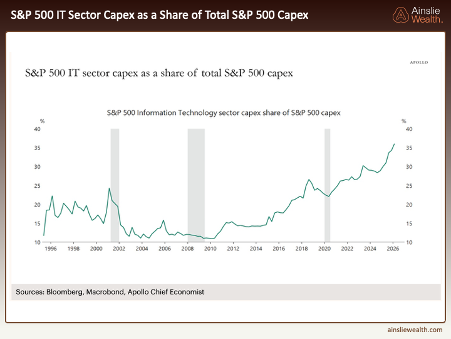
If liquidity is rolling over and the consumer is softening, the obvious question is who is keeping the US economy from rolling with it? The IT sector’s share of S&P 500 capex has gone from roughly 15% pre-COVID to nearly 40% today, driven almost entirely by five hyperscalers, Microsoft, Amazon, Alphabet, Meta, and Oracle, who between them now account for around 30% of all S&P 500 capex according to Nuveen. Goldman’s forecast has hyperscaler capex going from US$230 billion in 2023 to US$754 billion in 2026 and US$905 billion in 2027. The entire bull case for the S&P 500, US payrolls, and even US GDP late in this cycle runs through five companies building data centres for one technology.
The closest historical analog is the 1999 to 2000 telecom and fibre build-out, where capex went vertical on the assumption that demand would justify the spend before the depreciation cycle ate the income statement. GPUs depreciate over four to six years on the books, and arguably faster in economic reality given the cadence of new chip generations. That payoff window is shorter than the people writing the cheques are pretending it is, and when capex cycles turn, they turn fast. The capex is real, the demand is real, but the question is not whether AI is real, it is whether the build-out can continue to grow at this pace without breaking something.
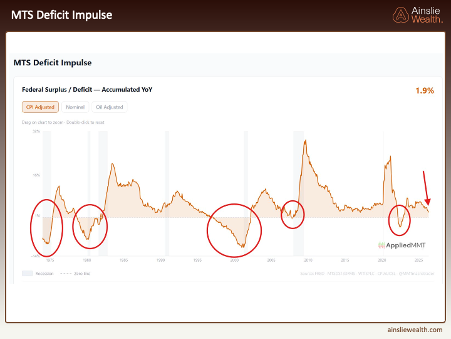
Credit to Douglas Padgett at AppliedMMT for this one (@MMTmacrotrader on X). The chart shows the rate of change in the US federal deficit on a CPI-adjusted basis going back five decades, what he calls the MTS Deficit Impulse. The level matters less than the direction. Every single recession in the dataset, 1974, 1980, 2001, 2008, 2020, has been preceded by this measure collapsing from positive territory toward, and through, zero. Right now the print is +1.9% and has just turned back up after collapsing from the post-COVID peak. It is back above the line, but it is doing so off a multi-year compression in fiscal flows.
Why does this matter for the real economy. Government spending is, by accounting identity, a financial asset for the private sector. When the deficit impulse weakens, the private sector has to fund itself, and that is exactly when the capex story we just walked through starts to bite. Big companies are already running their cash balances down. Hyperscaler capex is now running at roughly 100% of operating cash flow versus a 10-year average of around 40% per Morgan Stanley. The big five issued US$121 billion of investment-grade bonds in 2025, more than four times the prior 5-year average of US$28 billion, and BofA is forecasting roughly US$175 billion of fresh hyperscaler IG issuance in 2026 with some bulge-bracket desks pencilling in materially higher numbers as deal cadence picks up. Boom-time capex guidance is also a lagging indicator. Telecoms in 1999, energy in 2014, semis in 2022, all of them guided higher right up to the quarter the cuts landed. The combination of a weak fiscal impulse, debt-funded capex, and lagging guidance is exactly the cocktail that turns a sideways economy into a contracting one.
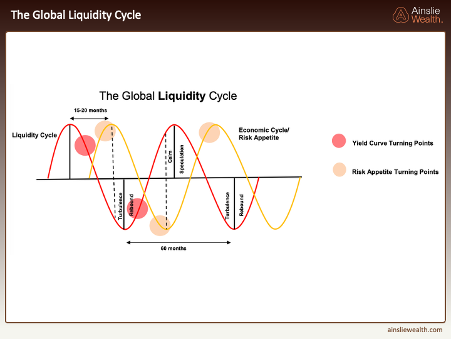
The diagram lines up the liquidity cycle against risk appetite. Early in the upswing, when liquidity is cheap and expanding, the market piles into risk-on, growth stocks, speculative tech, smaller caps and, in our world, Bitcoin. As the wave turns over, leadership rotates into commodities and cyclical value, resources, energy, miners, before eventually moving into defensives like utilities and staples on the way down.
Where we are on the map this month, the market is living on borrowed time and borrowed money. The Global Liquidity Index has rolled from 50.4 in February to 45.0 in April, paced by weaker Advanced Economies. We are sitting at the top of the wave in the Speculation zone, with the commodity complex doing the heavy lifting. That is textbook end-of-cycle rotation, right on schedule. From peak liquidity to peak risk appetite the historical gap is roughly 15 to 20 months, which suggests risk appetite can grind out the back half of 2026 before properly rolling.
Conclusion
This is exactly the kind of month where the framework matters more than the headlines. Nominal liquidity is at fresh highs, the US economy is still expanding, the dollar is well-behaved, and Bitcoin is grinding rather than capitulating. On the surface, life is fine. Underneath, the monthly liquidity index has rolled from 57 to 45, the Shadow Monetary Base is contracting, the MOVE is being held down by US$600 billion of plumbing support, the PBoC has gone outright tight and hyperscaler capex is now consuming 100% of operating cash flow. The cycle is doing exactly what cycles do, and we are exactly where we should be. Declining global liquidity equals a headwind for crypto. The next phases on the cycle map are Turbulence and then Rebound, and that is where the real Bitcoin accumulation window opens, into a trough we still expect somewhere in 2027.
For Bitcoin specifically, we remain long-term bulls, that has not changed, and it will not change. What we are flagging is that the next six to twelve months are most likely going to be a grind. Sideways and lower is our base case, with the real opportunity setting up into a liquidity trough somewhere in 2027. At current levels Bitcoin is not expensive, and on a four-year-plus horizon, almost any entry around here works out fine. The point is that you very likely will get a better one, so dollar-cost averaging and patience are the strategies that pay this year. If you have not got enough, you should be waking up every day praying it goes lower, because that is exactly the environment where disciplined accumulation does the heavy lifting for the next cycle.
We can see plenty of scenarios that would force the Fed to step up support before that 2027 trough arrives, a funding squeeze, a disorderly move in bonds, a deeper rollover in growth and employment, or something we have not thought of yet. We are watching for any of those, but the charts do not justify trading as if the cavalry has already arrived. For now, we are in a late-cycle environment with clear liquidity headwinds, a still-growing real economy, and a Bitcoin price that has moved well ahead of the deterioration we actually see in the data. In our view, that combination offers attractive asymmetrical risk/reward for patient capital willing to accumulate into weakness and let the next liquidity cycle do the heavy lifting.
Watch the full presentation with detailed explanations and discussion on our YouTube Channel here: https://www.youtube.com/watch?v=HYIV5MlLxIo
Until we return with more analysis next month, keep stacking those sats!
Joseph Brombal
Research and Analysis Manager
The Ainslie Group
x.com/Packin_Sats
Share this Article:
Crypto in your SMSF


Get Started Trading Crypto with Ainslie.
Join Thousands of satisfied customers who trust Ainslie for their cryptocurrency and bullion needs.