Bitcoin Analysis: Beyond the Block – April 2026
April 17, 2026
News
Today the Ainslie Research team (ainslieresearch.com) brings you the latest monthly update on Bitcoin – including the Macro fundamentals, market and on-chain technical metrics and all of the other factors currently driving its adoption and price. This summary highlights some of the key charts that were discussed and analysed by our expert panel. We encourage you to watch the video of the presentation in full https://www.youtube.com/watch?v=_hAd-VPOXYE for the detailed explanations.
Bitcoin and Global Liquidity
Bitcoin is the most directly correlated asset to Global Liquidity. Trading Bitcoin can be thought of as trading the Global Liquidity Cycle, but with an adoption curve that leads to significantly higher highs and lows each cycle. As such we look to buy Bitcoin during the ‘Bust’ phase or liquidity low, then rotate out of it during ‘Late Cycle’ where liquidity is over extended and downside protection is required (our preference is to rotate into Gold). When correctly timing and structuring the rotation, it is possible to significantly outperform ongoing monetary debasement. The Bitcoin cycle low was in November 2022, and since then the returns have been unmatched by any other major asset.
Where are we currently in the Global Liquidity Cycle?
Welcome to the written report for April Beyond the Block. Those who also view our Beyond the Block podcast on YouTube will be aware of our new product, the Ainslie Bitcoin Bullion Fund. In short, the fund is a wholesale managed fund that actively allocates between Bitcoin, gold, and silver, aiming to deliver strong capital growth while protecting downside risk with precious metals during Bitcoin drawdowns. Our dynamic investment approach is directly guided by the macro and liquidity cycles covered in Beyond the Block analysis, which forms the core foundation of the Fund’s investing framework and asset allocation decisions.
If you qualify as a wholesale investor and would like to learn more about the Ainslie Bitcoin & Bullion Fund, visit our official information page at https://www.ainsliewealth.com/ainslie-bb-fund.
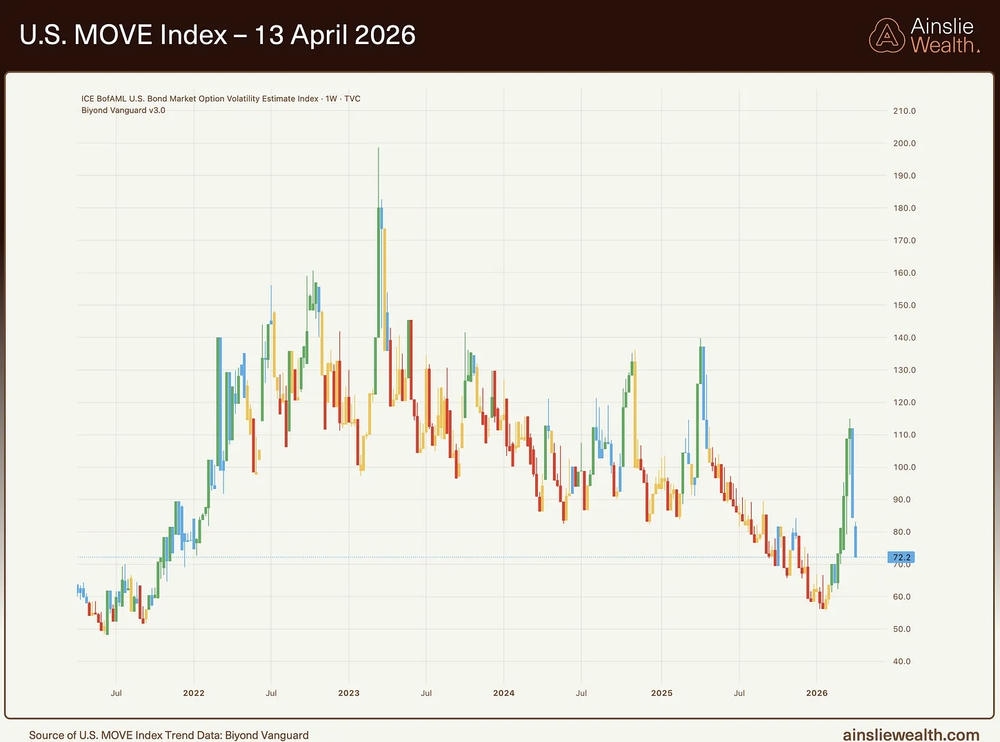
In March we retired the old macro scatter chart and shifted to the Global Liquidity Index as our primary anchor. We also pointed to MOVE readings near 60 as “priced for perfection”, a coiled spring.
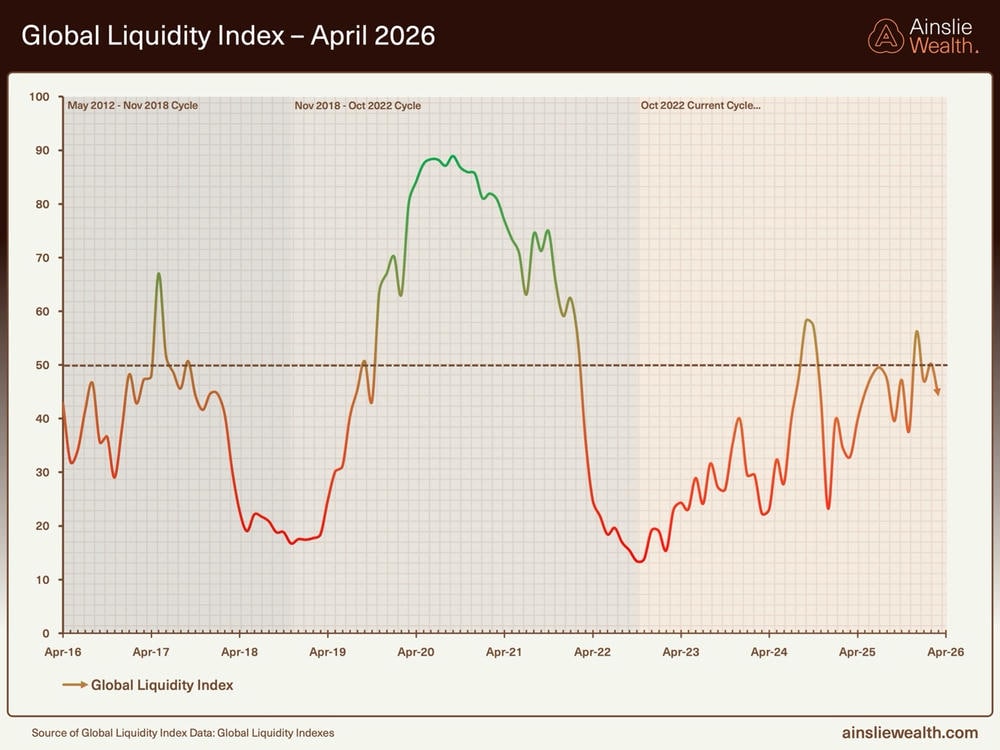
Here’s where things stand in April. The GLI has now fallen to 44.1, down from the December 2025 peak of 56.1. That is not a dip. A 12‑point decline over four months is a meaningful contraction, and it confirms that the cycle peak was Q3 2025. We are now clearly on the other side of it.
The AI infrastructure boom marked the liquidity high‑water mark. Hyperscaler capex is running at US$540 billion for 2026, channelling enormous amounts of capital into the real economy, which is great for growth but does not produce the kind of central bank balance sheet expansion that drives financial liquidity. Without another credible source of new liquidity, something large enough to restart the cycle, the trajectory is down. What would restart it? Realistically, some kind of shock, a bond market dislocation, a deep recession forcing the Fed back to the printer, or a geopolitical escalation severe enough to trigger a coordinated G7 response.
The average liquidity cycle runs approximately 65 months. The current expansion ran roughly 30 months from the October 2022 trough. Liquidity cycles tend not to die from a single shock. They die of old age, as the impulses that sustained them gradually exhaust themselves and then reverse. That appears to be what is happening now. From here, the risk‑reward is asymmetric in the wrong direction if you are relying on the liquidity cycle to do your heavy lifting. The upside in the near term is limited, choppy sideways price action. The downside, if the contraction follows historical patterns, is an 18 to 24 month slide in the GLI, possibly bottoming in 2027. We are not predicting that as a certainty, but it is the base case until the data tells us something different.
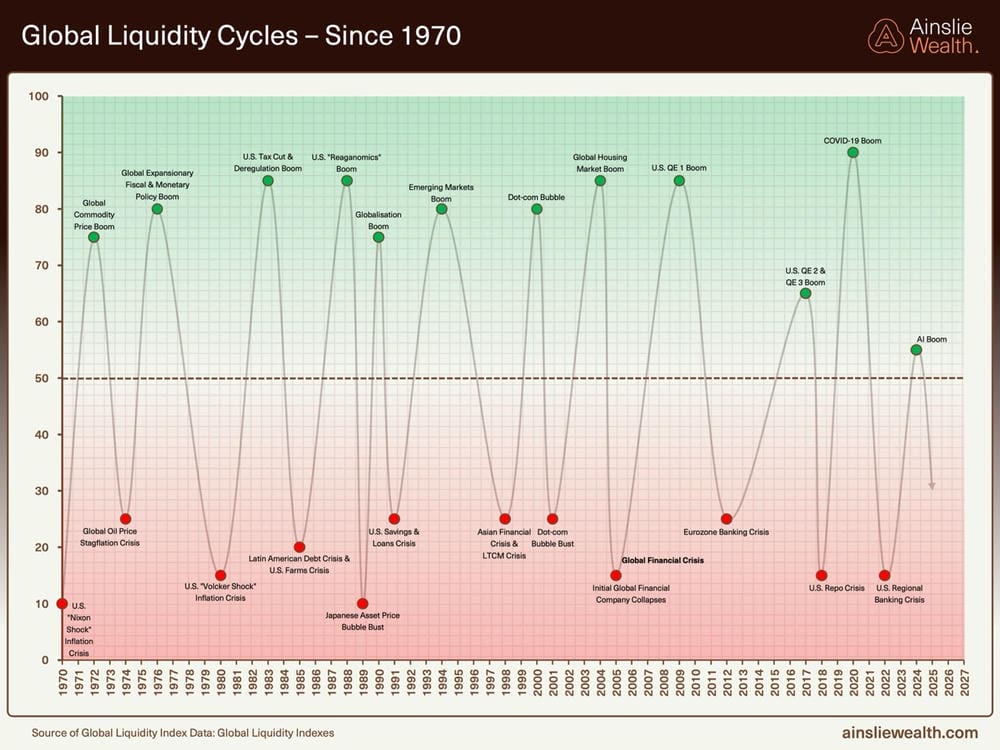
Zooming in on the 10‑year GLI chart, the picture becomes cleaner. This cycle’s rally was sharp and relatively short. What we are seeing now fits the pattern of the late stages of an upswing, a series of sharp rallies that each fail to make new highs, punctuated by sharper drawdowns. That is the signature of a cycle losing momentum, not consolidating before another leg up. The choppy, sideways action in the GLI since mid‑2025 is not base‑building. It is rolling over. Each time we have seen this pattern historically, the GLI has continued lower for 18 to 24 months before finding a credible floor. That timeframe aligns with our 2027 bottoming projection. We are not calling a crash; we are calling a grind.
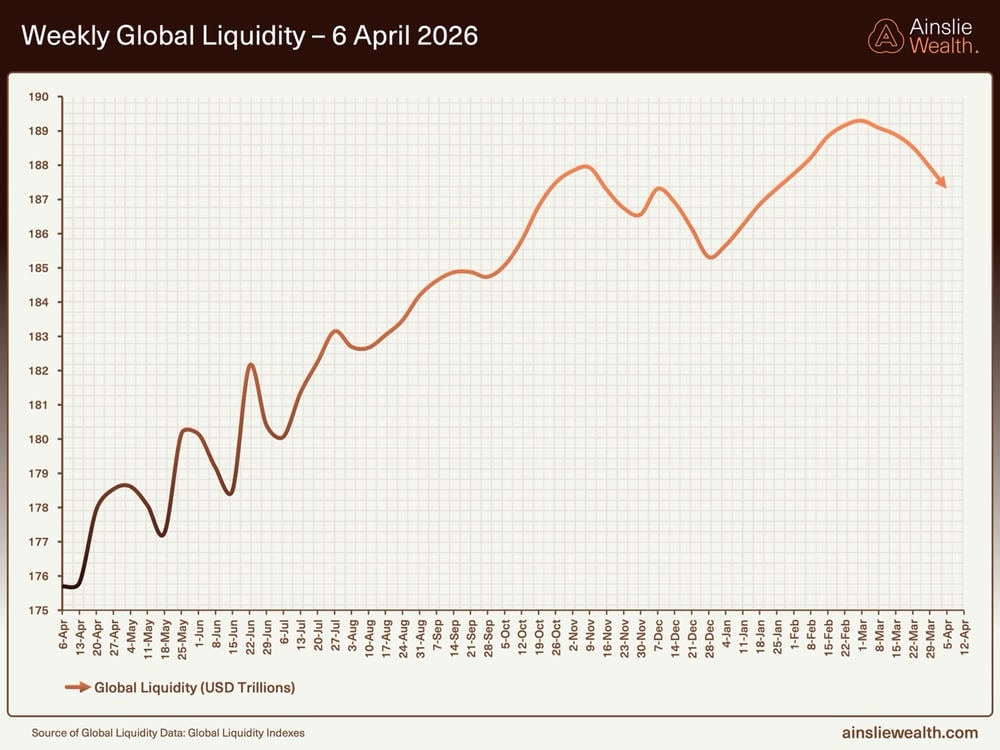
On a nominal basis, global liquidity has pulled back from its peak of roughly US$189 trillion in late February to approximately US$187.5 trillion. The headline number still looks close to all‑time highs, and that is technically accurate. But the headline number is not the point, It’s the rate of change that matters. A pool that was expanding and is now contracting has made a meaningful shift, even if the absolute level appears stable. Base effects that flattered the year‑on‑year figures are now rolling off, making the underlying deceleration more visible.
The other important nuance is the East‑West split. Developed market central banks, the Fed, ECB, Bank of England, are in withdrawal or at best neutral. China’s PBoC is still injecting liquidity at a rate of approximately US$850 billion per year, which keeps the global nominal total looking reasonable. The problem is that Chinese liquidity does not flow freely into Western risk assets. It is largely absorbed domestically and in commodity markets, particularly gold. So the global liquidity pool looks fine on the surface but the part of it that actually bids up Bitcoin, equities, and credit spreads is shrinking. The underlying momentum is uneven and fragile.
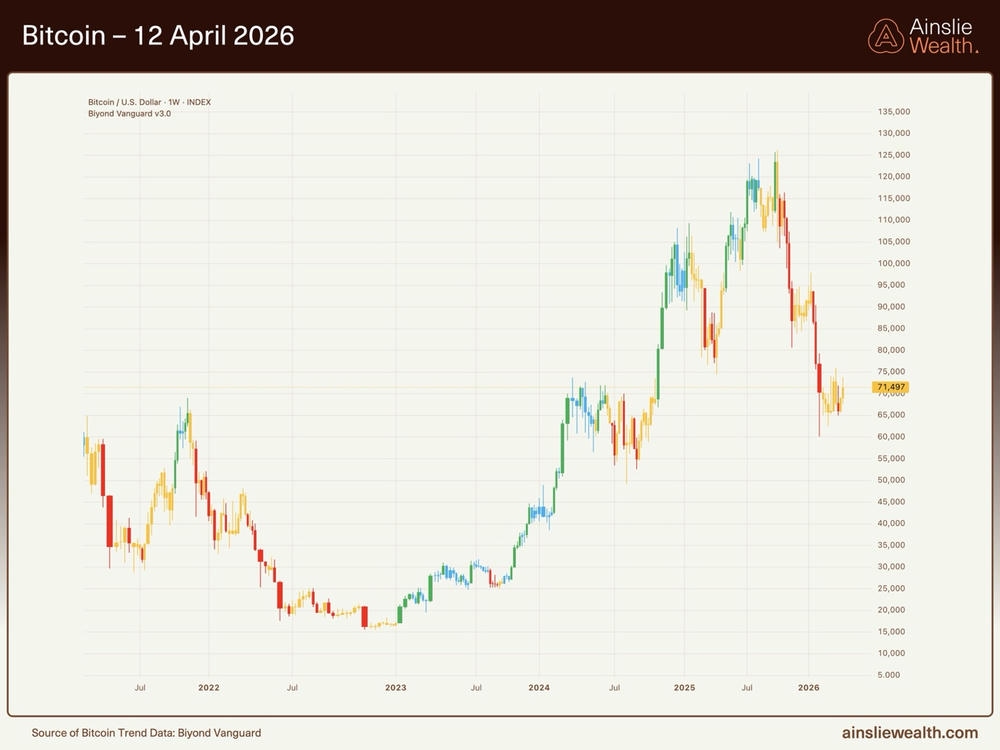
Bitcoin has moved from its $125,000 peak down to approximately $71,500, bouncing from a cycle low near $60,000. Meanwhile nominal global liquidity has remained close to all‑time highs. To anyone unfamiliar with the framework, this looks like a divergence, Bitcoin falling while the liquidity pool stays large. It is not a divergence; it’s the model working correctly. Bitcoin reprices to the rate of change of advanced‑economy liquidity, not to the nominal level. When the rate of change turns negative, which it has, Bitcoin reprices.
For us, Bitcoin sitting unusually low relative to the current GLI level creates an asymmetric setup. Even a modest policy surprise, a faster‑than‑expected Fed pivot, a ceasefire that brings oil back toward $80, a weaker dollar, could see BTC mean‑revert sharply toward the GLI‑implied range. On the momentum side, the Biyond Vanguard indicator on the weekly chart is printing red and orange candles, confirming the bearish inclination we see in the macro data. We are waiting for a shift back to blue (bullish inclination) and eventually green (strong bullish) before the trend picture turns constructive. Until that colour change happens, the momentum data aligns with our view that patience and accumulation are the right approach rather than chasing short‑term moves.
In March we described ultra‑low MOVE readings as a coiled spring, the bond volatility market priced for perfection in a world that was anything but certain. That spring has now released, and the path matters more than the endpoint. MOVE spiked from 60 all the way to 112 before pulling back to around 72. The fact that it got to 112 at all tells you how fragile the underlying equilibrium was. And as we discussed on the podcast, volatility on the volatility index is volatility squared, the bond market does not simply reset the next day after a spike like that. There are longer‑term consequences for collateral values.
What does that mean practically? MOVE is a measure of expected volatility in the US Treasury market. When it rises, dealers and banks face higher hedging costs on their bond books. That tightens collateral conditions, bonds used as collateral are marked down when volatility spikes, reducing the amount of leverage the financial system can run. On CrossBorder Capital’s estimates, each 10‑point rise in MOVE can knock roughly 4% off global liquidity via this collateral channel. The spike to 112 from a base near 60 was a huge hit to collateral values, even if it was temporary. The fact that MOVE has since retraced to around 72 helps, but the damage lingers. Counterparties reprice risk after a shock like that. Margin requirements ratchet up and do not always come back down as quickly as the index does. The benign macro backdrop of February was not a new normal, it was a fragile equilibrium that was always one shock away from unwinding.
Macro Indicators
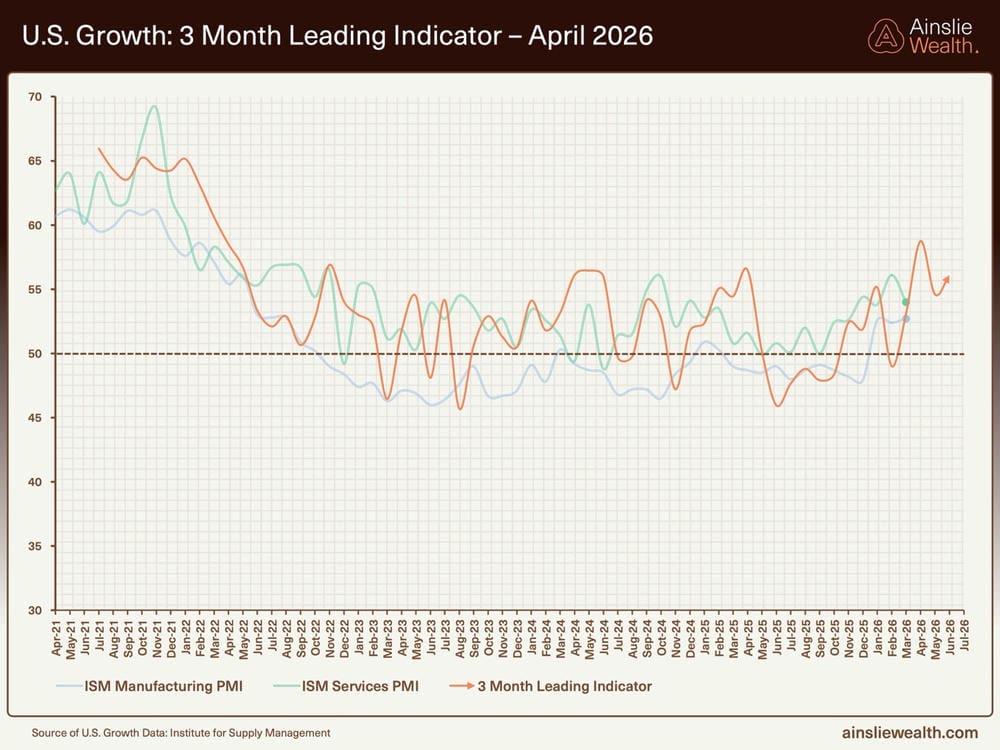
The growth picture in the US remains stronger than many expected. ISM Manufacturing is sitting at 52, Services at 53, and our 3‑month leading growth indicator is around 56. Those are not recessionary numbers. Hyperscaler AI capex at US$540 billion for 2026 is channelling enormous private capital into compute, power, and infrastructure, productive investment that shows up in output and employment.
This is the paradox of the current moment. A strong economy is, counterintuitively, not a great environment for financial asset liquidity. When capital is flowing to the real economy, into data centres, into construction, it is not sitting in the financial system bidding up multiples. Government fiscal support is providing a floor for household and business activity, but that is bottom‑up money, not the top‑down QE that expands balance sheets and drives asset repricing. Earnings can grow, but the multiple expansion that requires excess liquidity is constrained. Earnings up, multiples capped.
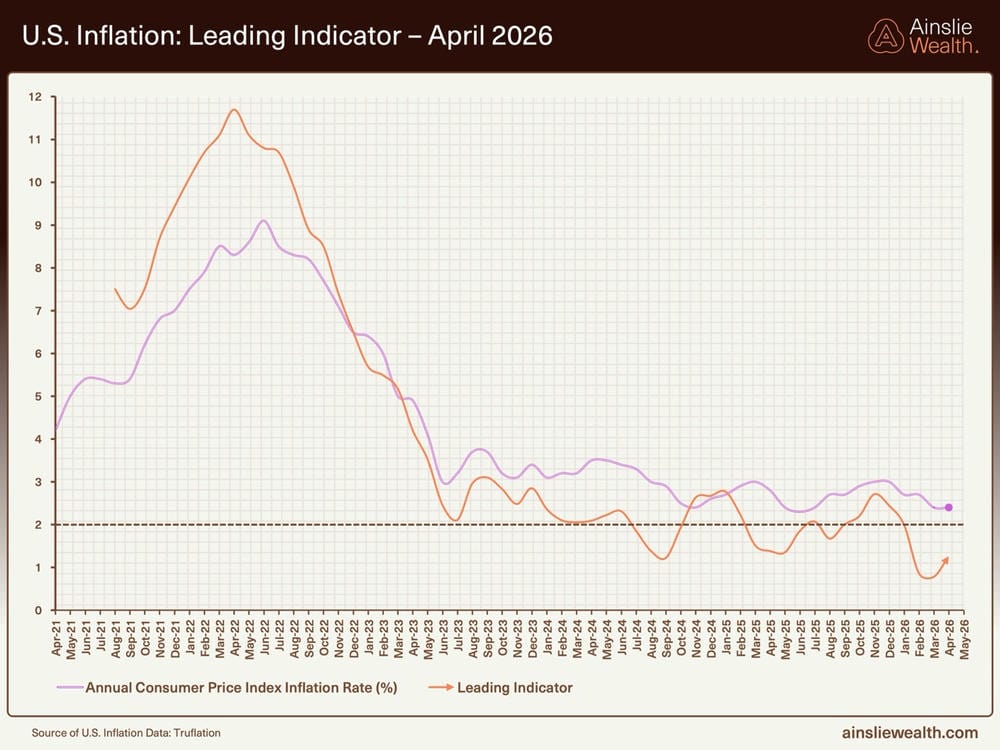
Our inflation leading indicator has crashed to approximately 1.2%, well below headline CPI and well below the Fed’s 2% target. That reflects powerful structural disinflationary forces. AI‑driven productivity is real and accelerating. White‑collar labour is being repriced. Goods supply chains have largely normalised. The structural disinflation story is still intact.
The complication is energy. The conflict in the Middle East pushed Brent to US$109.7, and the March CPI print came in at 3.3%. That gap, 1.2% on our leading indicator, 3.3% headline, is almost entirely explained by the oil shock working through transport costs, utilities, and fuel at the pump. We do not see this as the start of a new inflation cycle. It looks more like a tax on consumers, layered on top of a labour market that is softening. Without wage acceleration, and the data does not show that, the energy shock should fade as base effects roll through, probably by late 2026. So we have two forces pulling in opposite directions. Cyclical inflation from oil on one side, structural disinflation from AI on the other. That tension is exactly what is keeping the Fed paralysed. Kevin Warsh’s confirmation hearing on 16 April was an important signal. He views AI as structurally deflationary and has signalled willingness to cut rates. Markets are pricing the first cut in September, with Powell’s exit on 15 May marking the transition. But one cut, or even a shallow cutting cycle, does not reverse a liquidity cycle heading toward historical troughs.
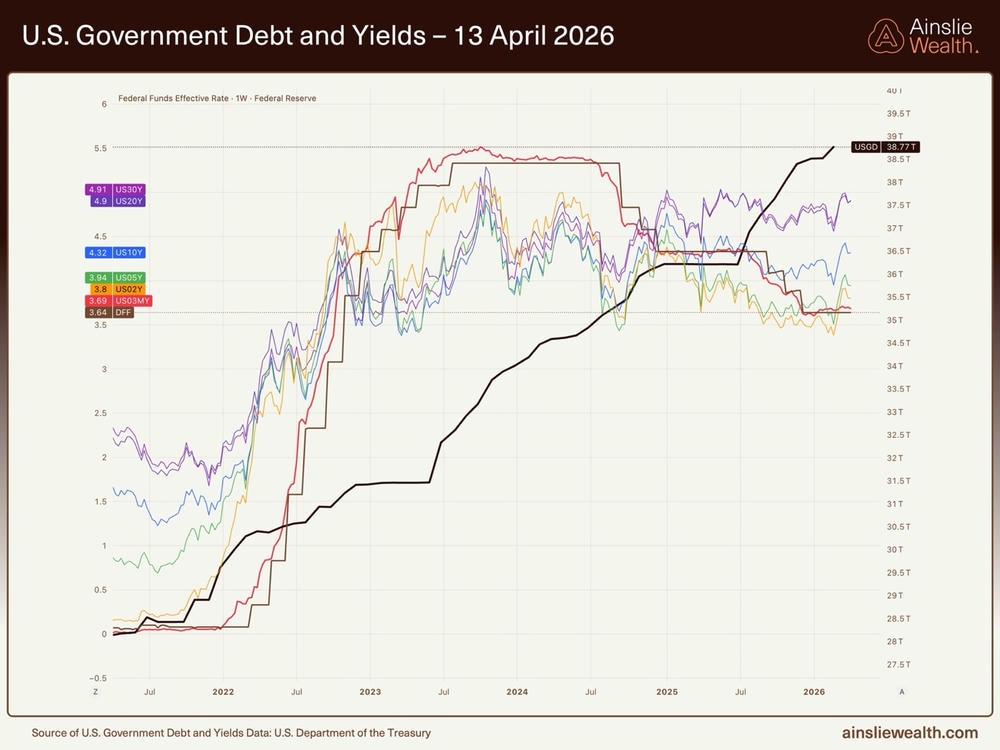
US national debt has now reached US$38.77 trillion and continues to climb. The tariff situation, which at one point looked like it might provide an income source to offset some of the rolling debt, has been squashed to a degree. The 30‑year Treasury yield is sitting at 4.91%, stubbornly refusing to follow the Fed Funds Rate at 3.64% lower. The bond market is demanding a term premium. That spread between long‑end yields, and the policy rate tells you something important. Bond holders do not believe the debt trajectory is sustainable, and they want to be compensated for the risk of holding duration.
There is real risk in the bond market that something goes wrong. Debt is at those highs and if yields explode higher, that feeds directly back into the MOVE index and the collateral channel we just discussed. Everything feels a bit precarious. But here is the important framing for Bitcoin holders. For that new wave of liquidity to come in and for momentum to build, something has to break in the financial system. Whether that is bond prices collapsing or yields spiking, what we need is not just Treasury QE but actual Fed QE, bond purchases that inject reserves and expand liquidity. The bond market breaking and the MOVE index going ballistic would be your moment to act, once you get that headline that the Fed is stepping in to provide liquidity to markets.
Real‑World Stress Tests: Why Bitcoin’s Properties Matter Now
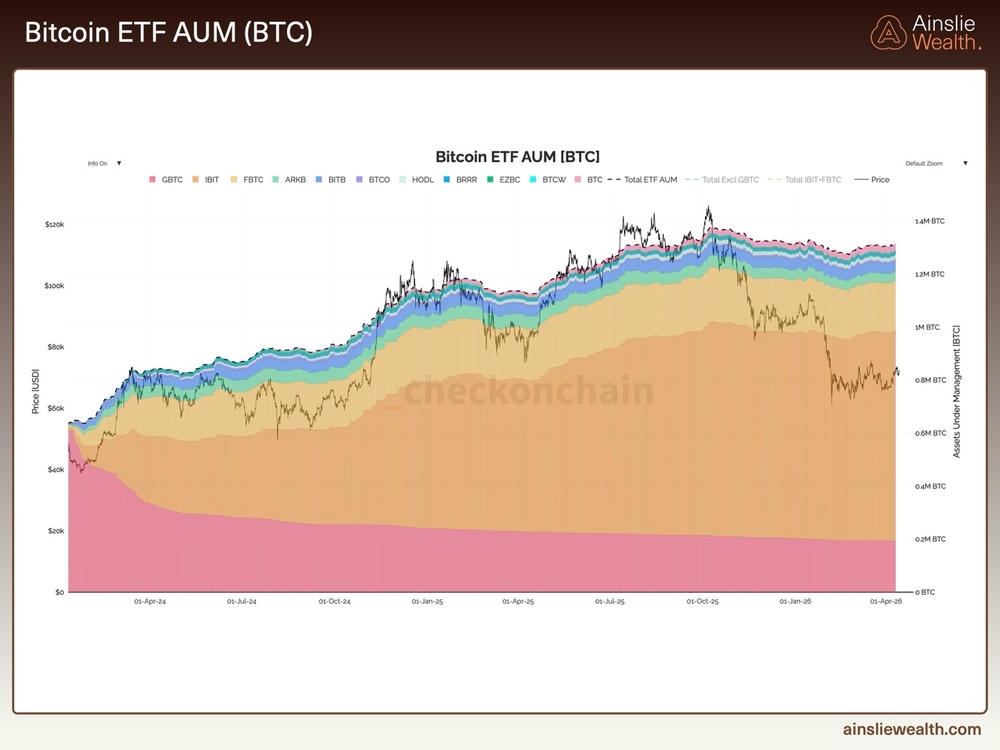
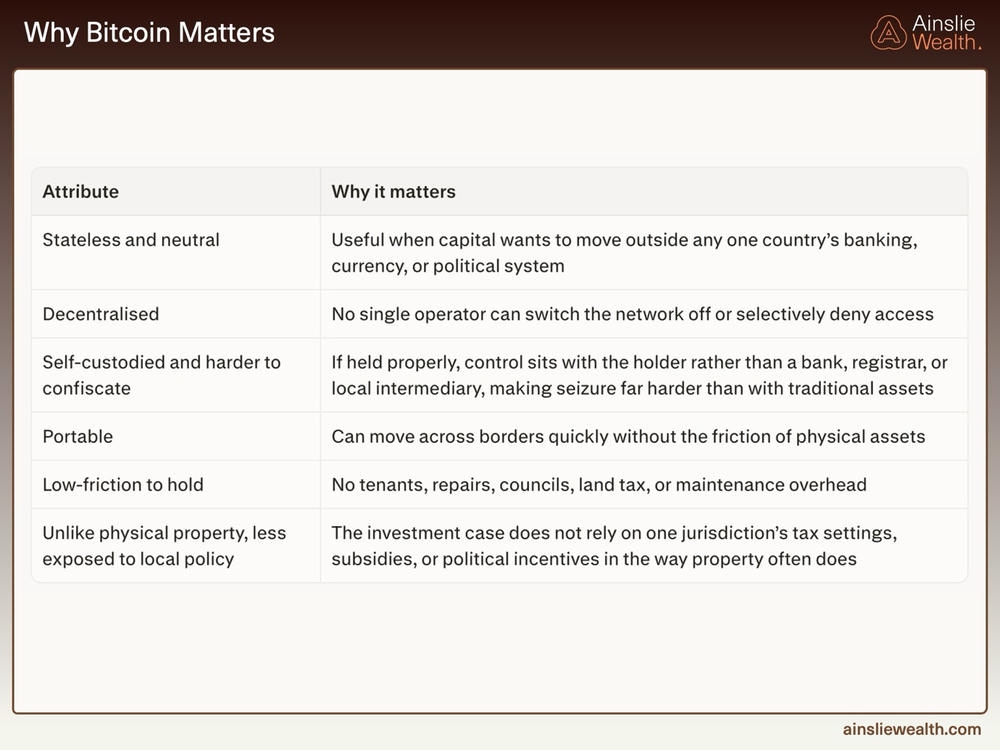
The ETF data tells us that institutional holders are not leaving. But it is worth asking a deeper question, why does Bitcoin hold this structural bid even through a $50,000 drawdown and a contracting liquidity cycle? The answer lies in the attributes summarised in the table below.
The ETF AUM data is easy to miss in months like this, when Bitcoin is trading $50,000 below its all‑time high and the headlines are dominated by geopolitics and earnings. But the underlying numbers tell an important story. AUM in US spot Bitcoin ETFs peaked at approximately 1.37 million BTC in October 2025. It dropped to around 1.28 million by February 2026 and has since recovered to approximately 1.30 million. Despite a roughly $50,000 drawdown from all‑time high, there has been no capitulation. Holders who came in through ETF rails, many of them institutional, many of them financial advisers running model portfolios, are staying put.
At the margin, some of that capital has likely rotated toward AI equities, gold, and energy. But the exits have been orderly and partial, not forced liquidation. The FASB fair‑value accounting changes and the CAMT exemption we covered earlier this year make it structurally easier for institutions to hold Bitcoin through drawdowns. The lack of forced selling points to underlying structural strength in the holder base.
Each row in that table maps to a real constraint that traditional assets face. Stateless and neutral means no single government can weaponise it through sanctions or capital controls, as we are about to see with Iran. Decentralised means no board, no CEO, and no single point of failure that a regulator can pressure into compliance. Self‑custodied means the holder bears the counterparty risk, not a bank or broker who might freeze accounts during a crisis. Portable means a billion dollars can cross a border on a phone in fifteen minutes. Low‑friction means no tenants, no councils, no land tax, and no maintenance, a stark contrast to the Australian property market we will discuss shortly. And unlike physical property, Bitcoin’s investment case does not rely on one jurisdiction’s tax settings, zoning rules, or political incentives.
These attributes can sound abstract when markets are calm. But this month gave us two real‑world case studies that made them concrete, one geopolitical, one closer to home.
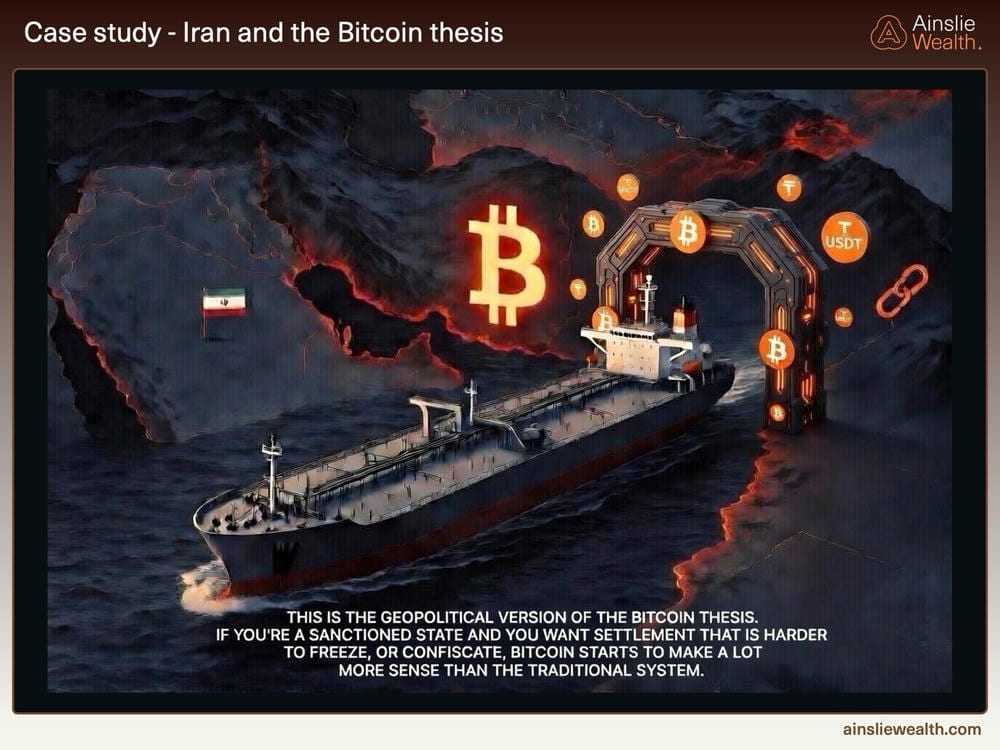
Reports emerged in April that Iran has been exploring the use of digital currencies, including Bitcoin, to settle trade in the Strait of Hormuz. Bitcoin cannot be sanctioned, it has no sovereign issuer that a foreign government can pressure, and it settles in approximately 15 minutes. The alternatives fail the test; the Chinese yuan has capital controls. Gold is physical, you cannot digitally transfer bullion through a sanctions environment without it passing through ports and hands that can be interdicted. Bitcoin wins by elimination in that specific settlement context. It is the only asset that can move value across a sanctioned border without physical transfer and without a correspondent bank.
Whether formal Bitcoin‑denominated oil contracts materialise is secondary. The significance is that a nation‑state under maximum external pressure is openly discussing Bitcoin as a settlement mechanism. This is not a crypto trading thesis, it is a real‑world stress test of Bitcoin’s core properties, and Bitcoin is passing it.
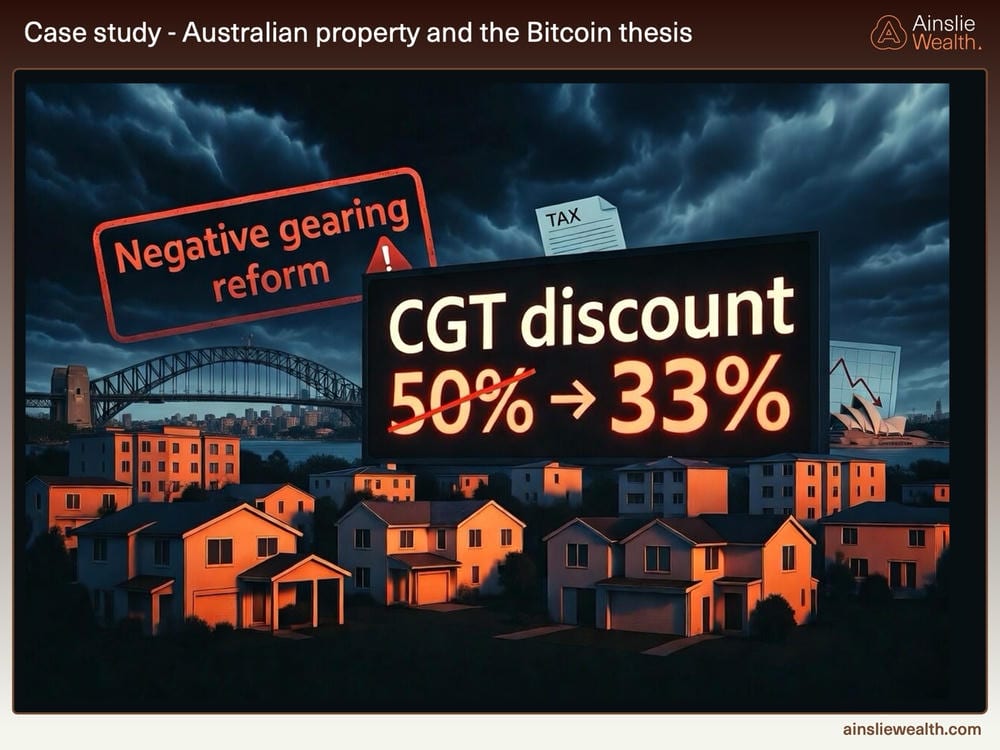
The Australian May federal budget looks likely to cut the CGT discount for investment properties from 50% to 33% and reform negative gearing for investors holding two or more properties. Many Australians built their wealth around property on the assumption that these tax settings were permanent. They were not. Property is a policy‑dependent, illiquid asset. Its value is a direct function of tax treatment, zoning rules, lending conditions, and foreign investment settings, all of which are controlled by governments that increasingly need revenue. In a late‑cycle GLI environment with rising debt servicing costs, the pressure to extract from existing asset pools intensifies. Property is the largest such pool in Australia.
Bitcoin, by contrast, does not have a negative gearing regime to reform. It is a bearer asset, hold the key, hold the asset. You can move it across borders without a lawyer, a settlement agent, or a government registry. Some Australian holders have already relocated Bitcoin offshore to manage tax exposure. That optionality matters more in a fiscal squeeze than it does in a stable environment. We are not arguing that Bitcoin replaces property. But the policy‑risk premium on property is rising while Bitcoin’s is structurally lower. That gap is worth thinking about when allocating capital at the margin.
Conclusion
The GLI framework we laid out in March has been validated by the data. The cycle peaked at 56.1 in December and has contracted to 44.1 by March, a meaningful move that confirms we are past the high. The rate of change is what matters, not the headline nominal level. In the short term, the liquidity picture remains challenging.
The MOVE spring we flagged uncoiled violently, spiking to 112 before pulling back, and the collateral damage to the system lingers even after the index has retraced. Bond market risk is elevated with debt at $38.77 trillion and long‑end yields refusing to come down. For liquidity to genuinely turn, something in the financial system likely needs to break first, prompting real Fed intervention, not just Treasury QE, but actual bond purchases that expand reserves. That is the catalyst we are watching for.
In the longer term, this is exactly the environment that builds the case for patient Bitcoin accumulation. Bitcoin has bounced from $60,000, sits at approximately $71,500, and ETF holders have not capitulated through a $50,000 drawdown from all‑time high. The Iranian settlement discussion and the Australian CGT reform both served as real‑world demonstrations of why Bitcoin’s properties matter, not as marketing talking points, but as functional attributes under genuine stress. Bitcoin appears cheap relative to where the GLI currently sits. The prescription has not changed. Accumulate into weakness, size appropriately for a multi‑year hold, and let the next liquidity cycle do the heavy lifting.
Watch the full presentation with detailed explanations and discussion on our YouTube Channel here: https://www.youtube.com/watch?v=_hAd-VPOXYE
Until we return with more analysis next month, keep stacking those sats!
Joseph Brombal
Research and Analysis Manager
The Ainslie Group
x.com/Packin_Sats
Share this Article:
Crypto in your SMSF
Top Movers


Get Started Trading Crypto with Ainslie.
Join Thousands of satisfied customers who trust Ainslie for their cryptocurrency and bullion needs.