Bitcoin Analysis: Beyond the Block – March 2026
March 13, 2026
News
Today the Ainslie Research team (ainslieresearch.com) brings you the latest monthly update on Bitcoin – including the Macro fundamentals, market and on-chain technical metrics and all of the other factors currently driving its adoption and price. This summary highlights some of the key charts that were discussed and analysed by our expert panel. We encourage you to watch the video of the presentation in full for the detailed explanations – https://www.youtube.com/watch?v=7pSJlwMBwnM
Bitcoin and Global Liquidity
Bitcoin is the most directly correlated asset to Global Liquidity. Trading Bitcoin can be thought of as trading the Global Liquidity Cycle, but with an adoption curve that leads to significantly higher highs and lows each cycle. As such we look to buy Bitcoin during the ‘Bust’ phase or liquidity low, then rotate out of it during ‘Late Cycle’ where liquidity is over extended and downside protection is required (our preference is to rotate into Gold). When correctly timing and structuring the rotation, it is possible to significantly outperform ongoing monetary debasement. The Bitcoin cycle low was in November 2022, and since then the returns have been unmatched by any other major asset.
Where are we currently in the Global Liquidity Cycle?
Welcome to the written report for March Beyond the Block. Those who also view our Beyond the Block podcast on YouTube will be aware of our new product, the Ainslie Bitcoin Bullion Fund. In short, the fund is a wholesale managed fund that actively allocates between Bitcoin, gold, and silver, aiming to deliver strong capital growth while protecting downside risk with precious metals during Bitcoin drawdowns. Our dynamic investment approach is directly guided by the macro and liquidity cycles covered in Beyond the Block analysis, which forms the core foundation of the Fund’s investing framework and asset allocation decisions.
If you qualify as a wholesale investor and would like to learn more about the Ainslie Bitcoin & Bullion Fund, visit our official information page at https://www.ainsliewealth.com/ainslie-bb-fund.
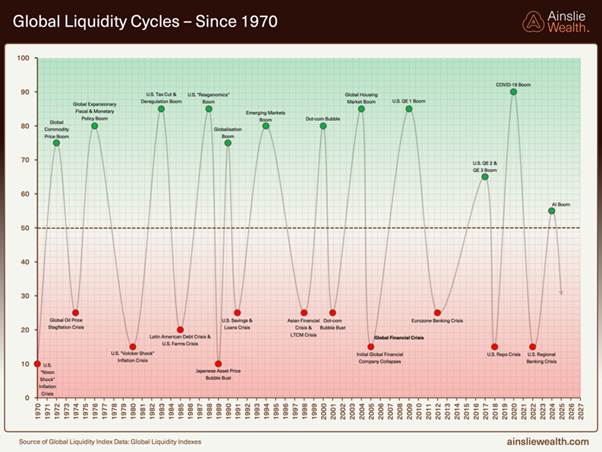
If you’ve been following Beyond the Block for a while, you’ll notice something missing this month. We’ve decided to retire the “macro cycle” scatter chart that usually sits near the top of this report and to lean more heavily on the Global Liquidity Index instead. That’s not because the old framework was useless, but because we’re increasingly convinced this cycle will not play out like the textbook four‑quadrant business cycles of the past.
In February we talked about the two big distortions, AI‑driven deflation on one side and highly targeted fiscal spending on the other. Instead of a classic credit‑driven expansion, we have governments spraying money directly into households, capex and defence while technology quietly strips out costs and headcount in the background. That mix is bending the traditional macro cycle out of shape. Growth and inflation are no longer clean, alternating regimes you can plug into a neat grid, they now coexist in strange ways that make the old macro heat‑map more of a distraction than a signal.
Liquidity, however, still behaves like a cycle. The GLI continues to track the ebb and flow of global money and credit remarkably well, and it remains the single best explainer of Bitcoin’s big moves over time. So, from here on we’re going to treat liquidity as the anchor and the macro cycle as context, not the other way around. This month’s charts are built around that idea and will continue to do so into the future. We’ll show why we think the current liquidity cycle has already peaked in time terms, how late‑cycle rotations across equities, commodities and Bitcoin fit into that picture, and why, even in a tired liquidity regime, disciplined sats‑stacking still has probability on its side.
Recently, the AI boom has lined up almost perfectly with the point where this global liquidity cycle appears to have peaked. We could be wrong, but we simply cannot see a credible source of additional liquidity in the near term that would drive this cycle meaningfully higher. At this stage, any renewed surge in liquidity would most likely require some kind of funding or credit stress. For example, a spike in sovereign or corporate funding costs, a geopolitical shock that rattles energy and bond markets, or a disorderly move higher in yields that forces large leveraged players to de‑risk. Episodes like that tend to produce the kind of bond‑market volatility that eventually elicits an aggressive policy response from the Fed, which could then push our index to new highs. With the average liquidity cycle running around 65 months, caution is warranted at this late stage of the cycle, and it is entirely possible that we do not see the next true liquidity bottom until late‑2027.
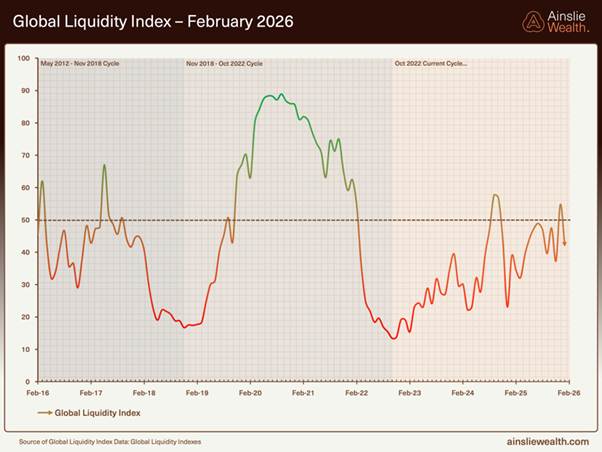
The next chart zooms in on the Global Liquidity Index over the past decade. It captures the COVID‑era surge in liquidity, the aggressive tightening into 2021–22, and the AI‑era rebound that has pushed the index back towards neutral. Rather than a clean, early‑cycle uptrend, the GLI looks to be running out of steam with sharp rallies in liquidity that quickly lose momentum, followed by equally sharp drawdowns. That kind of choppy, sideways action is exactly what you tend to see when a liquidity cycle is rolling over in stages rather than launching into a fresh multi‑year expansion.
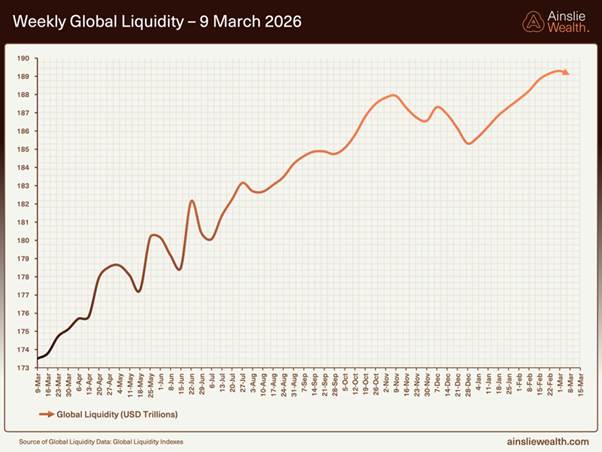
The headline liquidity figure remains at around US$189 trillion, unchanged in real terms from last week and still reflecting a healthy 12‑month growth rate. That sounds supportive at first glance, but it also highlights why the level of liquidity only tells part of the story. What really matters for risk assets is the momentum of that flow, whether liquidity is accelerating or decelerating at the margin. Because the current growth rate is flattered by weak base effects from a year ago, those comparisons will soon roll off, and the headline number is likely to slow even if the absolute stock of liquidity stays high. In other words, we are closer to the point where liquidity stops getting “better” than markets that trade off this index might assume.
On top of that, the split between East and West reinforces this message: developed‑market central banks are collectively withdrawing liquidity while emerging‑market central banks, led by China, are still adding. The global total looks fine, but the underlying momentum is uneven and increasingly reliant on a single engine, which makes the overall backdrop more fragile than the headline chart suggests.
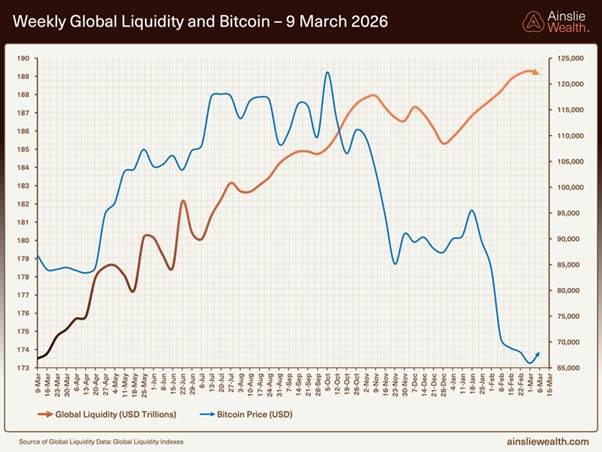
The chart below overlays weekly global liquidity with the Bitcoin price. While the two have recently not moved in lockstep, we continue to believe Bitcoin is ultra‑sensitive to changes in liquidity and tends to be a forward‑looking expression of that trend. Historically, Bitcoin has often moved first when the momentum of liquidity has turned, with price leading the inflection rather than simply following the level of the index. That helps explain the current divergence, global liquidity is still grinding higher, but Bitcoin has sold off sharply, as if it is already pricing in the late‑cycle headwinds we highlighted above.
For us, the combination of a maturing liquidity cycle, but a Bitcoin price that now sits unusually low relative to the Global Liquidity Index, creates an attractive asymmetrical setup. We can see clear macro headwinds for liquidity from here, yet even a modest positive surprise or policy wobble could see Bitcoin mean‑revert back towards the trajectory of liquidity, offering significantly more upside than downside over a multi‑quarter horizon.
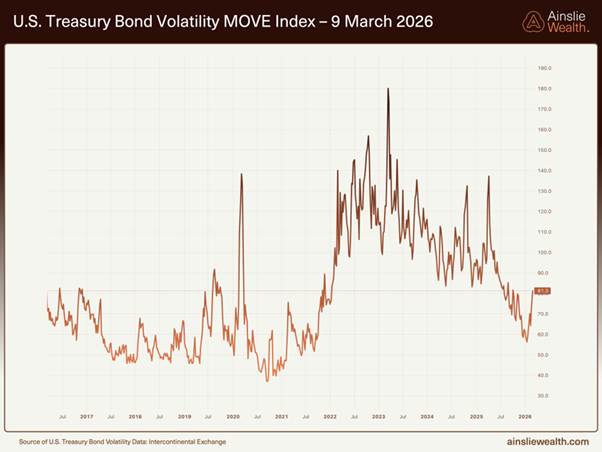
Last month we noted that ultra‑low readings in the MOVE index, the market’s gauge of expected volatility in U.S. Treasury yields, were a classic “priced for perfection” signal. They told us bond collateral was being treated as rock‑solid and funding markets were relaxed, which is usually supportive for risk assets, but they also left very little margin for error. When rate volatility is crushed, the whole system leans harder on the assumption that yields will stay quiet, so any surprise move can force outsized haircuts, margin calls, and deleveraging right when liquidity is most vulnerable.
This month’s uptick in the MOVE index suggests that coiled spring is starting to expand. A rising MOVE reading means the cost of hedging rates is increasing and dealers demand more protection, which tightens financial conditions and can drain liquidity from other asset classes. In practical terms, it is a reminder that the benign backdrop we saw in February was not a new normal but a fragile equilibrium, as soon as bond volatility begins to re‑price higher, the same mechanism that previously supported risk assets can flip and become a headwind.
Macro Indicators
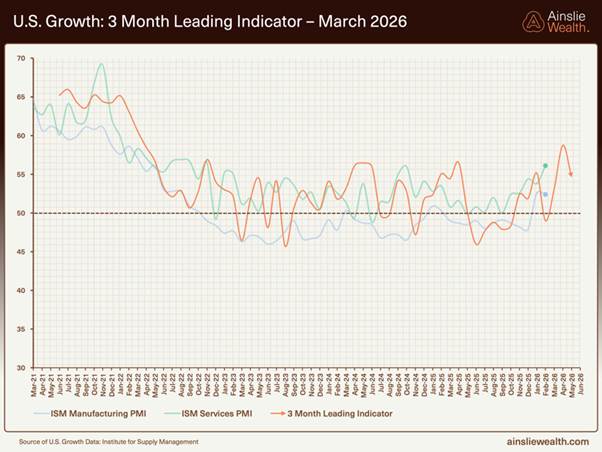
The latest ISM data keep our U.S. growth thesis intact. Manufacturing slipped slightly in February to 52.4, but that was still above expectations and marked a second month back in expansion territory. Services were stronger again, with the ISM Services PMI jumping to 56.1 – its best reading since mid‑2022 and well ahead of forecasts. Taken together, our 3‑month leading indicator has pushed further above the 50 line, signalling that Main Street activity is still being propped up even as financial conditions stay relatively tight.
This fits neatly with our view that the U.S. government and Treasury are effectively trying to put a floor under “high street” growth via fiscal support and quasi‑QE in the front end, even while the Fed keeps policy restrictive. Growth momentum is not booming, but it is clearly better than the recessionary fears that dominated a year ago, which helps explain why risk assets and employment have remained resilient despite late‑cycle liquidity pressures.
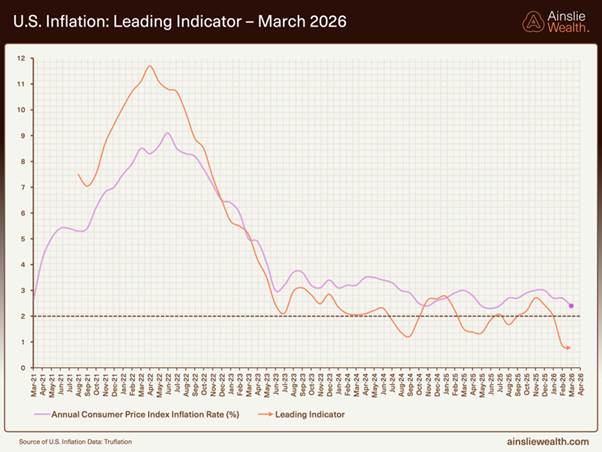
Our inflation lead indicator continues to point lower over the next few quarters, even as headline risks build around energy. The Iran conflict has already pushed oil and gasoline prices sharply higher, at the margin this will lift the energy component of CPI and could produce a temporary bump in headline inflation prints. But for now, we see this more as a tax on consumers layered on top of a slowing economy than the start of a new, broad‑based inflation cycle. Without a parallel acceleration in wages or demand, energy shocks tend to fade out of the data once the base effects roll through.
That view is reinforced by what is happening in the labour market. The latest jobs report showed the U.S. economy losing around 92,000 jobs in February, with the unemployment rate ticking up to 4.4% and the labour‑force participation rate slipping back to 62%, its lowest since late 2021. Combined with AI‑driven productivity gains, excess capacity in parts of the economy, and ongoing cost‑cutting, these trends point to powerful deflationary forces re‑asserting themselves once any near‑term energy spike washes through. In that world, the bigger medium‑term risk remains growth rolling over into a disinflation/unemployment problem that eventually drags central banks toward deeper cuts and, if needed, full‑blown QE, a backdrop that has historically been far more supportive for Bitcoin and global liquidity than for the real economy.
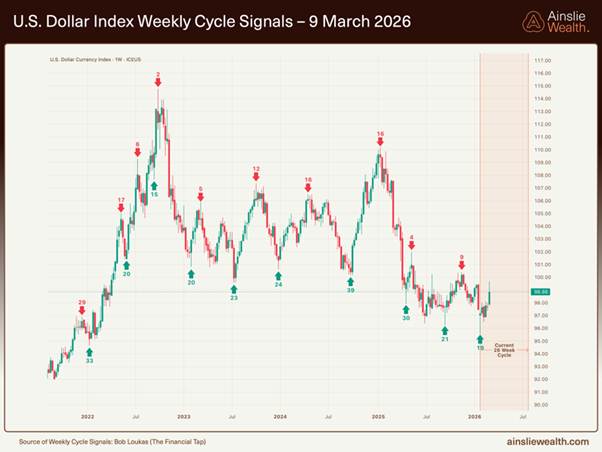
One of the biggest swing factors for global liquidity from here is still the U.S. dollar. Because so much of the world’s debt is denominated in dollars, every sustained move higher in the DXY tightens financial conditions for offshore borrowers, making their debt harder to service and effectively draining liquidity out of the system. A softer or even broadly range‑bound dollar does the opposite, easing the real burden of dollar debt and freeing up more capital to flow into financial assets. This month the dollar has bounced modestly off the lows of its post‑2022 range, which is a small headwind for liquidity, but even with the escalation in Iran there has been no meaningful “risk‑off” dollar spike. Price action still looks more like noise within a range than the start of a dollar squeeze.
On our weekly cycle chart, the DXY therefore remains effectively range‑bound, with the bigger macro shift still likely to come from the policy side rather than from geopolitics alone. If weaker inflation and rising unemployment eventually force the Fed into a full cutting cycle and, in time, back to QE, that combination would almost certainly drive the dollar lower and act as a powerful tailwind for global liquidity. We are not there yet, but worth keeping an eye on.
Liquidity Cycle Headwinds Continue
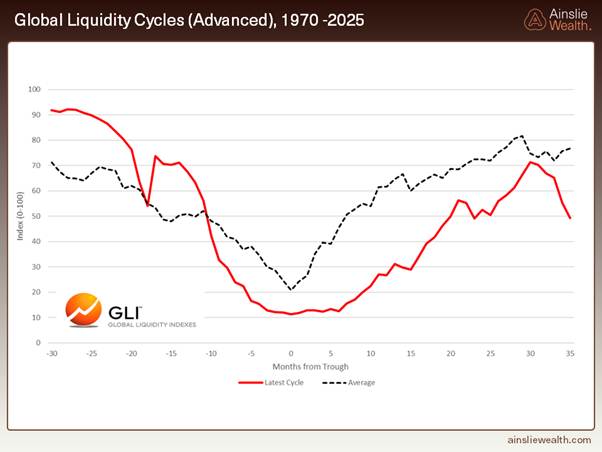
When you line this cycle up against the history back to 1970, the conviction call isn’t about the exact level of the index, it is about time. This upswing has now run for roughly 30 months from the trough, which is bang in line with the average length of past liquidity expansions. Liquidity cycles tend to die of old age, not exhaustion, once you’ve had two‑and‑a‑half years of easing and reflation, you are statistically in the danger zone, even if the line is still grinding sideways near the highs rather than rolling over in a dramatic spike top.
From here the risk/reward on liquidity is asymmetric. The upside is usually limited to a bit more chop and the occasional marginal new high in the index, while the downside is an 18–24 month slide back toward the next trough. On a regular cycle, that would put the next true liquidity low somewhere in late‑2027.
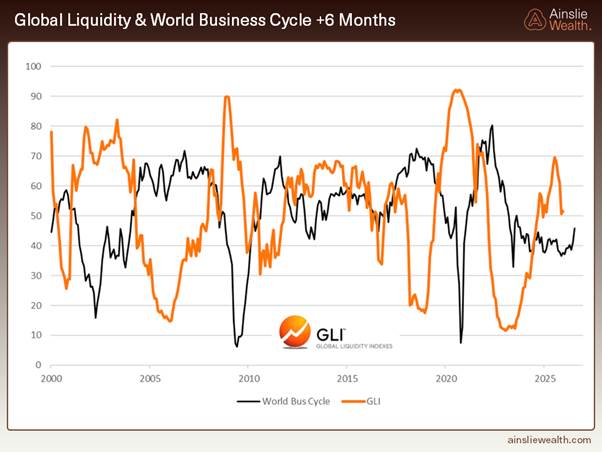
One thing that often confuses people is why liquidity and the business cycle tend to move in opposite directions. Our read is that liquidity usually moves first. When growth is soft and the business cycle is rolling over, policymakers reach for the usual toolkit, rate cuts, QE and fiscal deficits to pump liquidity into the financial system. About six months later that extra liquidity starts to show up in the real economy as firmer PMIs, stronger employment and rising commodity demand. Once the business cycle is clearly improving, the political pressure for aggressive stimulus fades, central banks and treasuries step back, and the liquidity cycle starts to roll over even as growth is still looking good. That’s why in this chart Global Liquidity (ex‑China) leads the World business cycle by roughly six months, and why strong macro prints later in 2026 would actually make us more cautious on liquidity, not less.
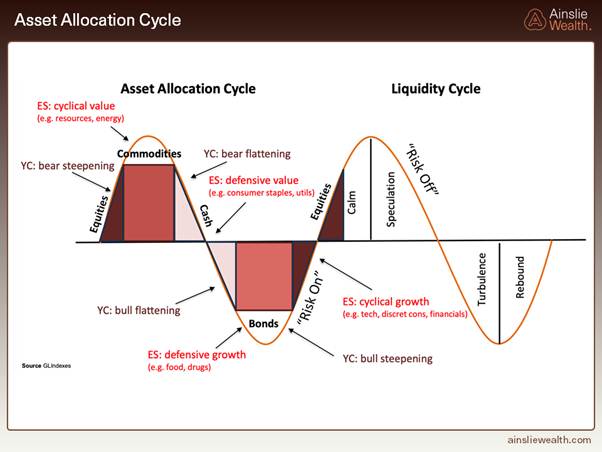
This chart lines up the liquidity cycle on the right with how capital usually rotates across risk assets on the left. Early in the upswing, when liquidity is easy and expanding, the market naturally piles into higher‑beta trades, growth stocks, speculative tech, smaller caps and, in our world, Bitcoin. That’s the phase where “risk‑on” works almost regardless of entry, because the rising tide of liquidity is doing most of the heavy lifting.
As the liquidity wave turns over and starts to lose momentum, that leadership changes. The high‑octane growth names and other speculative risk assets begin to struggle on a relative basis, and money quietly rotates into harder assets, defensives, commodities and resource stocks first, then more traditional defensive sectors like consumer staples and utilities. The fact that we’re now seeing exactly that pattern with growth and high‑beta lagging while commodities and defensives catch a bid, is another tell that we’re moving into the later innings of this liquidity cycle.
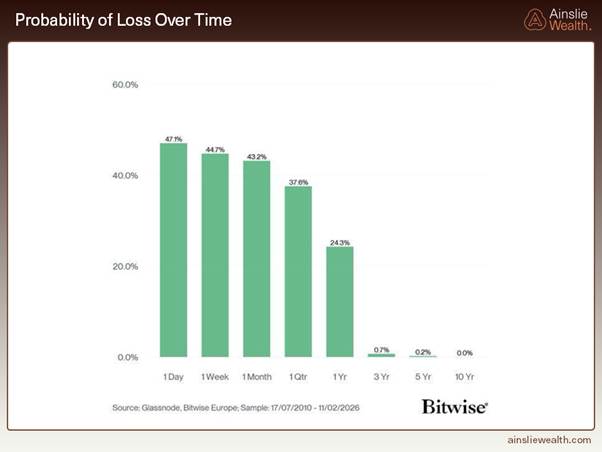
Back to Bitcoin specifically. This Bitwise chart looks at every possible holding period for Bitcoin from 2010 to today and asks a simple question: “What are the odds I’m underwater?” Over a 1‑day or 1‑week window the answer is basically a coin toss, with the probability of loss hovering around 45–50%. Stretch that out to a quarter and it drops into the high 30s; by one year it’s down in the mid‑20s. Push your horizon out to three years and the probability of being in the red collapses to less than 1%, and over five‑ and ten‑year windows it rounds to effectively zero.
That’s the game we play with Bitcoin, volatility is a feature, not a bug, so use it to your advantage. Time in the asset matters far more than trying to perfectly time entries. If you treat Bitcoin like a short‑term trade, the volatility will punish you. If you treat it like a long‑duration monetary asset and keep adding during late‑cycle drawdowns like we’re in now, history suggests the odds tilt heavily in your favour. This is exactly the environment where disciplined accumulation at depressed prices does the heavy lifting for future returns, even if the next few months remain noisy.
Conclusion
Over the past few months our framework has shifted. We still care about growth and inflation, but they’ve taken a back seat, with the global liquidity cycle now doing most of the driving for asset allocation. The data this month reinforce that view: the real economy is still holding up – ISM surveys in expansion, unemployment only just starting to drift higher – yet our liquidity work says we’re late in the current cycle and grinding through a choppy, distribution phase rather than kicking off a fresh expansion. If the historical timings hold, that points to a true liquidity bottom sometime around late‑2027, which is the window we’re working with as investors.
Bitcoin has once again shown itself to be the most sensitive, forward‑looking expression of liquidity. It’s already leading the leg lower even while the headline level of global liquidity and the dollar still look “fine” on the surface. That hurts in the short term, but it’s also where the long‑run money is made. Buying a structurally scarce asset when it’s trading cheap versus our liquidity framework, not when everything feels easy. We can see plenty of scenarios that would eventually force the Fed to step up support, a proper funding squeeze, a disorderly move in bonds, or a deeper rollover in growth and employment, but we’re not there yet, and the charts don’t justify trading as if the cavalry has already arrived. For now, we’re in a late‑cycle environment with clear liquidity headwinds, a still‑growing economy, and a Bitcoin price that has moved well ahead of the deterioration we actually see. In our view, that combination offers attractive asymmetrical risk‑reward for patient capital willing to accumulate into weakness and let the next liquidity cycle do the heavy lifting.
Watch the full presentation with detailed explanations and discussion on our YouTube Channel here: https://www.youtube.com/watch?v=7pSJlwMBwnM
Until we return with more analysis next month, keep stacking those sats!
Joseph Brombal
Research and Analysis Manager
The Ainslie Group
x.com/Packin_Sats
Share this Article:
Crypto in your SMSF
Top Movers


Get Started Trading Crypto with Ainslie.
Join Thousands of satisfied customers who trust Ainslie for their cryptocurrency and bullion needs.