Bitcoin Analysis: Beyond the Block – January 2026
January 15, 2026
News
Today the Ainslie Research team (ainslieresearch.com) brings you the latest monthly update on Bitcoin – including the macro fundamentals, market and on-chain technical metrics, and all of the other factors currently driving its adoption and price. This summary highlights some of the key charts that were discussed and analysed by our expert panel. We encourage you to watch the video of the presentation in full https://www.youtube.com/watch?v=LJHaCjrU2lI for the detailed explanations.
Bitcoin and Global Liquidity
Bitcoin is the most directly correlated asset to global liquidity. Trading Bitcoin can be thought of as trading the global liquidity cycle, but with an adoption curve that leads to significantly higher highs and lows each cycle. As such, we look to buy Bitcoin during the ‘bust’ phase, or liquidity low, then rotate out of it during ‘late cycle’, where liquidity is overextended and downside protection is required (our preference is to rotate into gold). When correctly timing and structuring the rotation, it is possible to significantly outperform ongoing monetary debasement. The Bitcoin cycle low was in November 2022, and since then the returns have been unmatched by any other major asset.
Where Are We Currently in the Global Macro Cycle?
Welcome to the written report for January Beyond the Block. Those who also view our Beyond the Block podcast on YouTube will be aware of our new product, the Ainslie Bitcoin Bullion Fund. In short, the fund is a wholesale managed fund that actively allocates between Bitcoin, gold, and silver, aiming to deliver strong capital growth while protecting downside risk with precious metals during Bitcoin drawdowns. Our dynamic investment approach is directly guided by the macro and liquidity cycles covered in Beyond the Block analysis, which forms the core foundation of the Fund’s investing framework and asset allocation decisions.
If you qualify as a wholesale investor and would like to learn more about the Ainslie Bitcoin & Bullion Fund, visit our official information page at https://www.ainsliewealth.com/ainslie-bb-fund.
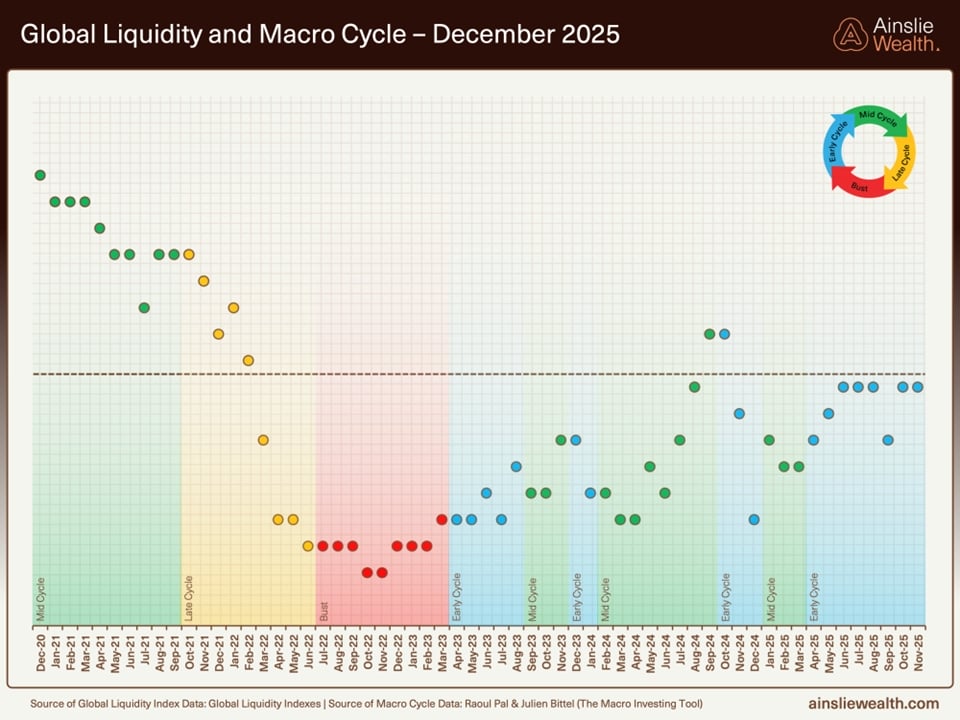
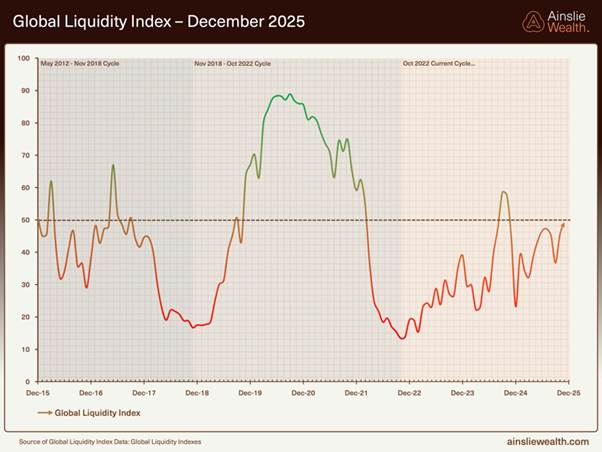
Our macro positioning remains early cycle, with liquidity sitting around neutral, just below 50. We are now leaning more towards the liquidity cycle as the most important indicator, with less emphasis on the macro cycle. This is a variation from our previous framework, where we would wait for liquidity to peak and then time the exit from risk assets based on growth and inflation, i.e. the macro cycle.
Though shallow, we believe the liquidity cycle peak may well be in, based on its current length of 65 months, which is closely linked to the average maturity of global debt. Let’s dive deeper.
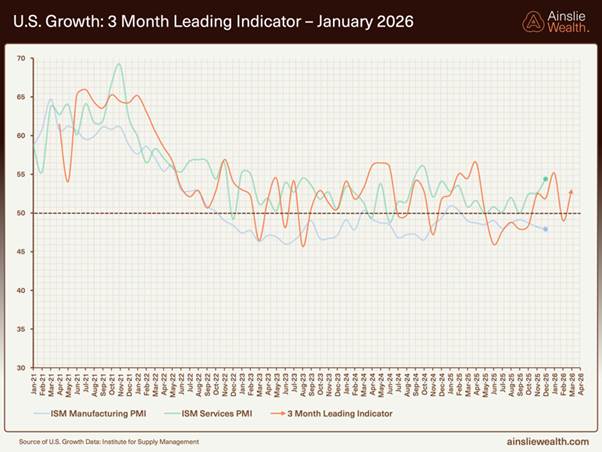
We will again focus on PMIs coming out of the United States. For some time now, we have been arguing that the Trump administration’s focus is on Main Street. With services making up over 70% of the U.S. economy, fiscal spending is certainly having the desired effect there. Bringing manufacturing back to the U.S. is also a stated priority for the administration; however, it is becoming increasingly clear that this is either not going to occur or will be an extremely slow burn, taking many years to eventuate.
Regardless of whether growth is picking up, our concern remains that there is not enough liquidity flowing into financial assets and that it is instead finding its way into the real economy. Historically, in the age of QE, stimulus followed a top-down approach, with financial assets benefiting the most as they were closest to the creation of money. Currently, fiscal deficit spending by the government is going directly into the pockets of consumers, eventually finding its way into financial markets — a bottom-up approach.
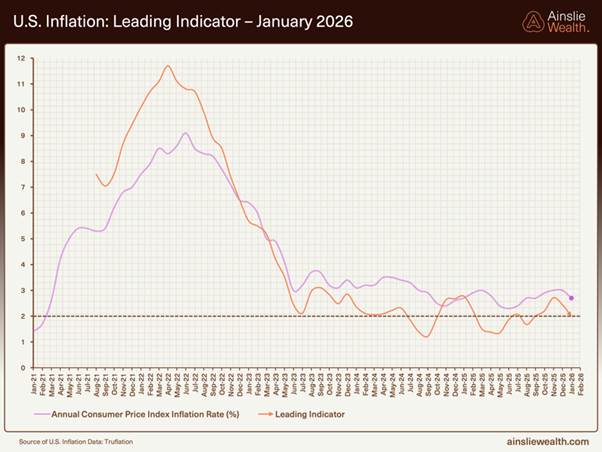
The problem with a bottom-up approach is that the money flows directly to consumers, making it more likely that inflation stays elevated, or at least above target. We have previously argued that the Federal Reserve’s 2% inflation target is unlikely to be met given the large fiscal deficits the U.S. Treasury is now running. A simple analogy: what is more inflationary — giving a billionaire a billion dollars via rising asset prices, or putting a thousand dollars directly into a million people’s bank accounts?
Where are we currently in the Global Liquidity Cycle?
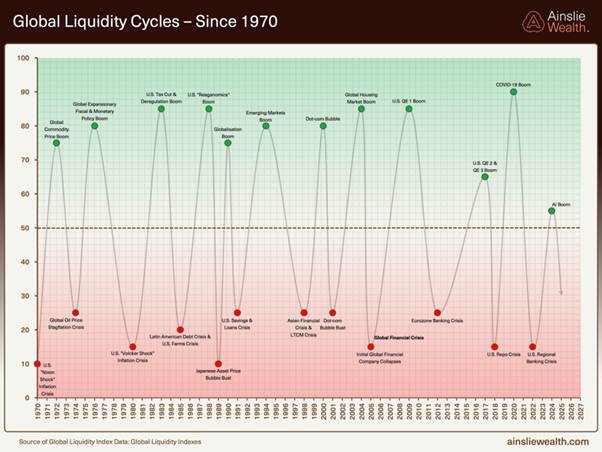
Recently, the AI boom has been added at the point where we believe this global liquidity cycle has peaked. Of course, we could be wrong, but we simply cannot see where additional liquidity would come from to drive this cycle significantly higher. It would likely take some kind of crisis, potentially in the debt markets, followed by action from the Federal Reserve to push our index to new highs. With the average liquidity cycle lasting around 65 months, caution is warranted at this stage.
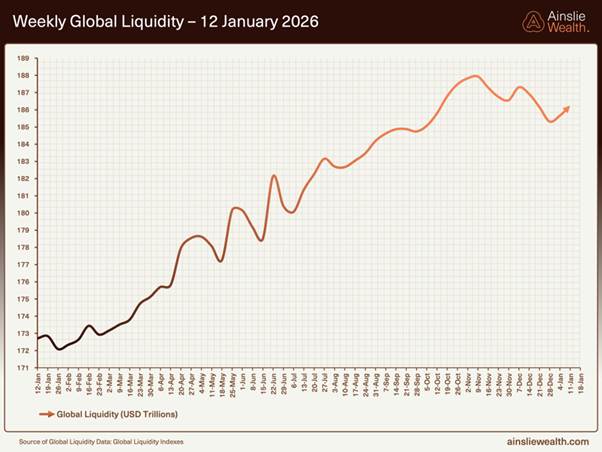
Below is a more detailed chart over a shorter time frame than the previous one. Liquidity has ticked up slightly towards the neutral line; however, it is increasingly clear that the duration of this liquidity cycle is getting long in the tooth.
We are not suggesting for a moment that liquidity in nominal terms will not continue to rise, as that may well be the case. The incentives are there to keep the economy going and financial markets stable, particularly with policy from the Fed such as reserve-management operations that aim to keep bank reserves in the “ample” zone, the use of standing repo and related facilities to backstop funding markets, and a pace of balance-sheet runoff calibrated to avoid a repeat of past liquidity squeezes. We simply argue that the momentum is not there to continue inflating asset prices.
We’re introducing a new chart this month. The MOVE Index tracks implied volatility on U.S. Treasury options across key maturities, giving a real-time read on how unstable, or calm, the risk-free rate is. When the MOVE is low, markets are signalling confidence that Treasury yields will stay within a relatively narrow band. When it spikes, it is a sign that investors are scrambling for protection against large moves in yields, often around policy surprises, inflation shocks, or funding stress.
From a liquidity and collateral perspective, this matters enormously. U.S. Treasuries sit at the top of the collateral pyramid, and their prices are a key input into margin models and haircuts across the system. When the MOVE Index is elevated, the message is that Treasury prices are less predictable. Dealers, clearing houses, and risk managers respond by widening haircuts, raising margins, and shrinking balance-sheet capacity. In practice, that means the same pile of Treasuries supports less leverage and fewer trades, effectively draining liquidity even if nominal reserve balances haven’t changed much.
The opposite is also true. A subdued MOVE Index signals stable collateral values and lower perceived interest-rate risk. Haircuts can be kept tight, term funding is easier to roll, and dealers are more willing to intermediate flows. In that environment, global liquidity feels abundant because the core collateral of U.S. government bonds can be rehypothecated and leveraged more aggressively without tripping risk limits. In short, the MOVE Index is a clean, high-frequency gauge of how usable Treasury collateral is, and therefore how much liquidity the system can safely squeeze out of the same stock of assets.
Currently, the MOVE Index is making new lows on a consistent basis, and while that is great for collateral values, we are certainly closer to the bottom than the top. This means there is less “juice to squeeze” from collateral values than in recent ye
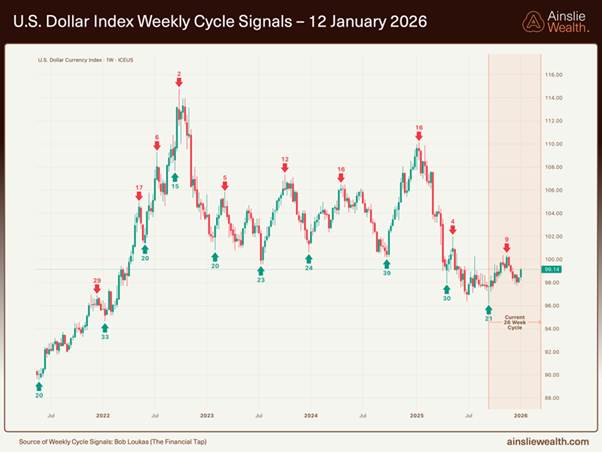
With that said, what would change our somewhat negative view of liquidity in the short to medium term? One of the largest influences on global liquidity is the value of the U.S. dollar against other currencies. A substantial share of international debt claims is denominated in U.S. dollars, which means that as the dollar strengthens against a borrower’s local currency, that debt becomes harder to service and liquidity is effectively sucked out of the financial system, particularly if the move is rapid.
Conversely, if the U.S. dollar weakens or even remains broadly stable, dollar-denominated debt is easier to service and more capital can flow into financial assets. If the dollar were to weaken significantly from here due to unforeseen policy, such as QE or regulatory changes, our liquidity index could move higher. If President Trump gets what he wants, that may well be the case.
Long Term, Follow the Money!
Following our rather dim view of where we think global liquidity will be over the coming months, we now extend our time frame to look at the secular trend of Bitcoin through the lens of government policy, as well as institutional demand and adoption.
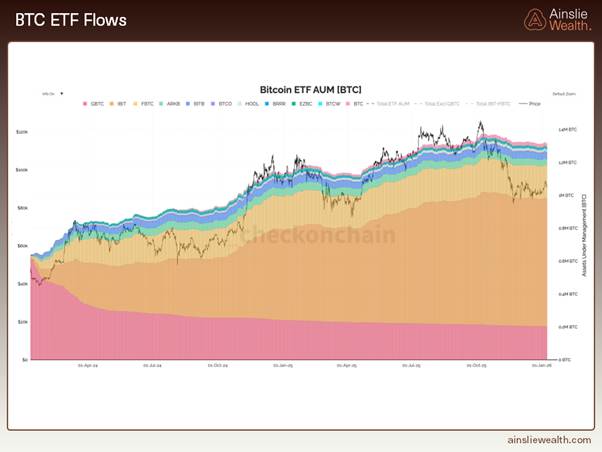
It’s obvious BTC ETF flows have cooled materially. The early surge in ETF demand has flattened out and, at the margin, even tipped slightly negative. However, when you consider the pullback in price and poor sentiment, what stands out is how little outright liquidation there has been. Investors have largely held their nerve, with total ETF AUM in BTC terms barely giving back any of the prior run-up, which speaks to positioning that is consolidating rather than capitulating.
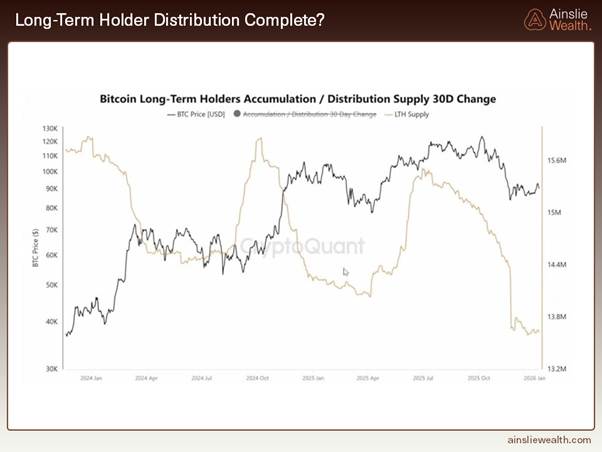
Long-term holders are defined here as those who buy and hold Bitcoin for more than 155 days. Generally speaking, we would not define a long-term holder of any investment by just 155 days, but that is how this chart is constructed. Regardless, the chart shows long-term holders distributing into strength while buying during periods of consolidation after large pullbacks.
One important nuance with this metric is that “movement” of coins on-chain does not automatically mean they were sold. Coins drop out of the long-term holder bucket any time they are spent to a new address, but that can reflect all sorts of internal activity. An investor could be rotating custody setup, an exchange could be reshuffling cold storage, coins moving into a multisig, or an OTC transfer where the economic owner is still effectively the same. In each of those cases, the data will register a decline in long-term holder supply even though no market sale took place, so apparent “distribution” should always be read with that caveat in mind.
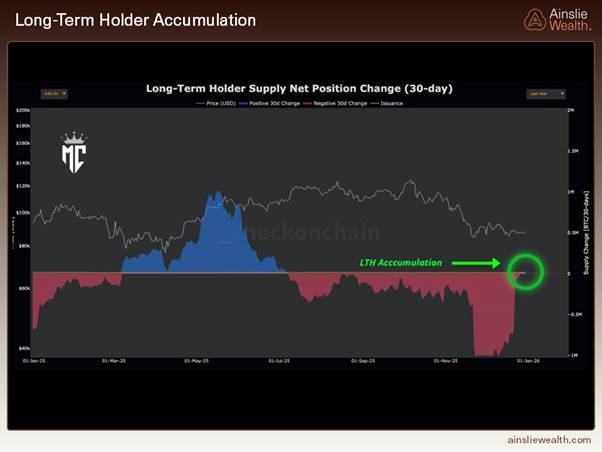
The same data, but zoomed in using net position change, shows that the trend has just started to turn. Historically, changes in long-term holder accumulation and distribution can persist for many months.
Looking back on Bitcoin’s 2025, it’s fair to say it did not deliver the positive price action many expected, even after reaching a new all-time high of USD 126,000 in October. That said, memory in the digital asset space is short, and a longer-term investing perspective would be beneficial to most participants.
The next two tables outline Bitcoin’s 2025 milestones that do not directly relate to price, but instead drive the long-term secular adoption of the asset. They are worth keeping in mind the next time price becomes the overarching narrative. In the short run, the market is a voting machine, but in the long run, it is a weighing machine.
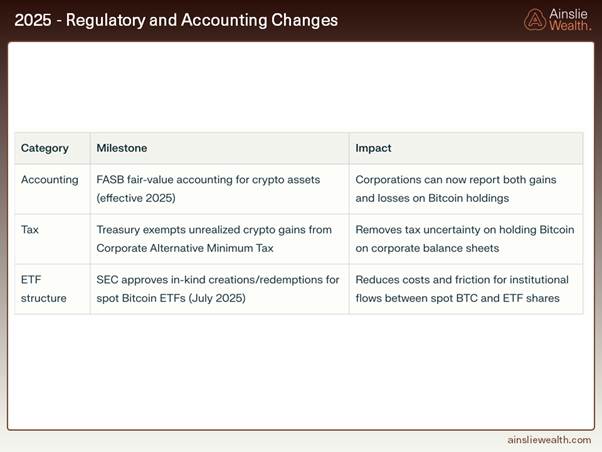
- • FASB fair-value accounting (from 2025):
Moving Bitcoin from “indefinite-lived intangible” into fair-value treatment means corporates can now show both upside and downside in earnings rather than booking one-way impairments and never writing values back up. This turns BTC from an accounting headache into something a CFO can justify to an audit committee, a credit analyst, and ultimately a board that is judged on reported ROE and EPS, not just “number go up on a slide”. - • Treasury exempting unrealised crypto gains from the CAMT:
Clarifying that unrealised fair-value gains on Bitcoin do not get swept into the Corporate Alternative Minimum Tax removes the tail risk that treasuries would owe tax on paper gains every year. - • SEC approval of in-kind creations/redemptions for spot BTC ETFs:
Allowing authorised participants to deliver and receive Bitcoin, rather than only cash, dramatically improves the plumbing. It tightens tracking between ETF and spot, lowers frictional costs for liquidity providers, and makes it easier for institutions that already custody BTC to move in and out of the ETF wrapper efficiently. That, in turn, supports deeper secondary‑market liquidity and larger allocations from investors who are only willing to touch an ETF.
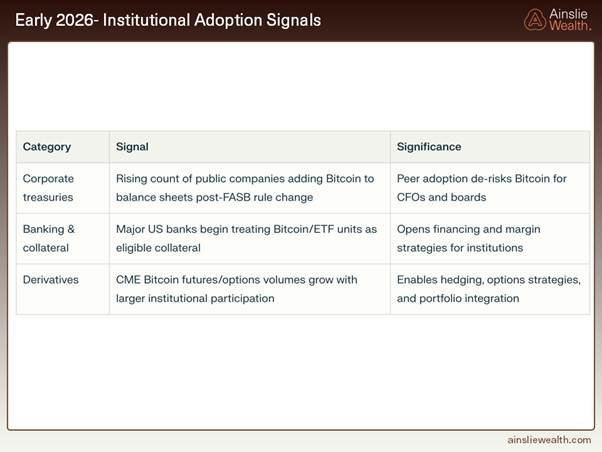
- Rising number of public companies adding BTC to balance sheets:
Each incremental corporate that discloses a Bitcoin position chips away at the “career risk” for the next CFO. Peer adoption is how new instruments move from eccentric to standard; once a critical mass of benchmarked names hold BTC, not looking at the asset becomes the outlier behaviour. That shift in norms is what ultimately allows mandates and investment policies to be rewritten around Bitcoin rather than against it.
- Major US banks treating BTC / ETF units as eligible collateral:
When core banks and prime brokers accept Bitcoin exposure (often via ETFs) as collateral, it stops being a standalone speculative side‑bet and starts functioning inside the credit system. That means more repo eligibility, more term financing, and the ability to lever positions or raise cash against holdings without selling. For large institutions, the ability to fund and collateralise an asset is almost as important as its expected return.
- Growing CME Bitcoin futures and options volumes with institutional participation:
A deep, regulated derivatives curve is what lets real money size up. As CME futures and options open interest grows and the mix shifts towards asset managers and macro funds, Bitcoin becomes easier to hedge, easier to use in complex strategies, and easier to fit inside existing risk frameworks. That reduces volatility at the margin, tightens the link between spot and derivatives, and makes BTC look and feel more like any other macro asset in the toolkit.
Conclusion
Pulling this article together, until something changes, we believe the market is late in the liquidity cycle, not early. The global liquidity impulse has rolled over and, with an average 65‑month cycle already looking long in the tooth, the momentum that drove the 2020–2021 boom is simply not there. Policy is now leaning on reserve‑management operations and balance‑sheet calibration just to keep funding markets orderly, while structurally large fiscal deficits tug in the opposite, more inflationary direction. We think inflation is more likely to bounce around above 2%, rather than neatly converge on the Feds target. Real rates are unlikely to revisit the zero‑bound era, and the dollar remains the main valve on global conditions as its strength or weakness tightens or eases the servicing cost of the world’s dollar debt.
For Bitcoin, the above caps near‑term upside and keeps price action range bound, but it also reinforces the long‑term value proposition. Supply is fixed, policy is structurally loose, and the legal and institutional rails around accounting, tax, collateral and derivatives are now being rebuilt in its favour. The marginal buyer is slowly shifting from speculative retail to corporates, asset managers and banks operating inside a framework that increasingly treats Bitcoin as acceptable collateral rather than a curiosity. Those changes do not show up cleanly in month‑to‑month candles, but they are precisely the kind of slow‑moving adoption trends that matter to the market’s weighing machine over the coming cycle.
Watch the full presentation with detailed explanations and discussion on our YouTube Channel here: https://www.youtube.com/watch?v=LJHaCjrU2lI
Until we return with more analysis next month, keep stacking those sats!
Joseph Brombal
Research and Analysis Manager
The Ainslie Group
x.com/Packin_Sats
Share this Article:
Crypto in your SMSF


Get Started Trading Crypto with Ainslie.
Join Thousands of satisfied customers who trust Ainslie for their cryptocurrency and bullion needs.