CRYPTO MARKET EQUILIBRIUM: A PRELUDE TO POTENTIALLY BIGGER MOVES
May 30, 2023
A Market Poised for Action: Bitcoin’s Clues
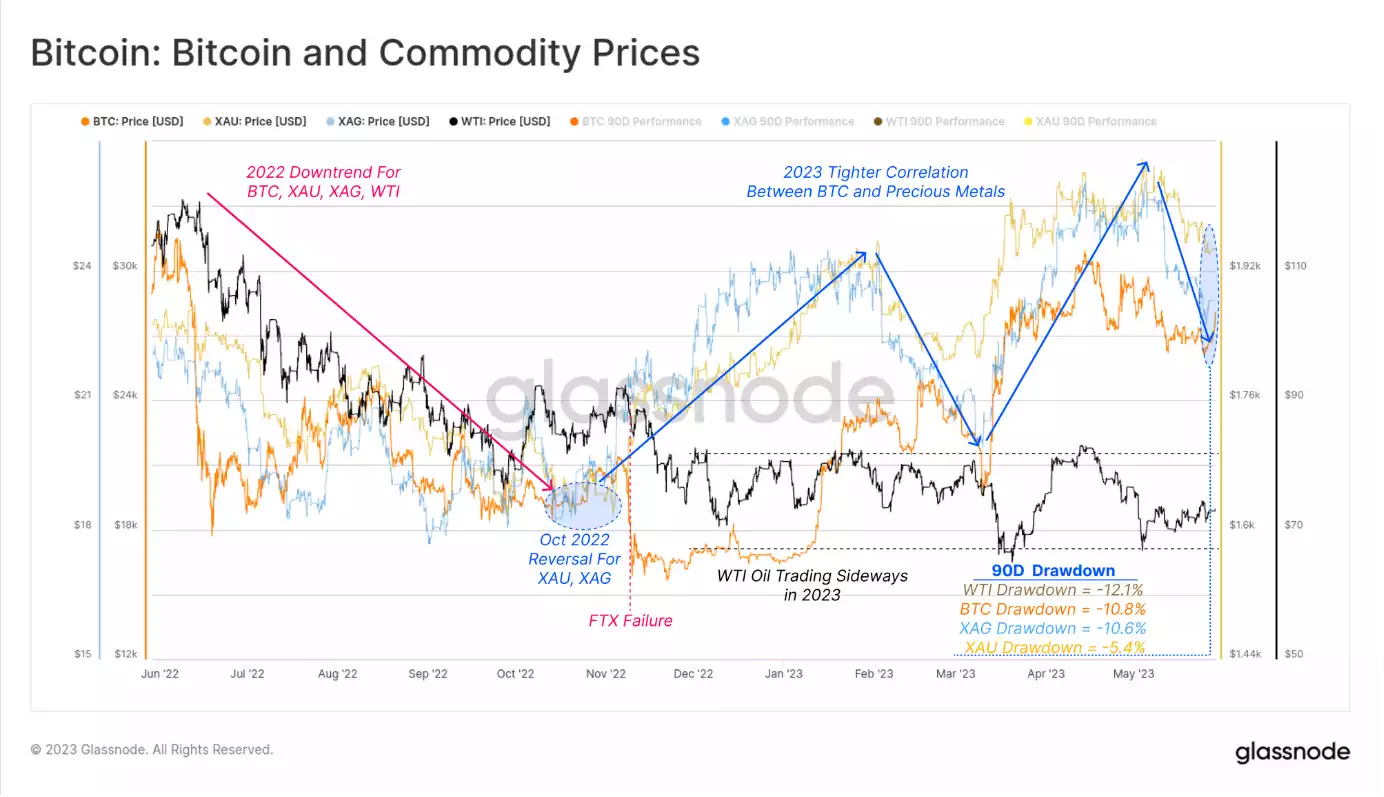
In an interesting development, the Bitcoin market, currently at a balance, shows signs of an imminent shift due to tightening prices and the prospect of volatility. A subtle uptick in spending by Long-Term Holders (LTH) points to possible market movements that investors should keep their eyes on. Since October 2022, there’s been a clear uptick in global market liquidity, positively affecting digital assets and precious metal prices. This liquidity surge is reflected in strong interconnectivity between asset classes.
However, even in this environment, Bitcoin and Silver are experiencing their second uptrend correction of the year based in USD. They’re both down by 10.8% and 10.6% respectively from their 90-day high figures. But Gold seems to be weathering the storm better, with a drawdown of only 5.4%, showing its robust resistance to market fluctuations. In contrast, WTI Crude Oil prices continue to grapple with market uncertainty, declining by 12.1% from its high point in April.
Crypto Outperforms Commodities: The Silver Lining
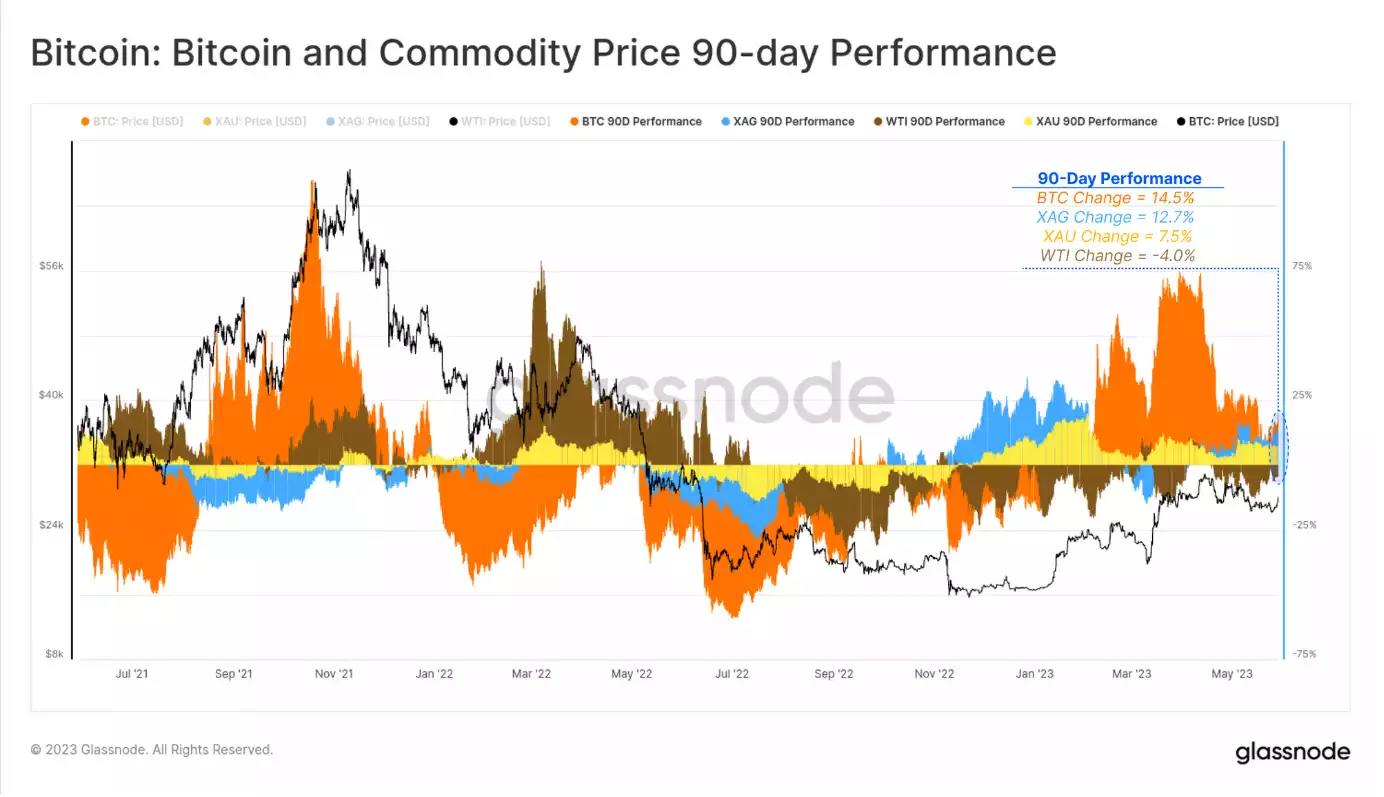
Amid these movements, there’s been a significant development in the commodities market. In the last 90 days, while Crude Oil (WTI) has seen a decline of 4.0%, Gold and Silver have made considerable strides. Gold registered an uptick of 7.5%, and Silver shot up by 12.7%. But, Bitcoin, the digital asset poster child, is maintaining an impressive lead, sitting 14.5% above its close in February.
Despite Bitcoin’s performance weakening relative to its first-quarter peak of 72%, it remains the strongest performer among these major commodities.
A Dip in Volatility: A Respite Before the Storm?
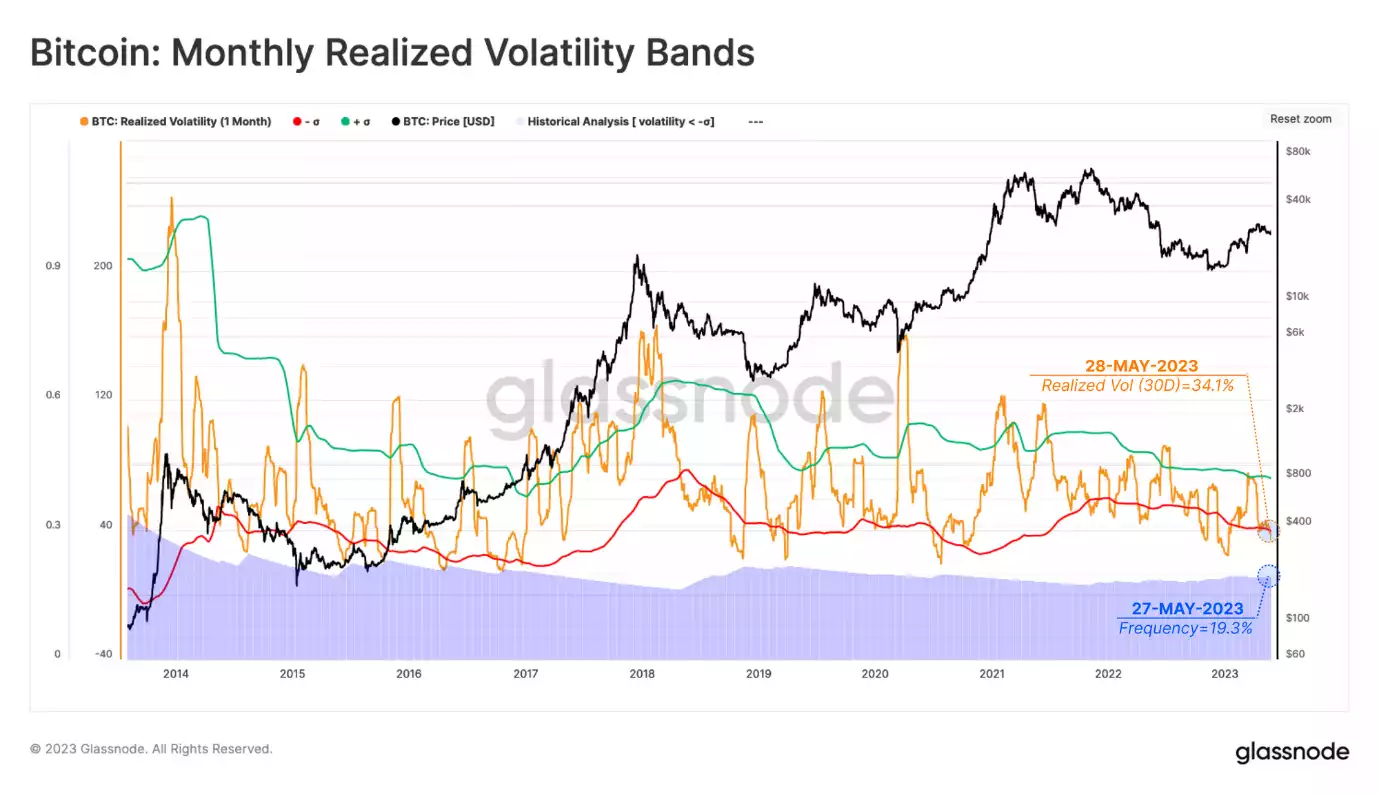
The Bitcoin market is seeing a dip in momentum, as the Monthly Realised Volatility has slid to 34.1%. This decrease signals lower levels of market volatility, falling below the 1-standard deviation Bollinger Band. Notably, such low-volatility regimes are relatively infrequent, representing only 19.3% of Bitcoin’s market history. Given this rarity, it’s reasonable to expect an upswing in volatility based on historical trends.
Slowdown in On-Chain Activity: The Lull Before The Uptick
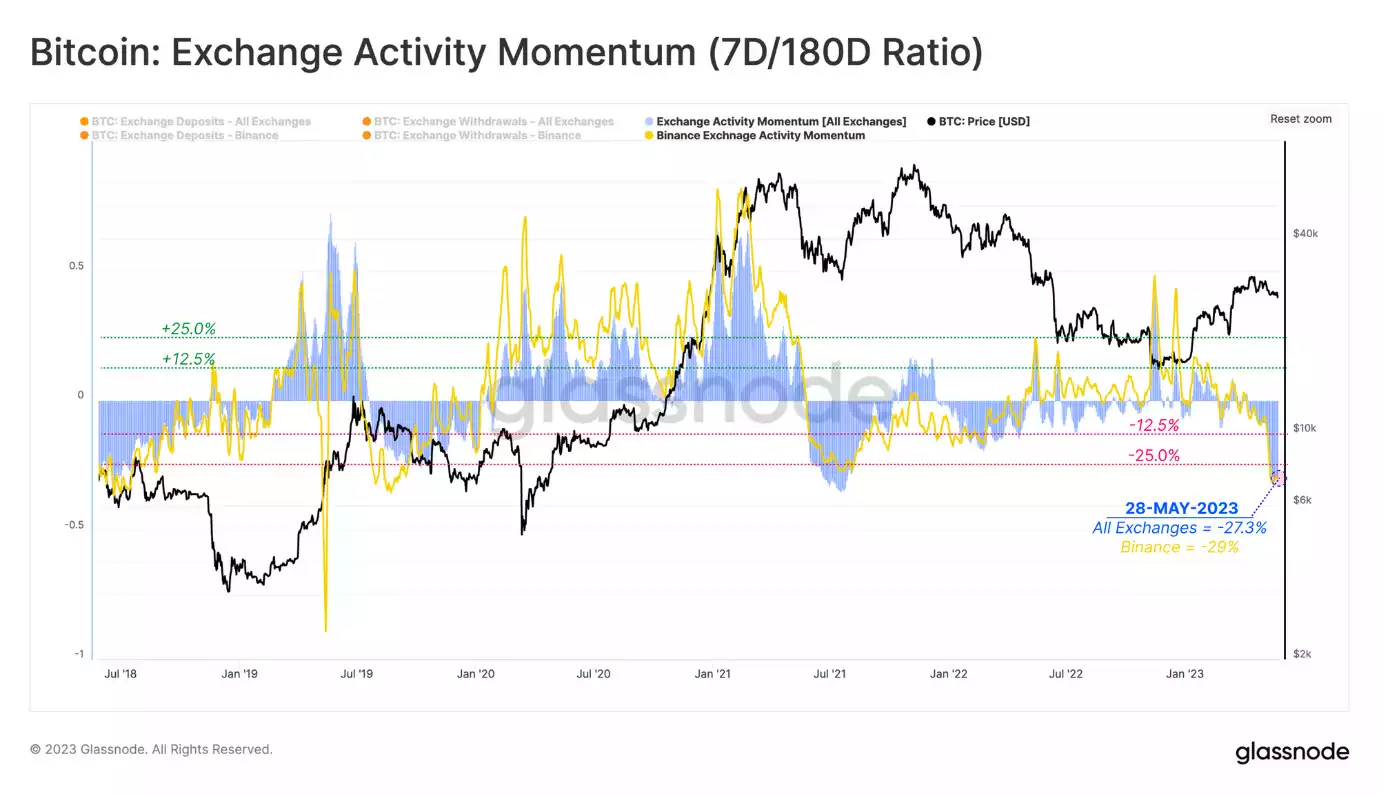
On-chain transfer volumes are currently cyclically low, leading to a drop in exchange-related activities. This decline is quantifiable, and it illustrates a cyclical trend in exchange activity. Recent activity has dropped by 27.3% relative to the last six months, suggesting that investor activity is currently light.
Market Equilibrium: A Stabilising Force?
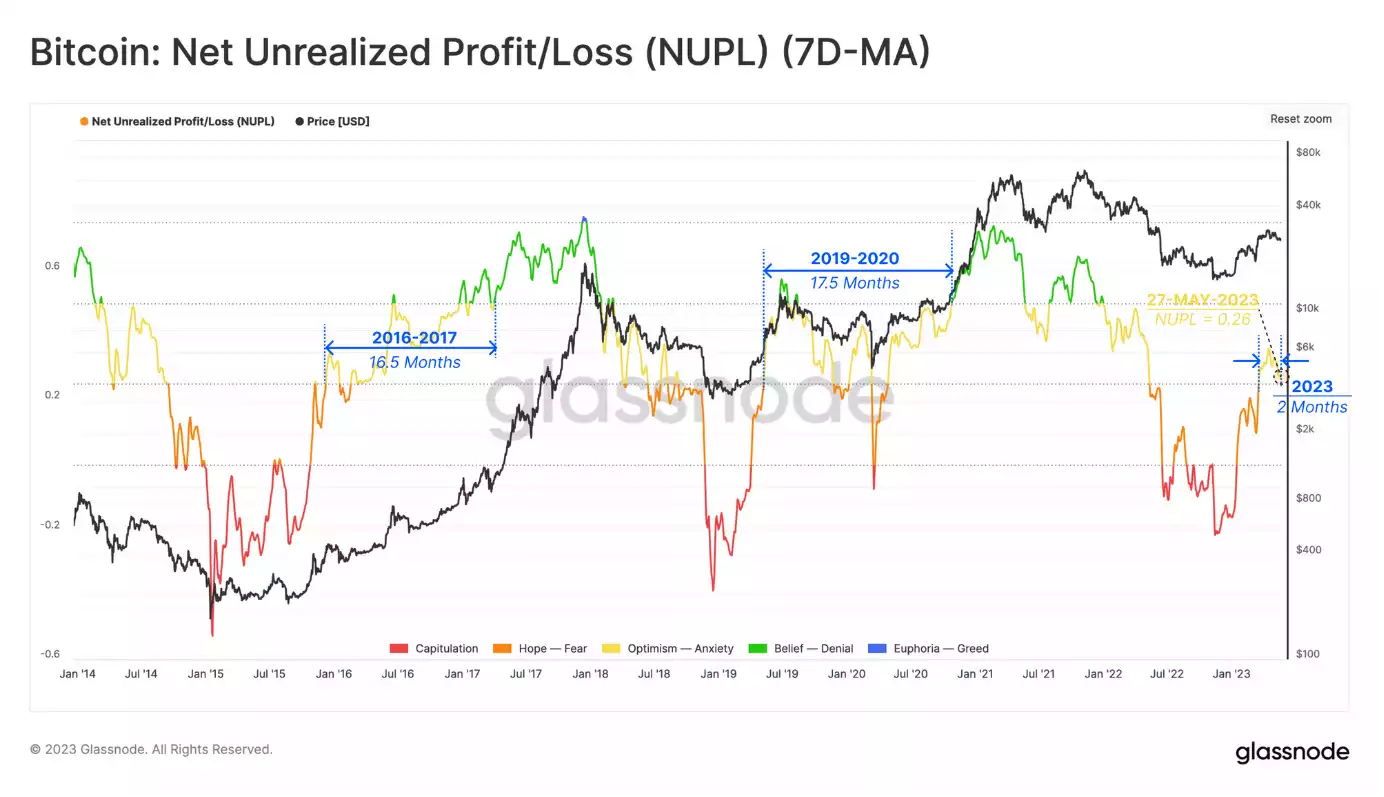
As volatility decreases and on-chain activity diminishes, the cryptocurrency market appears to be entering a phase of equilibrium. The Net Unrealised Profit/Loss (NUPL) metric, which offers a macroeconomic view of the market, supports this supposition. According to the current NUPL value, the market is in the lower limit of the equilibrium phase. This phase, comprising 37.5% of all Bitcoin trading days, has persisted since early March 2023.
Investor Cost Basis: A Forecasting Tool
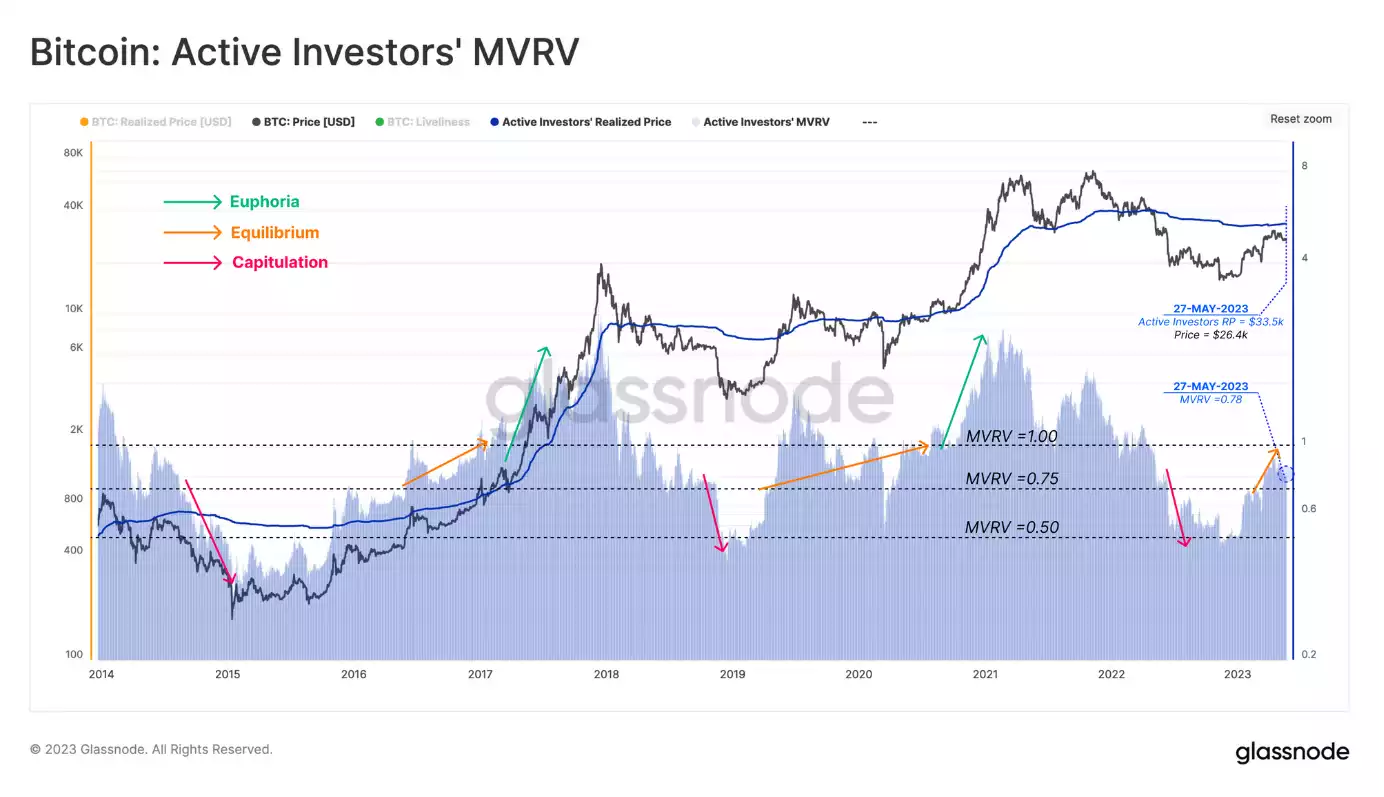
As we traverse this equilibrium, investor cost basis can be used as a tool to predict likely boundaries of near-term volatility. The Active Investor Cost Basis is currently at $33.5k, offering a near-term upper-bound price model. The Market Value to Realised Value (MVRV) of active investors presently stands at 0.83. This metric below 1 suggests that many buyers from the 2021-2022 cycle are still at a loss. As a result, many of these investors may be waiting for prices to hit their break-even point before deciding to liquidate their holdings, a decision that could shape future market dynamics.
The Investor Cap Price Model: A Robust Market Indicator
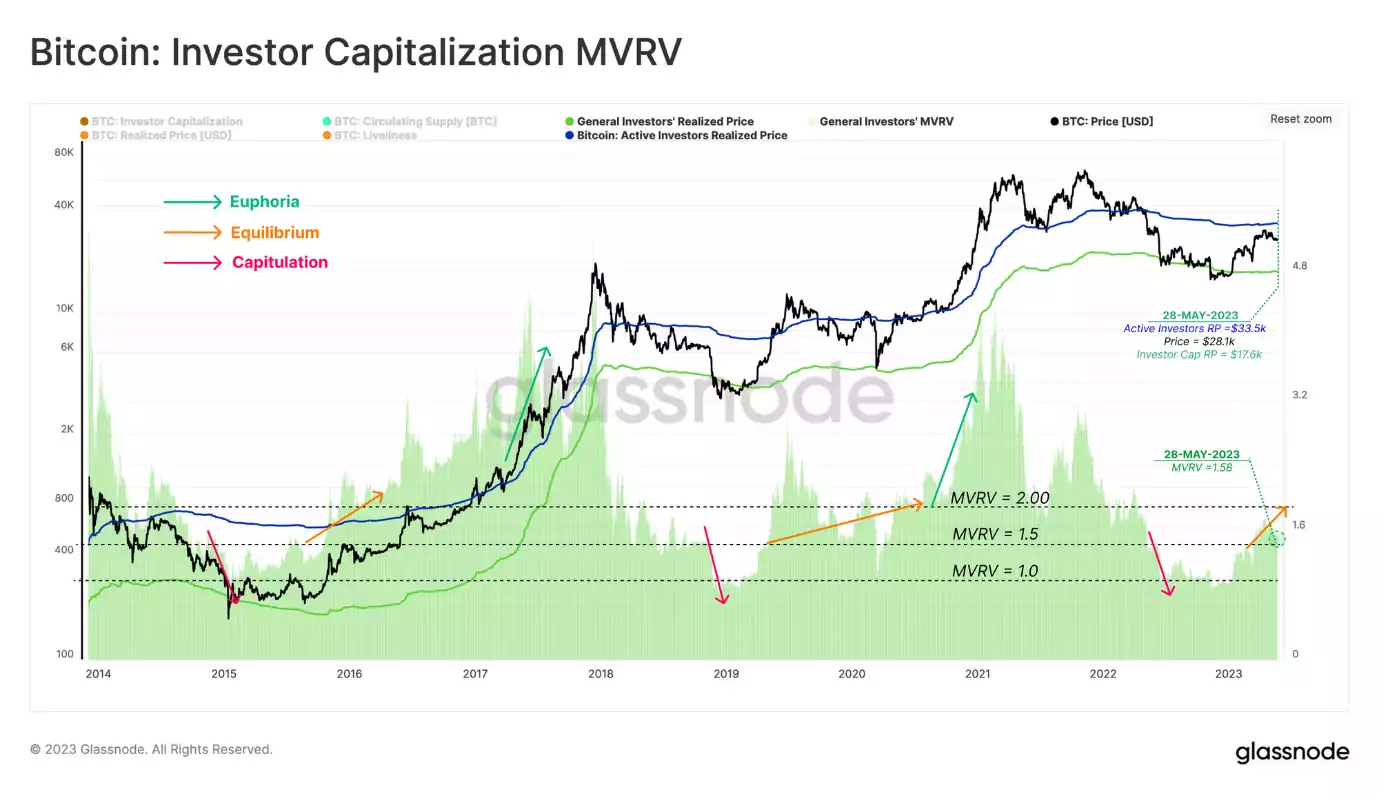
In this context, the Investor Cap Price model, which effectively creates a floor price model based on investor holdings while excluding miner inputs, could be a critical indicator. Briefly met during the steep market sell-off in March 2020, the Investor Price model is currently trading at $17,650. The Investor Capital MVRV currently stands at 1.58, aligning with a similar equilibrium range observed during the mini-market cycle between 2019-2020.
LTH Supply: A Cycle Indicator
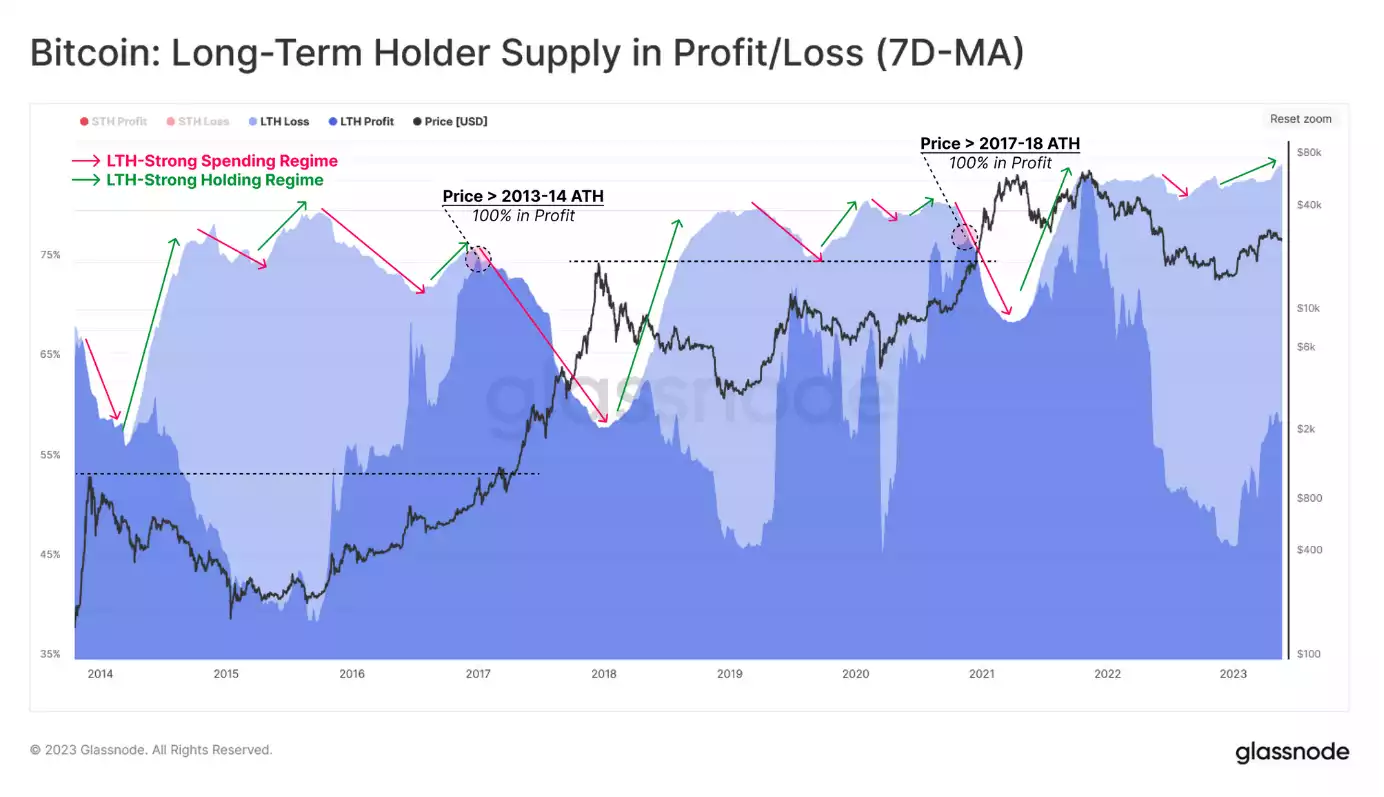
In this state of equilibrium, the supply side of Long-Term Holders (LTH) is a critical market movement indicator. The LTH supply pattern, marked by periods of strong spending and holding patterns, has been a reliable cycle indicator. This cycle has been clearly seen in the 2022 bear market, demonstrating the resilience of Bitcoin holders amidst market volatility.
Market Sentiment: Tracking the Crypto Journey
As Bitcoin and other digital assets continue to grow in influence and market penetration, understanding market sentiment is increasingly important for investors and financial institutions. Tracking the cryptocurrency market’s journey requires a thorough understanding of its unique nuances and patterns.
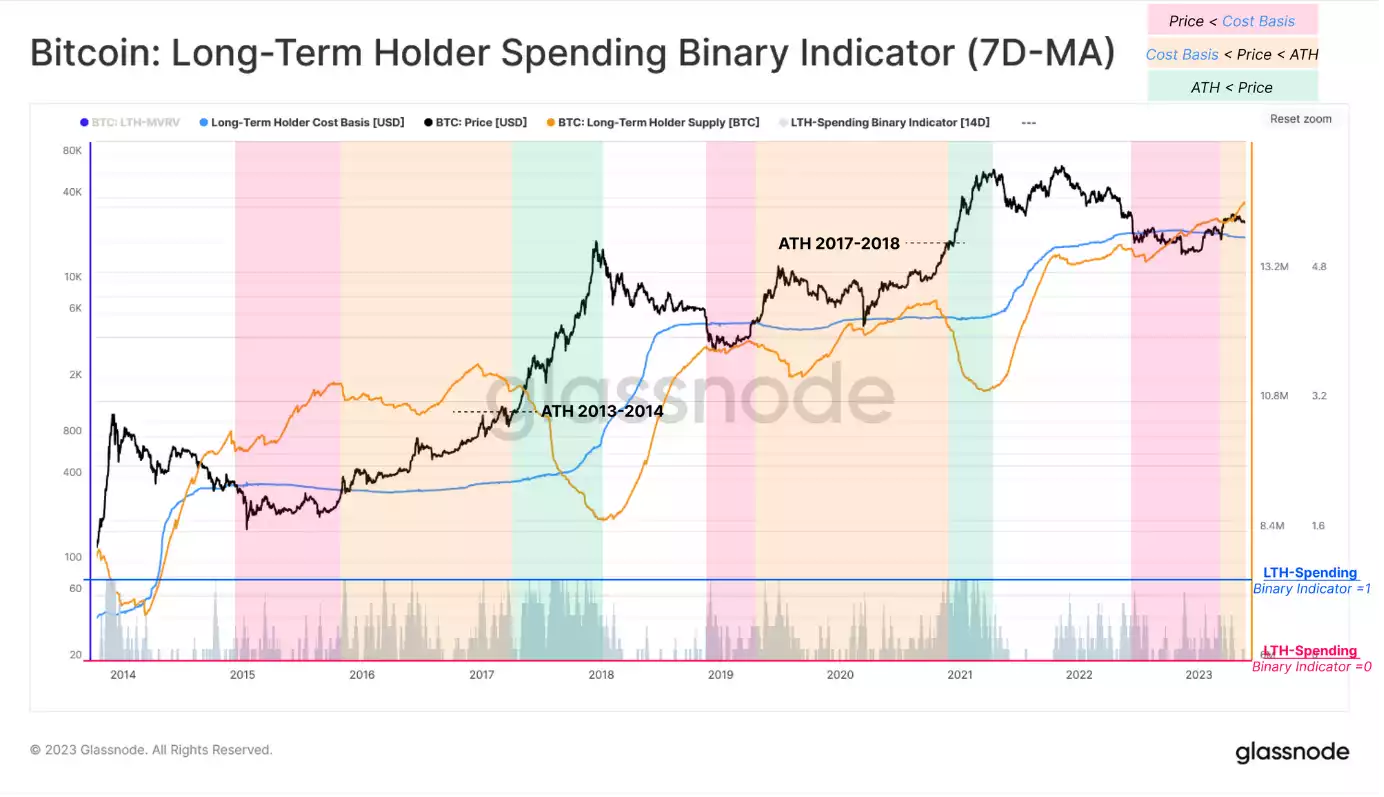
To gain a more refined view of the crypto journey, we can break it down into three distinct stages: Bottom Discovery, Equilibrium, and Price Discovery.
In the Bottom Discovery stage, prices are below the Long-Term Holders’ (LTH) Cost Basis. This stage is often associated with a bearish market where prices are declining or have hit a low point. Here, investor sentiment tends to be pessimistic as markets grapple with adverse conditions.
Next, we reach the Equilibrium stage. Here, the price hovers above the LTH Cost Basis but remains below the previous all-time high (ATH). This stage represents a potential balance between buying and selling pressure in the market. The equilibrium phase is significant as it indicates a balance between bearish and bullish sentiments, suggesting a possible shift in market dynamics in the near future.
Finally, the Price Discovery stage occurs when the price surpasses the last cycle’s ATH. This phase signifies a potentially bullish market where prices are on the rise, potentially hitting new highs. During this stage, investor sentiment often reaches a peak of optimism.
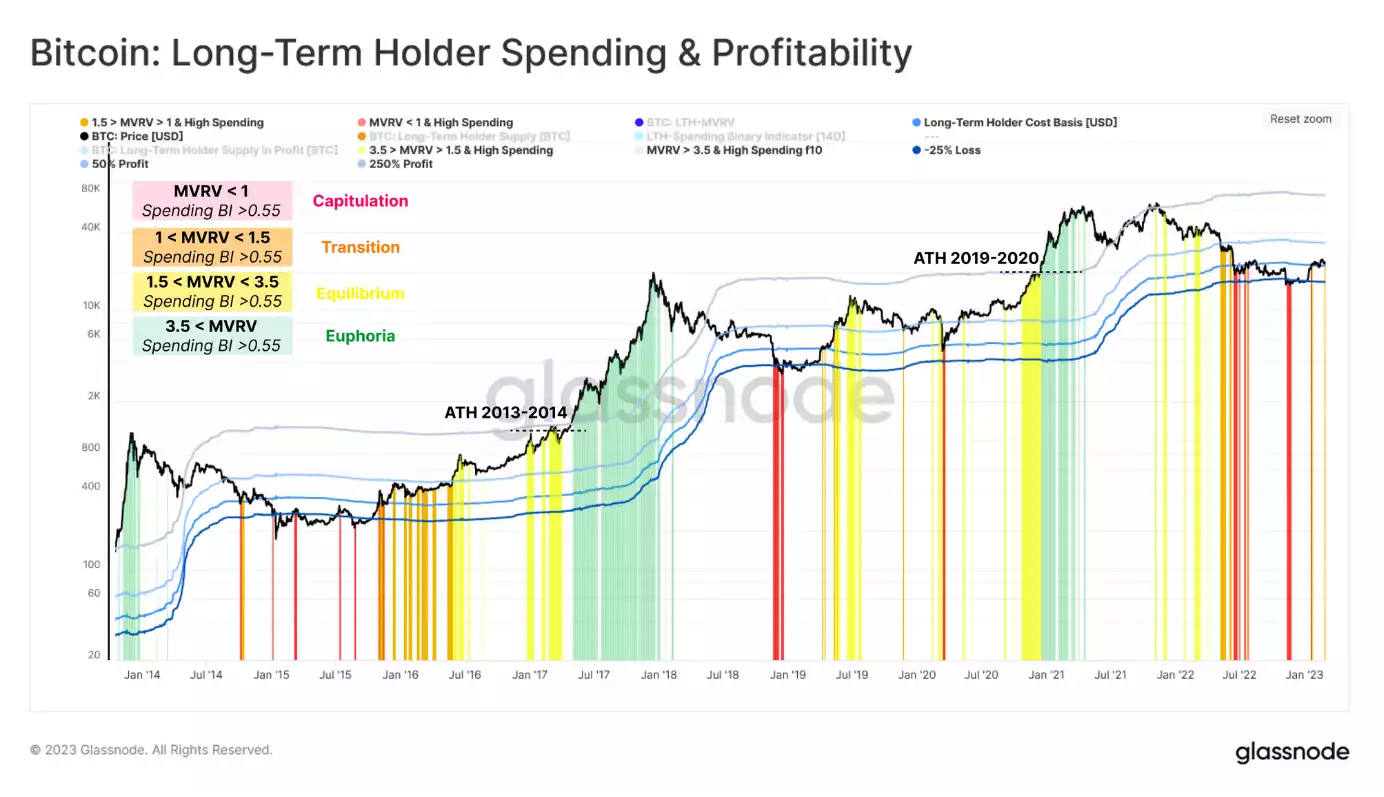
To enrich this model further, it’s essential to incorporate the intensity of LTH spending into our analysis. This factor typically aligns with either profit-taking—when long-term holders sell their assets to realise gains—or capitulation when they sell their assets due to a belief that prices will fall further. By tracking the Spending Binary Indicator (SBI), we can get a comprehensive view of long-term holder behaviour and its impact on the market.
Dissecting Market Sentiment: From Capitulation to Euphoria
Based on current data, the market has recently moved into the Transition phase. This phase is indicative of a local increase in LTH spending this week, implying a potential market shift. This new tool can help identify periods of overheated conditions, depending on the direction of volatility, as observed from the perspective of Long-Term Holders.
Crypto in Equilibrium: Gearing up for What’s Next?
In conclusion, despite undergoing a significant correction phase, the digital asset market has outperformed major commodities in 2023. Following the recovery from the lows of the 2022 bear market, Bitcoin investors are currently experiencing a state of balance, with no significant bullish or bearish movements.
This equilibrium phase, characterised by extremely low volatility and narrow trading ranges, suggests an impending disruption. Indicative of this potential shift is a subtle increase in spending by Long-Term Holders.
Remember to subscribe to this newsletter and follow us on socials for regular updates on the dynamic world of blockchain and cryptocurrency. If you’re interested in an easy and personal way to buy/sell/swap cryptocurrency, don’t hesitate to contact us – call 1800 AINSLIE. Our team of friendly consultants are ready to guide you, your company or SMSF through the process, making your cryptocurrency buying journey effortless. We also offer industry-leading crypto custody with minute-by-minute internal audits to guarantee the safety of your assets.
Share this Article:
Crypto in your SMSF
Top Movers
Get Started Trading Crypto with Ainslie.
Join Thousands of satisfied customers who trust Ainslie for their cryptocurrency and bullion needs.


