Decoding Bitcoin’s Flat Pulse
August 15, 2023
Navigating the Sea of Stability
Bitcoin, often heralded for its wild price swings, appears to be hitting a period of unusual calmness. As volatility metrics and vital on-chain indicators wane, registering at their lowest in history, the flagship cryptocurrency has surprised enthusiasts by primarily oscillating between the US$29k to US$30k range. The culmination of data infers a market seemingly ‘top-heavy.’ This state is marked by the significant accumulation of Short-Term Holder supply and their associated cost, echoing closely with the current spot price, thus hinting at latent vulnerabilities. Let’s get into the data.
Realised Cap: The Market’s Heartbeat
The Realised Cap is the linchpin of on-chain analysis, crystallising the total capital inflow into Bitcoin since its inception. Current findings place this inflow at an impressive $16B year-to-date, representing a growth of +4.1%. But it’s not all celebratory: the rate of this growth appears decelerated. While the upward trend remains undeniable, the gradient of this rise is far more subdued than the sharp ascent seen in 2021-22, indicating that capital is flowing into Bitcoin at a slower pace.
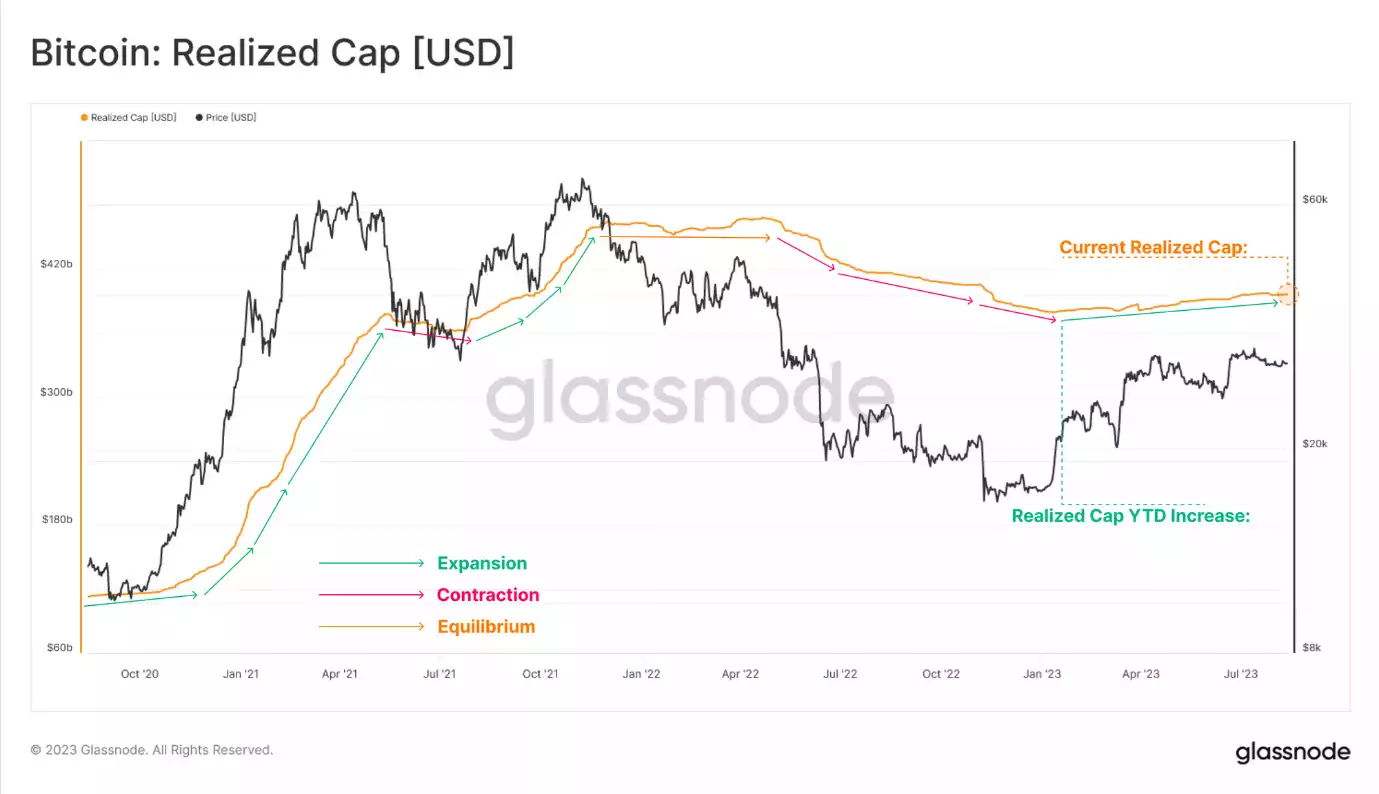
Unpacking the Realised Cap: An In-Depth Look at Bitcoin Investor Behaviour
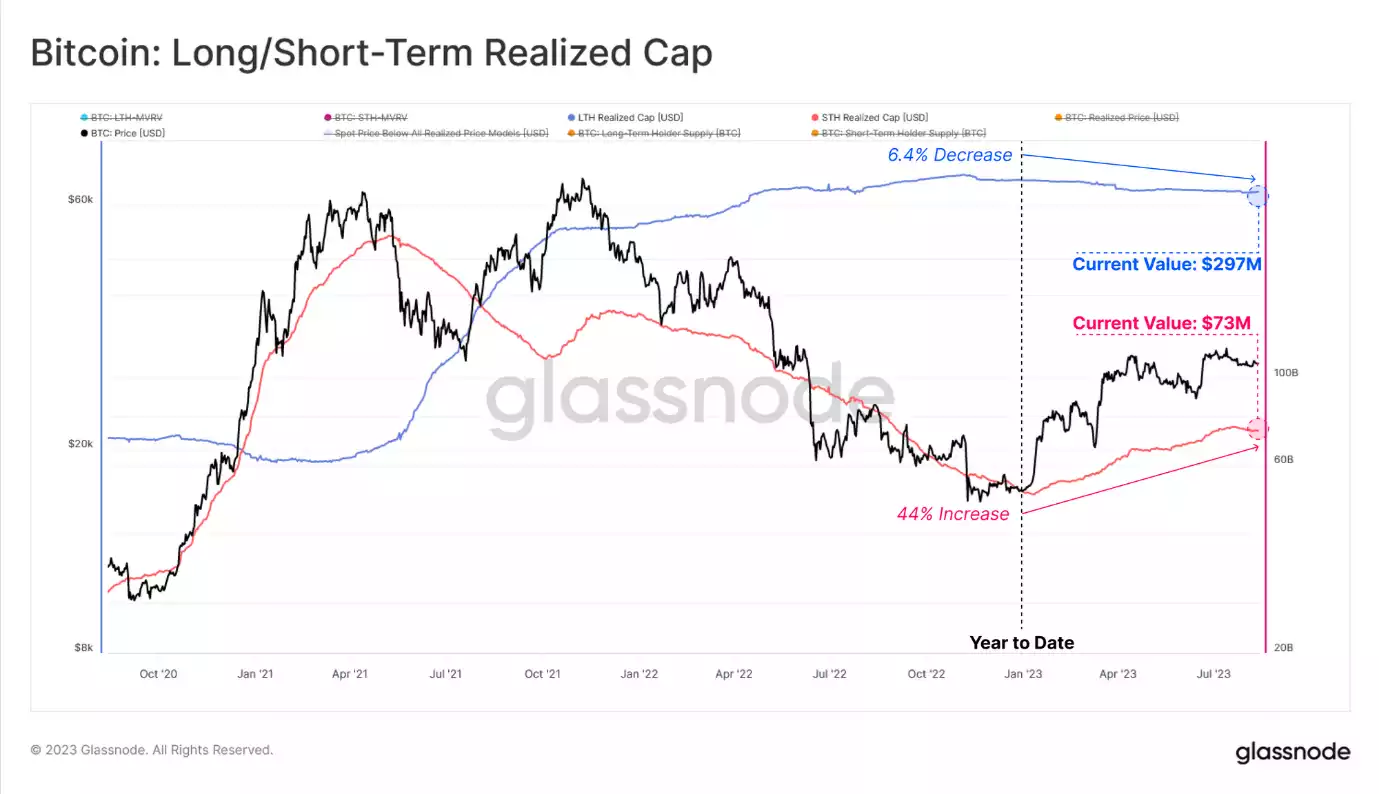
The Realised Cap is a nuanced metric that provides a detailed overview of the Bitcoin market, shedding light on the dynamics between its major investor groups. By dissecting this metric, we can understand the distribution between Long-Term Holders (LTH) and Short-Term Holders (STH), offering a clearer picture of the contrasting investment behaviours.
2023 Wealth Redistribution Highlights:
- The Short-Term Holder community has witnessed a significant prosperity boost, showcasing a stellar growth of +$22B within the year.
- On the flip side, the Long-Term Holder segment appears to be on a different trajectory, facing a dip in their accumulated wealth, decreasing by nearly -$21B.
Diving Deeper into the Market’s Inner Workings:
- STH Dynamics: The Short-Term Holders, driven by optimism or FOMO (Fear of Missing Out), have been actively pursuing upward market trends. This aggressive strategy inevitably hikes up their average cost basis.
- The Journey of Assets: Interestingly, assets that investors snapped up for prices below the $24k mark in the year’s first quarter are now evolving. They’ve graduated from their short-term status, moving into the esteemed Long-Term Holder bracket. This natural progression of assets leads to a downward tilt in the average cost basis for the long-standing investor group.
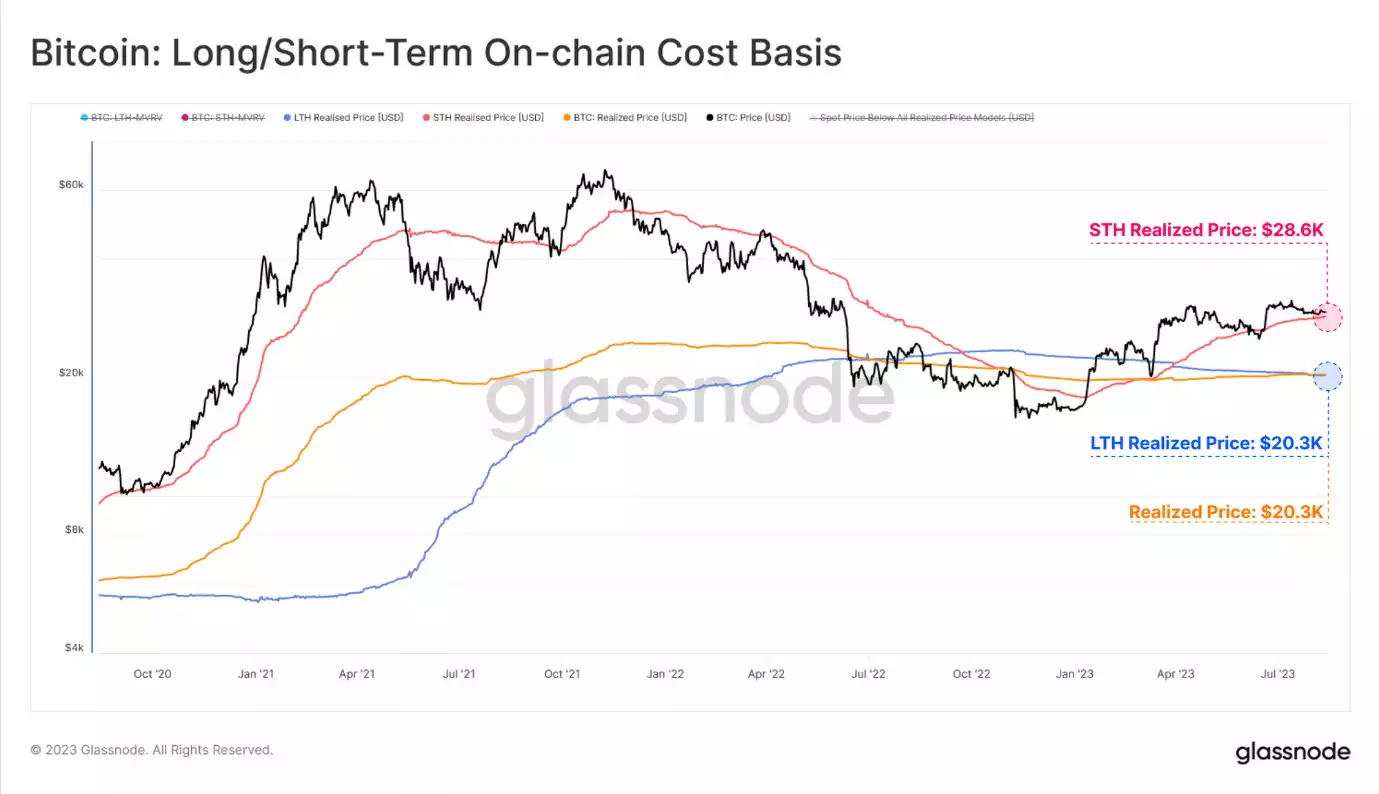
Peeling back the layers of the cost basis for each Bitcoin cohort offers intriguing insights. This year alone, the Short-Term Holders (STH) have seen their cost basis surge by a remarkable +59%, positioning it at a current value of $28.6k. Contrarily, the cost basis for Long-Term Holders (LTH) remains significantly more conservative, hovering around the $20.3k mark.
This pronounced divergence between the two groups points towards a pivotal trend: newer entrants into the Bitcoin realm appear to be acquiring their assets at a steeper price, signalling an optimistic or perhaps aggressive approach to their investments.
Investor Convictions: A Tale of Two Cohorts
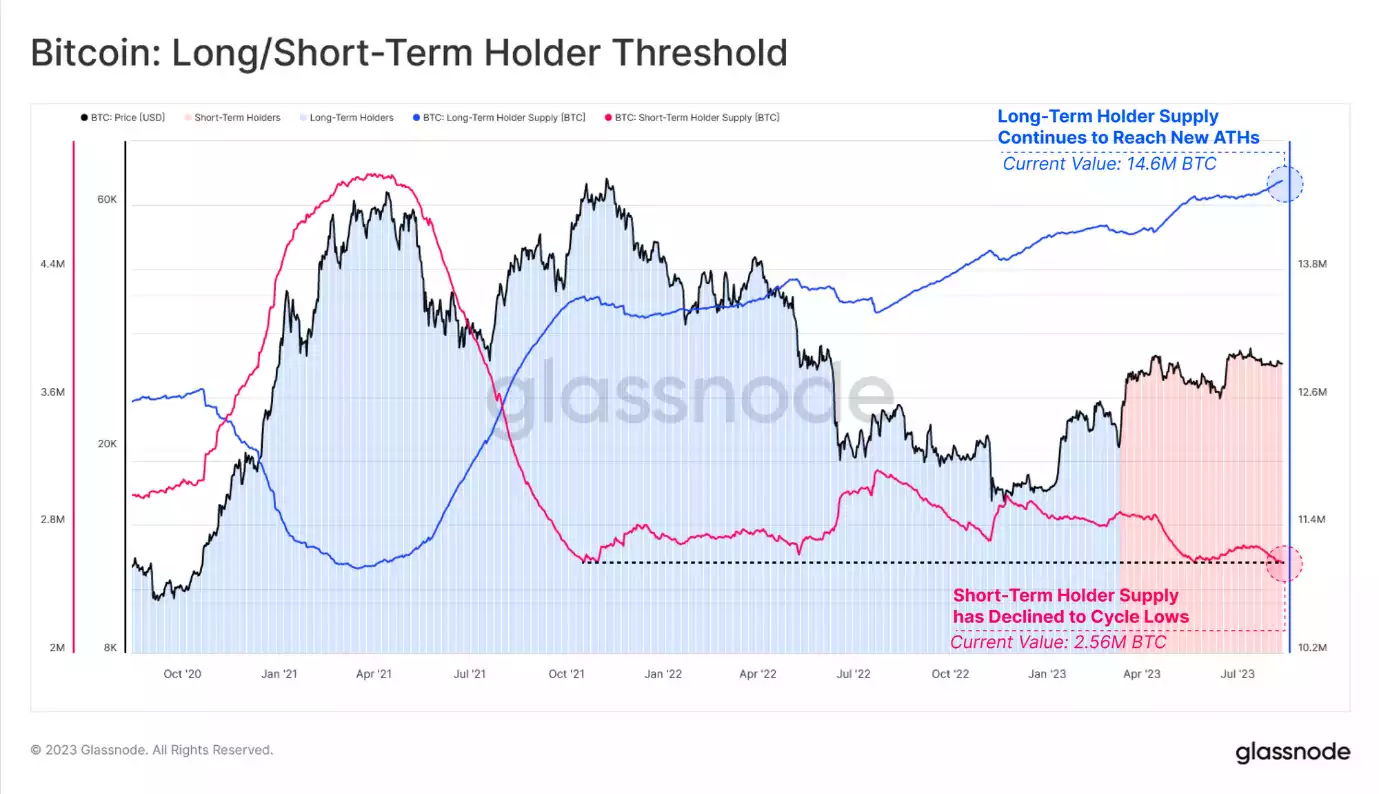
Bitcoin’s ledger is painting a vivid narrative: the Long-Term Holder supply has reached an astounding new high at 14.6M BTC, underscoring robust confidence among this cohort. In stark contrast, Short-Term Holders are thinning out, with their Bitcoin stash dwindling to a multi-year nadir of 2.56M BTC. This dichotomy implies a strong leaning towards holding, indicative of an unwavering belief in Bitcoin’s enduring value.
A Resonant Lull in Bitcoin’s Price Movements
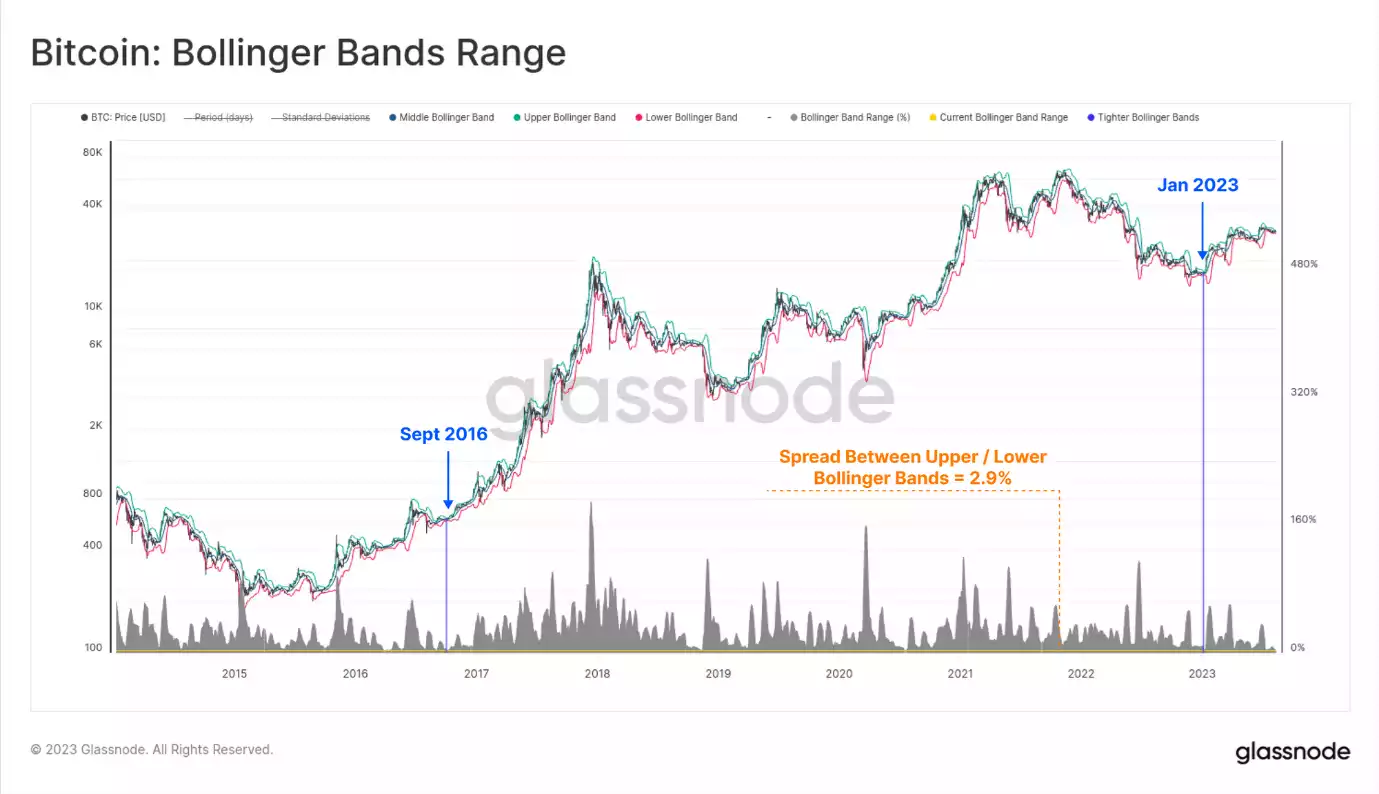
A closer examination of Bitcoin’s recent trading activity reveals a distinct downtrend in its price fluctuations. Such decreased volatility is prominently reflected in the Bollinger Bands analysis, with the gap between the upper and lower bands narrowing to a mere 2.9%. This slim margin is indicative of a steady market, although there are murmurs of it signalling a potential plateau.
Drawing from historical records, this constricted range within the Bollinger Bands is not a frequent occurrence. Notably, this pattern was spotted just twice in the past:
- A Flash from the Past, September 2016: This moment was captured when Bitcoin was priced modestly at $604. Importantly, this timeframe heralded the beginning of the significant 2016-17 price ascent.
- Déjà Vu, January 2023: Bitcoin’s value was pegged at $16.8k. This period stands out due to the cryptocurrency oscillating within a strikingly narrow $52 bracket at the year’s outset.
Interpreting the undercurrents of these market mechanics, there appears to be a collective sentiment of weariness, a significant reduction in volatility, and a prevailing sense of detachment among traders and investors. Such sentiment poses the question: Is this the tranquillity preceding an upheaval or an indication of an extended period of market neutrality?
Decoding Investor Behaviour in Varying Market Volatility
To get a clearer perspective on how investors behave under different market conditions, it’s essential to lean on the “Realised Value.” This metric provides a window into investors’ spending patterns, especially in times of fluctuating market volatility.
Understanding the Realised Value in Relation to Volatility:
- High Volatility Patterns: In a market characterised by significant price swings, investors tend to engage in transactions with coins whose cost basis deviates markedly from the current market rate. The outcomes of these trades can swing between considerable gains and steep losses.
- Behaviour in Low Volatility (Signs of Investor Fatigue): On the other hand, in quieter market conditions, the coins transacted on-chain often possess a cost basis that aligns closely with the current market rate. This alignment usually translates to marginal profit or loss realisations.
Spotlight on the Sell-Side Risk Ratio:
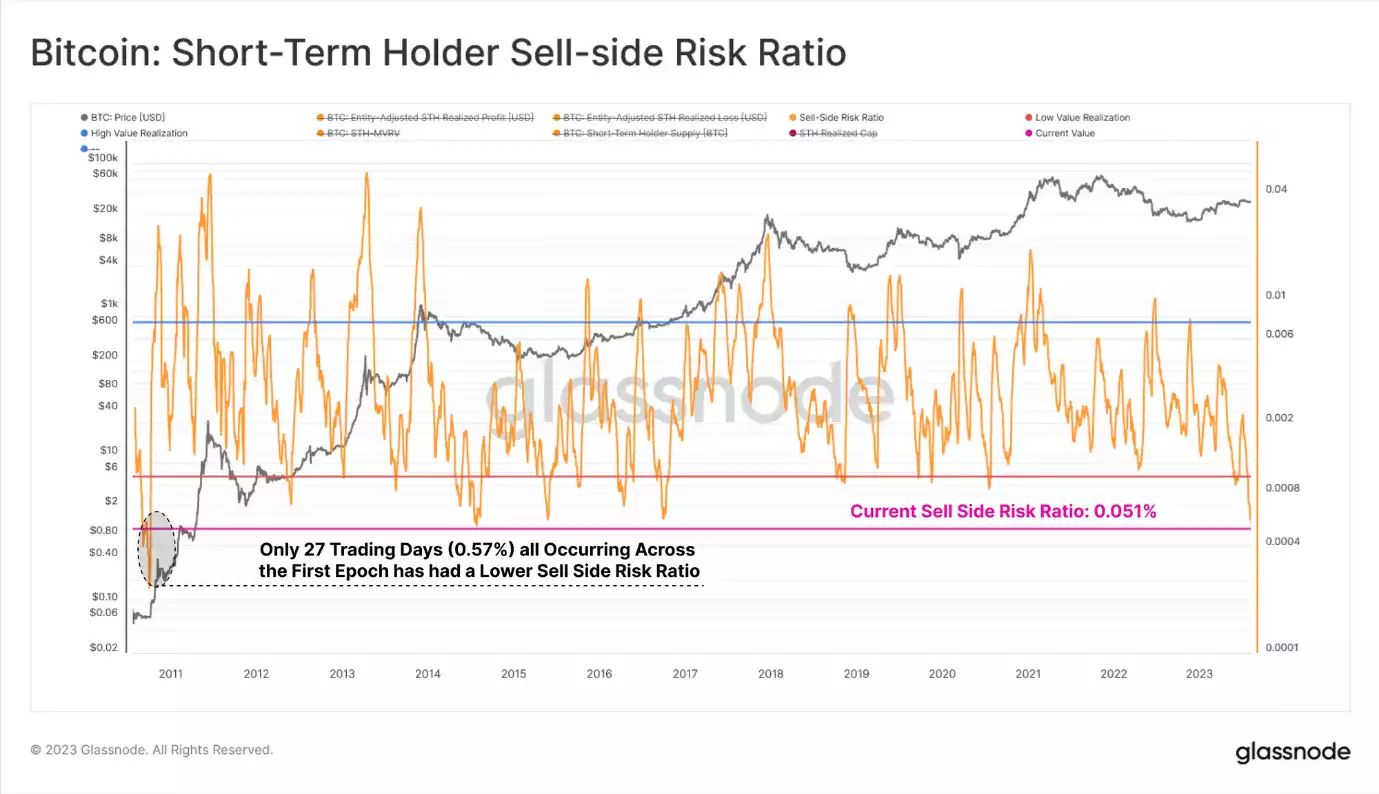
This tool offers valuable insights by juxtaposing the net value of realised gains or losses (reflecting the valuation shift of assets) against the realised cap (indicating the present asset valuation). A remarkable observation: the ratio, when assessed for Short-Term Holders (STHs), sits at an almost unprecedented low. To put it in perspective, a mere 27 trading days (or 0.57%) have logged a lower value.
Drawing Conclusions from the Data:
A careful interpretation of the present metrics suggests a prevailing trend: investors looking to cash in on gains or mitigate losses at the prevailing price points have largely made their move. This prevailing trend, combined with the subdued Sell-Side Risk Ratio, intimates that a pronounced market shift may be necessary to kickstart renewed trading activities. These signs coalesce to hint at an imminent rise in market volatility.
Gazing Into the Crystal Ball: Conclusions
As we stand at the crossroads of historical patterns and current data, a few certainties emerge. The digital asset sector, with Bitcoin at its helm, is in a period of unprecedented low volatility. The market dynamics bear semblances to post-bear-market conditions from previous cycles, characterised by the dominance of conviction-driven, long-term holders. However, a considerable portion of the market is in a liminal space, holding assets at a notional loss.
The overarching sentiment remains one of caution and anticipation, with market enthusiasts awaiting Bitcoin’s next dance move. Whether this is a prelude to a storm or the onset of a new norm remains to be seen but history shows that the market favours the upside.
Remember to subscribe to this newsletter and follow us on social for regular updates on the dynamic world of blockchain and cryptocurrency. If you’re interested in an easy and personal way to buy/sell/swap cryptocurrency, don’t hesitate to contact us – call 1800 AINSLIE. Our team of friendly consultants are ready to guide you, your company or SMSF through the process, making your cryptocurrency buying journey effortless. We also offer industry-leading crypto custody with minute-by-minute internal audits to guarantee the safety of your assets.
Share this Article:
Crypto in your SMSF
Top Movers
Get Started Trading Crypto with Ainslie.
Join Thousands of satisfied customers who trust Ainslie for their cryptocurrency and bullion needs.


