Bitcoin Report – May 2024
May 23, 2024
Today our Independent Research Analyst, Isaac Ho from the Ainslie Research Team, brings you the latest monthly deep dive specifically on Bitcoin – including market analysis, on-chain metrics, sentiment, and technical analysis. He highlights some of the key charts that were discussed and analysed by our expert panel in the latest Beyond the Block episode, but also expands upon his work with some additional insights. We encourage you to watch the video of the original presentation if you haven’t already.
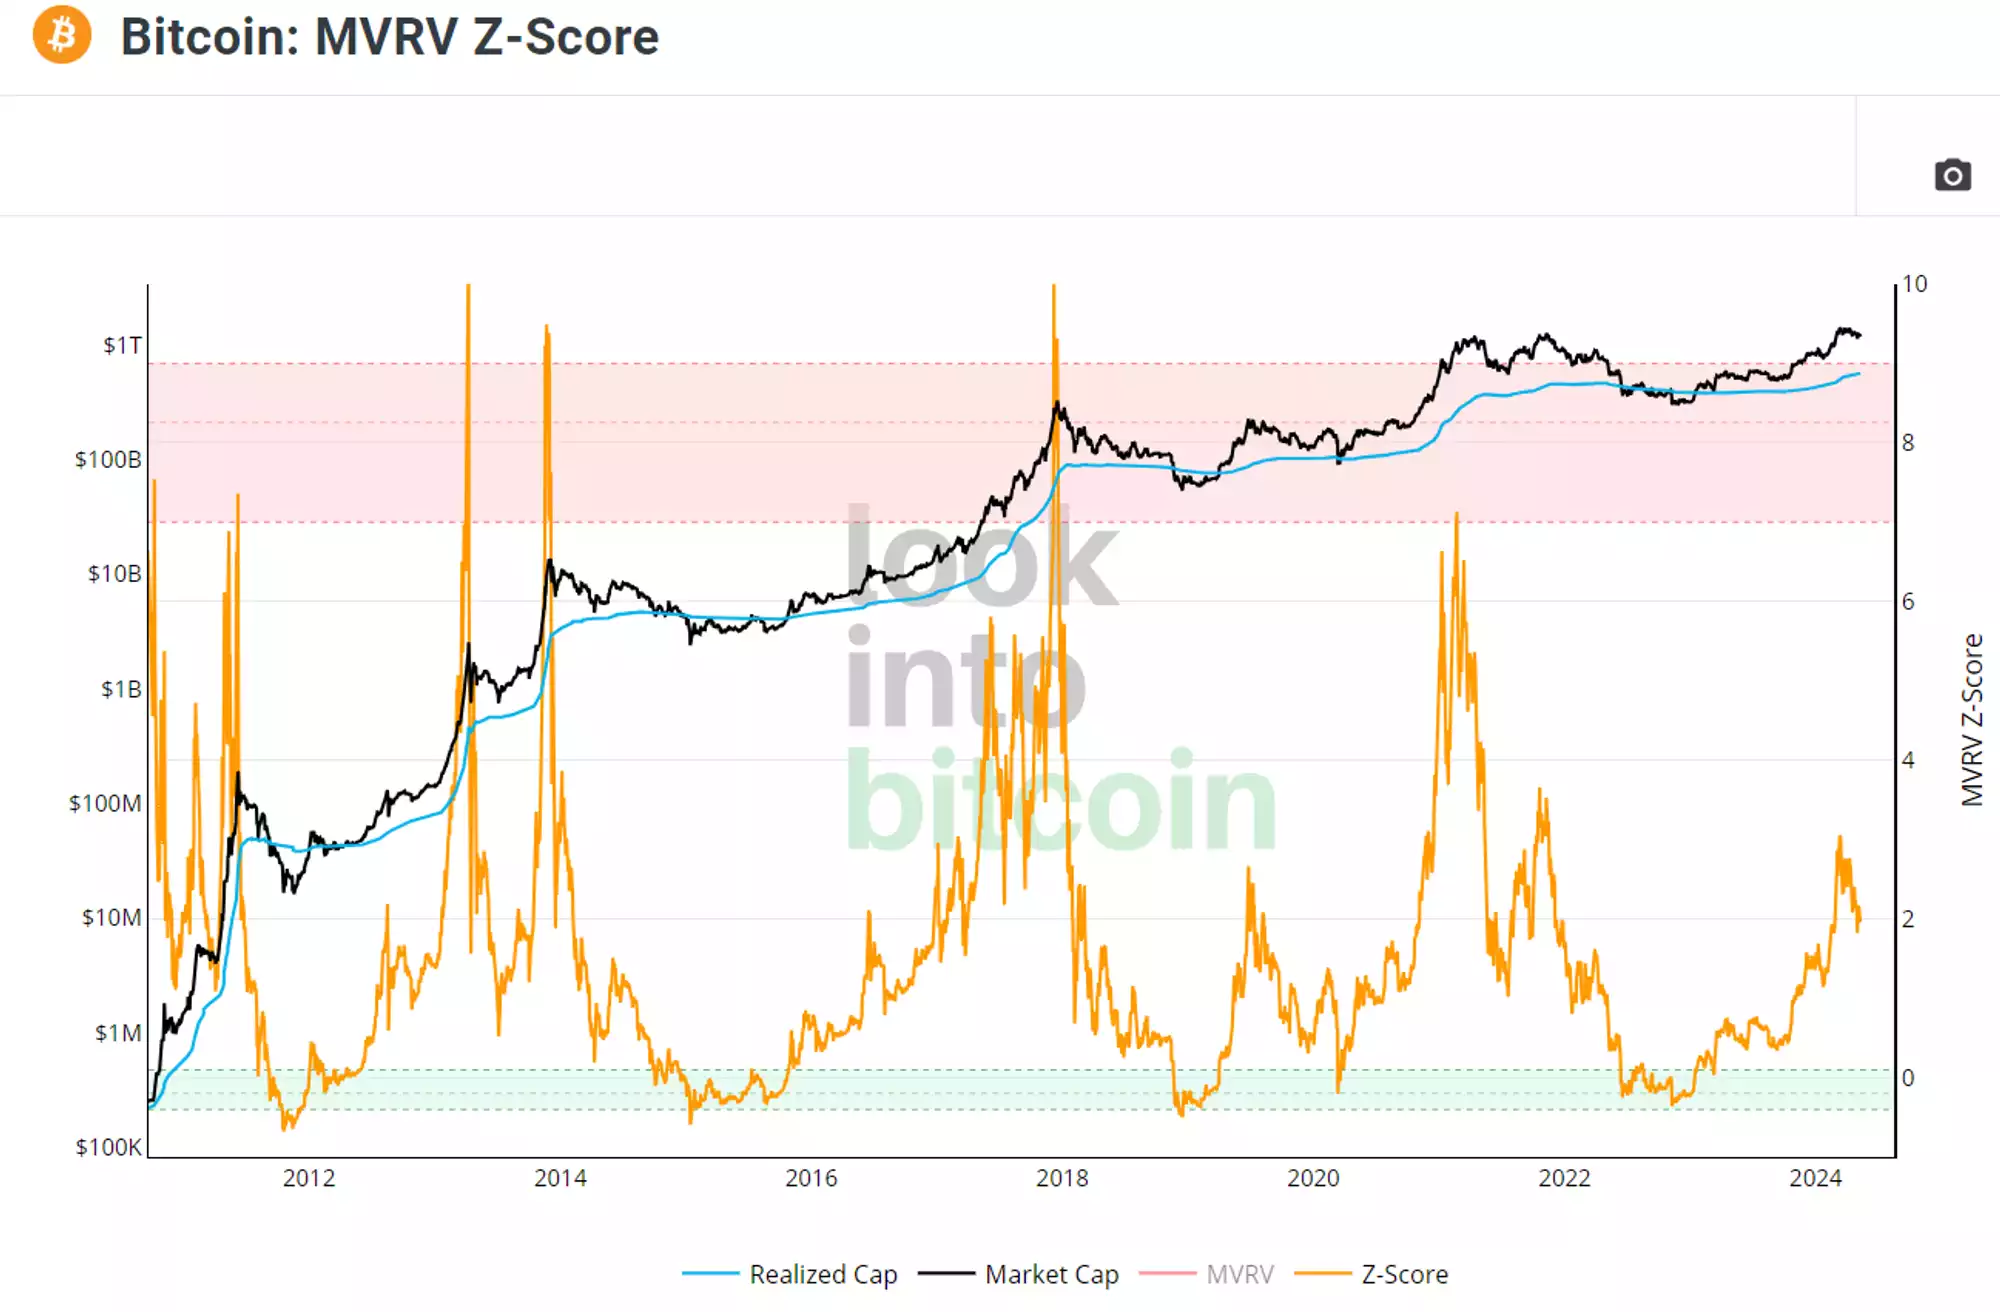
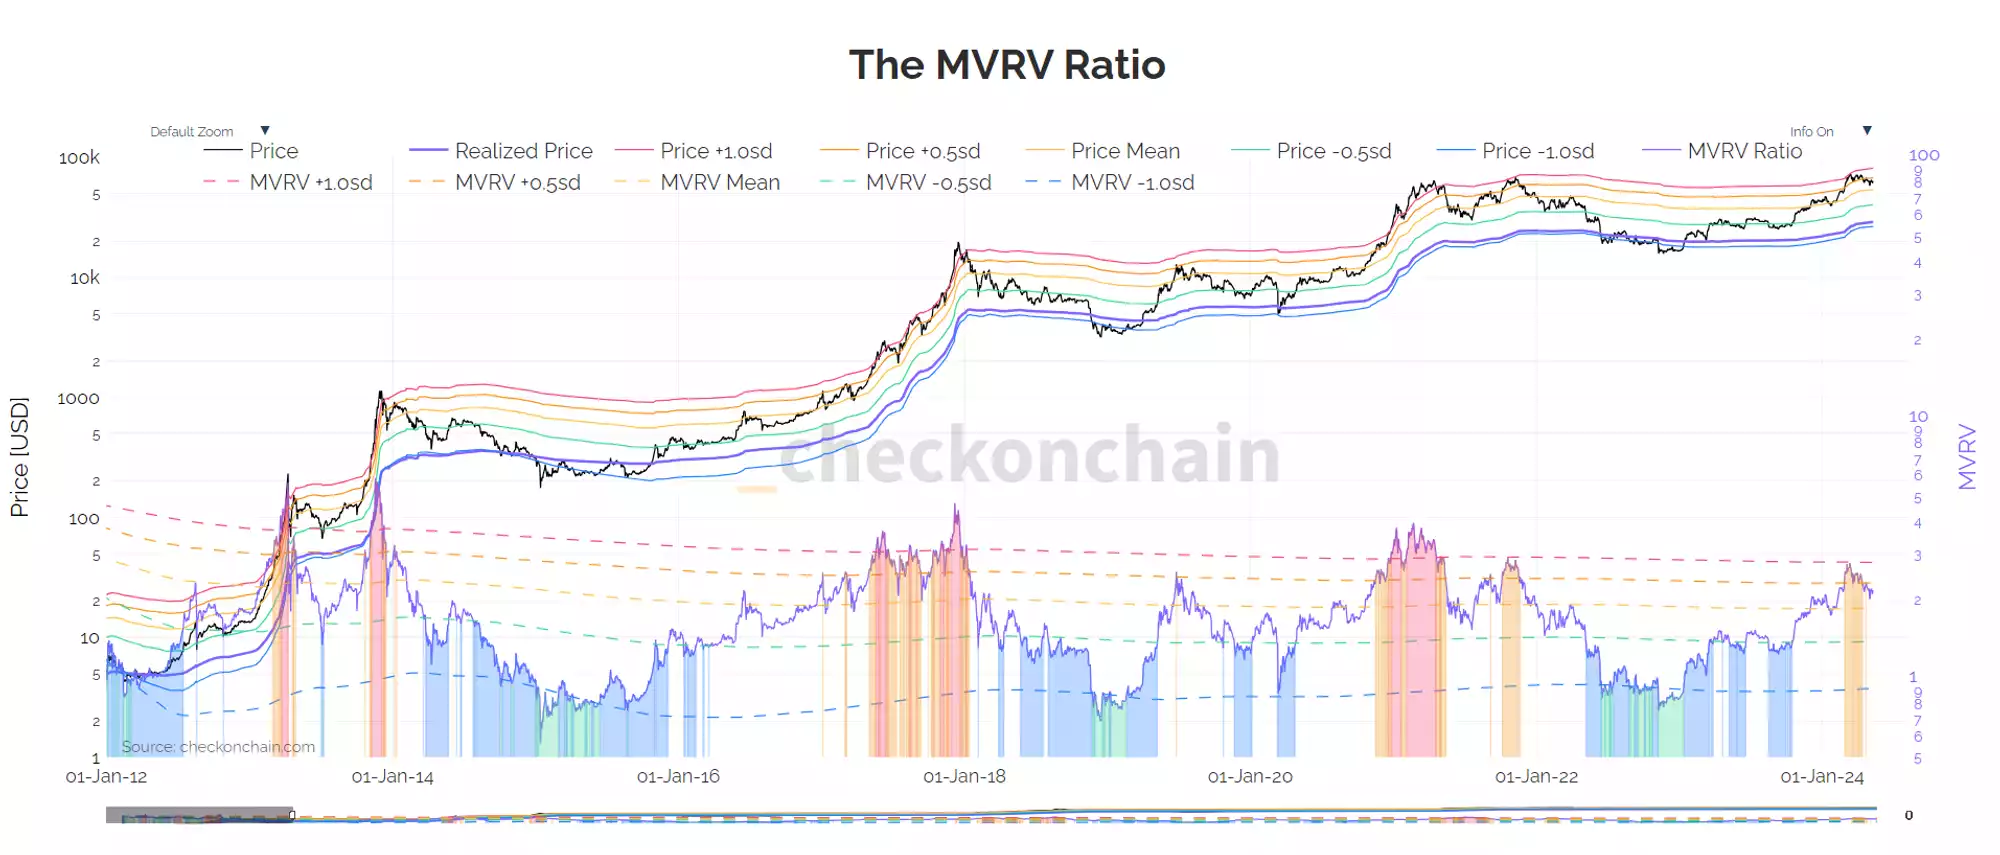
With Bitcoin’s recent downturn, we’ve observed a significant reduction in the MVRV deviation. This serves as an excellent price and sentiment reset, flushing out weak hands and positioning Bitcoin for its next upward move. As the realised price increases, the average cost basis rises, causing the deviation between market price and realised price to tighten, especially with increased trading within this range. If this local consolidation mirrors the 2019 bull run, the MVRV score could drop even further. However, given the current macroeconomic backdrop discussed in the latest Beyond the Block episode, it’s unlikely to return to the green buy zone seen during the pandemic-induced sell-off.
Extending a trendline across the peaks of each MVRV Z-score, it appears we could reach a score of 5-6 based purely on technical analysis. However, this is not a certainty. Ultimately, macroeconomic factors and market cycles will largely dictate the price. Nonetheless, a calculated estimate suggests a potential score of 5-6.
Here is a more detailed MVRV chart showing deviation with highlighted zones.
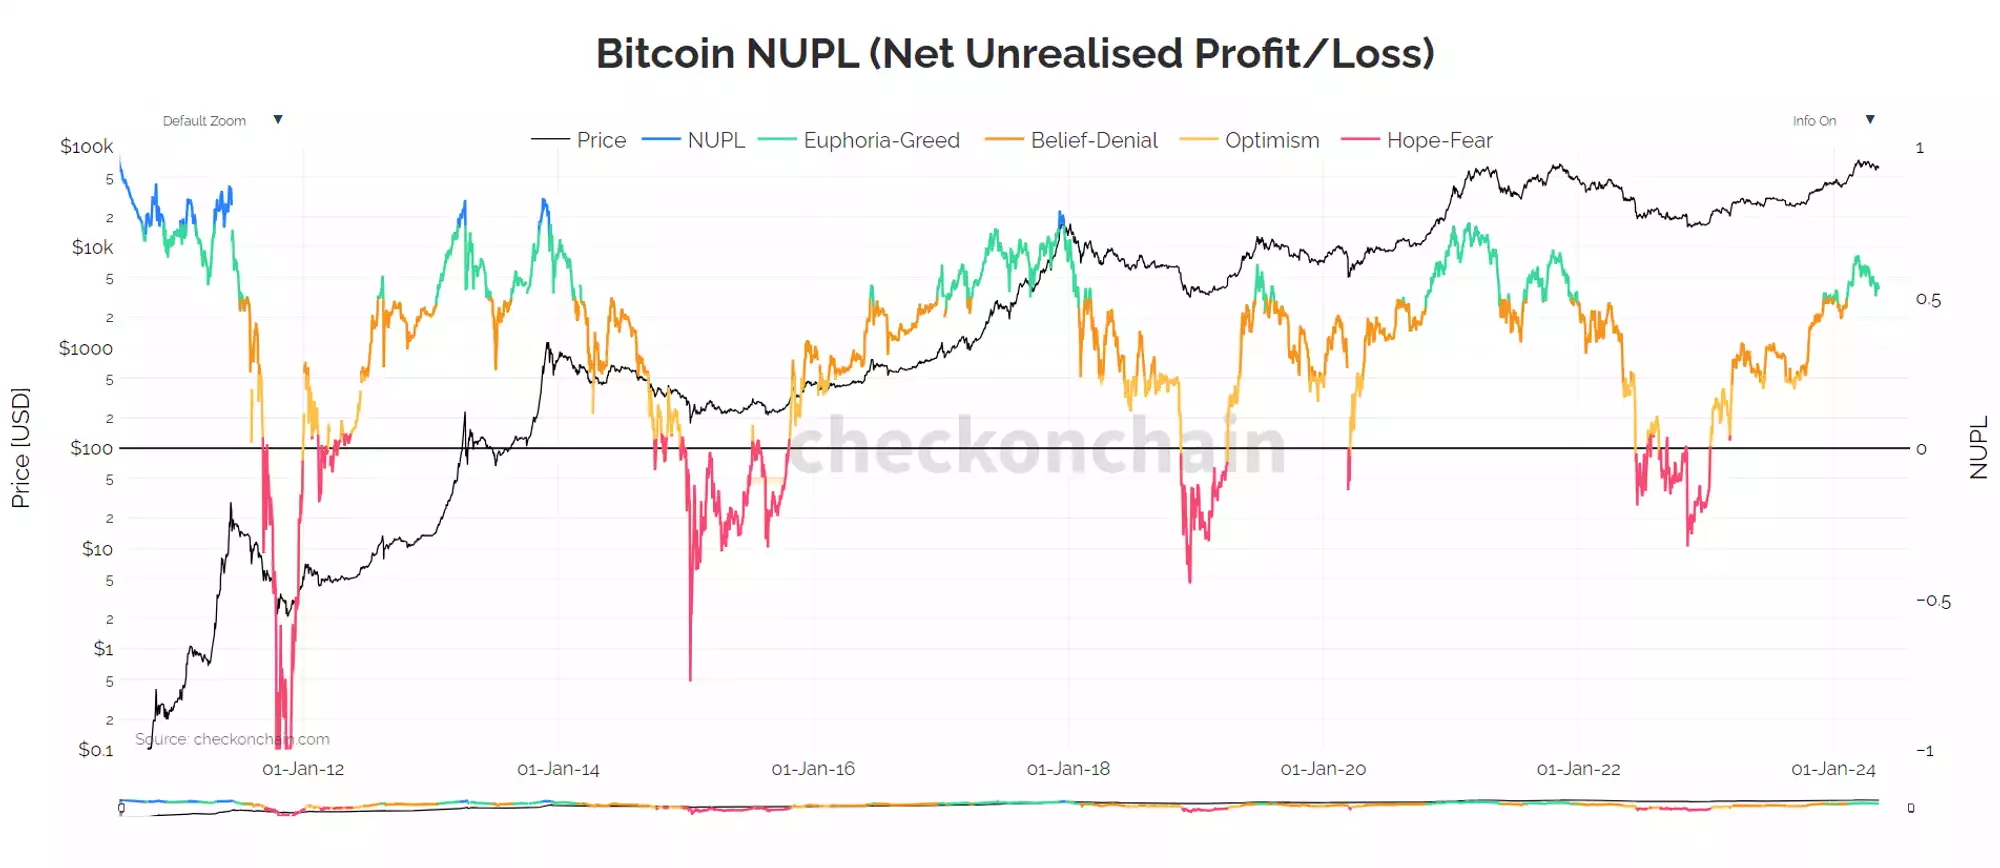
The NUPL flashing the Euphoria/Greed metric is not really anything to worry about as this can be persistent for a large period of time during the bull cycle, with it even dipping in and out to the Belief/Denial section.
Typically price hits its final all time high 1 year after the NUPL first enters Green/Euphoria, and when it flashes in the Red it is often the optimal time to buy.
Combination Chart:
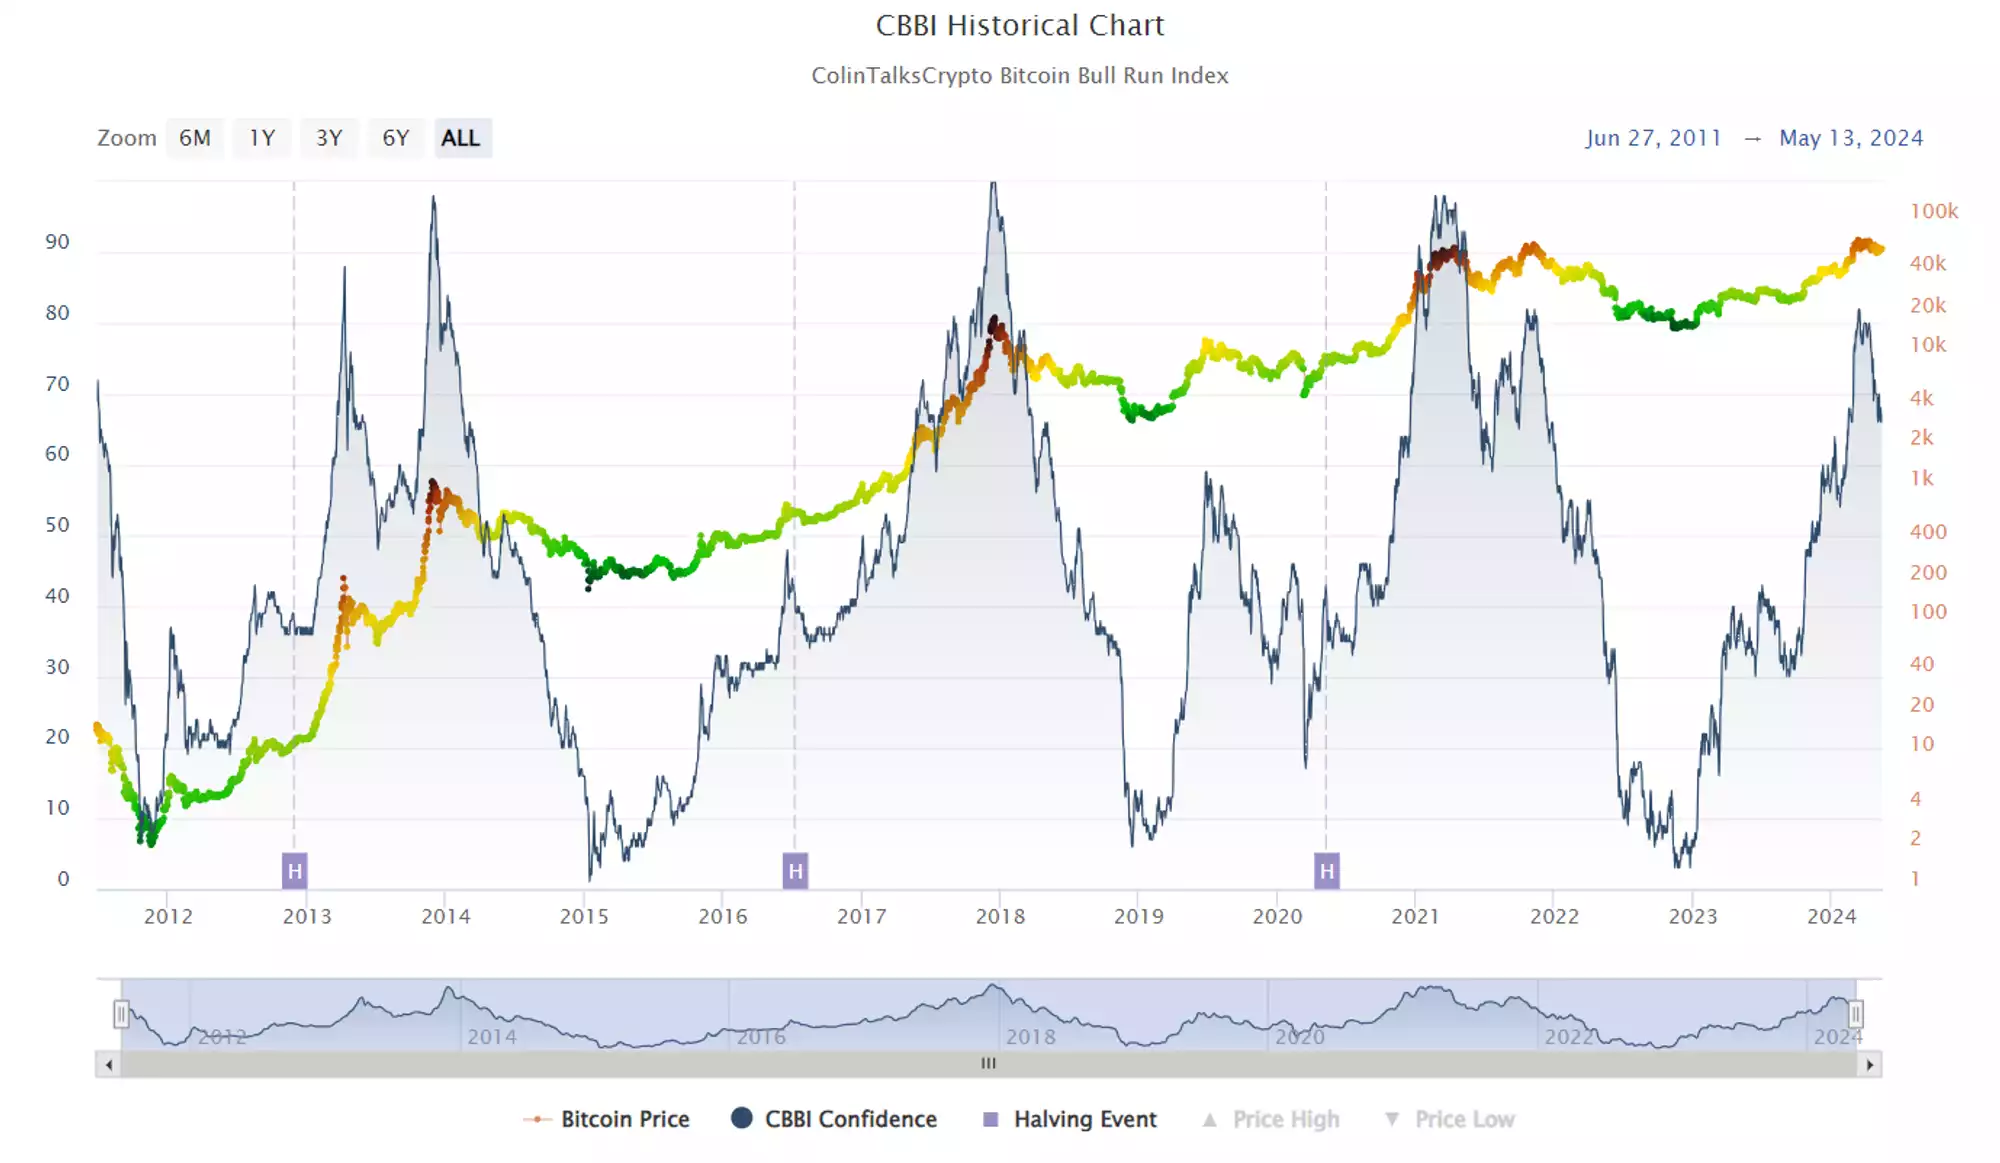
The combination chart briefly reached a high score of 80 before pulling back significantly to around 67, where it currently fluctuates. To be convinced that the top is in, we would need to see a score of 90+ unless there have been fundamental changes in the macroeconomic backdrop. That said, much like the MVRV Z-score, this pullback serves as a great reset. Had the score continued to climb, it would likely have reached the 90+ region much faster, potentially limiting the maximum upside potential. Additionally, this development makes the left-translated theory increasingly unlikely as time goes on.
Pi Cycle:
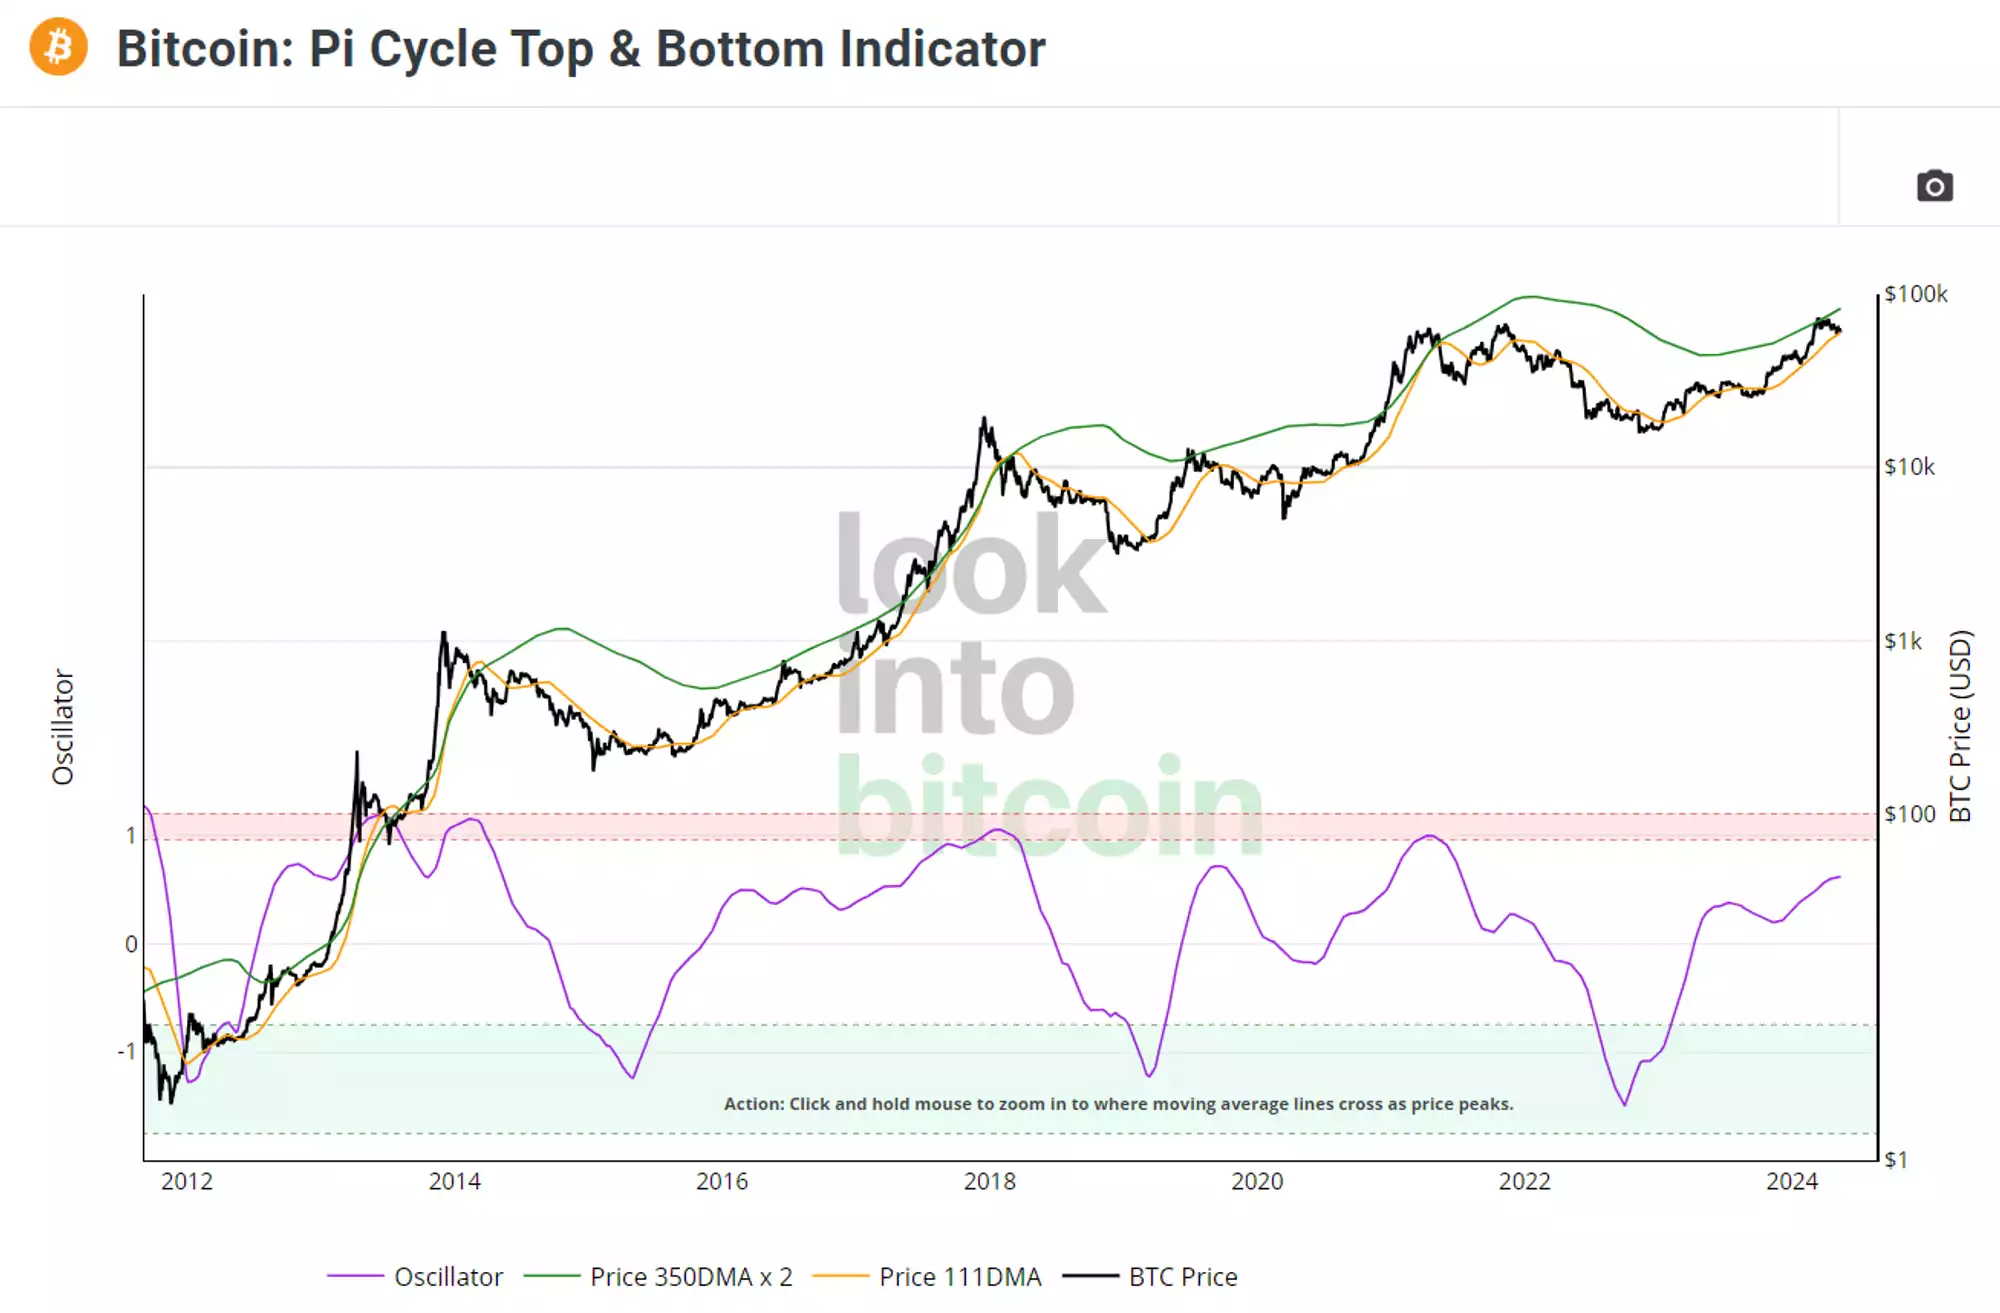
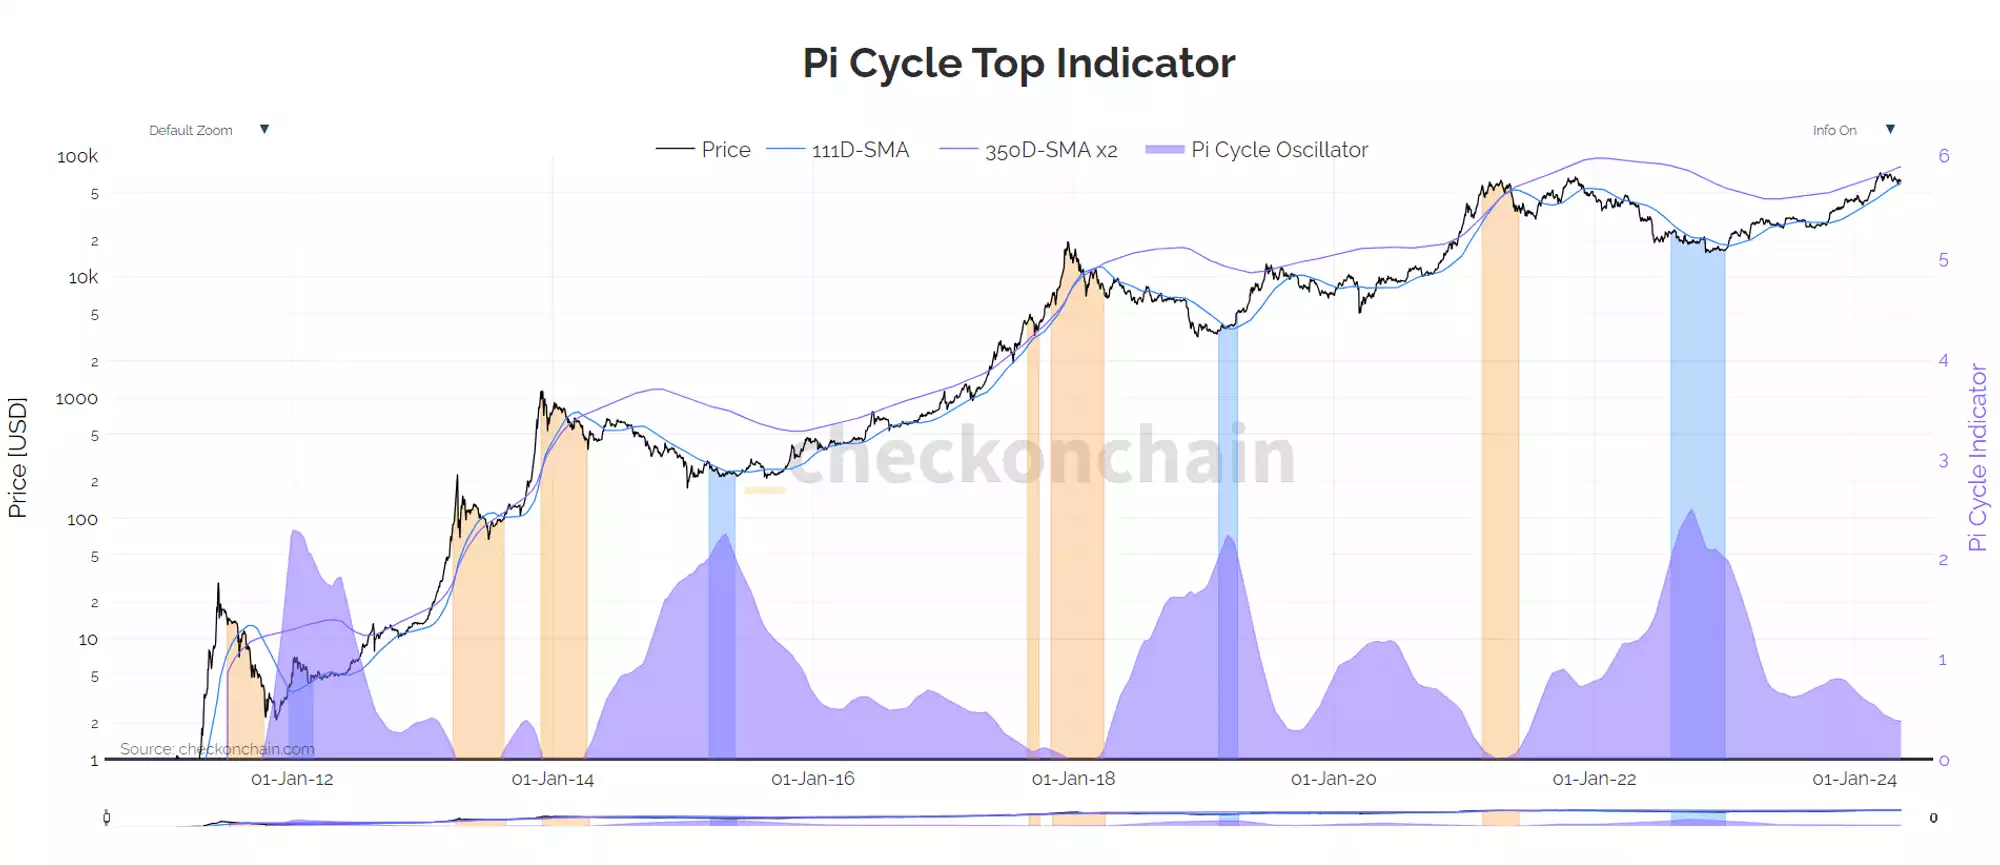
The Pi Cycle indicator is approaching a crossover, which typically signals a market top, though there is still a significant gap to close. I will be monitoring this metric closely due to its high accuracy. Ideally, we would see price action similar to the 2017 bull run, where prices continued to rise without closing the gap until much higher levels. However, I doubt this will occur, as the asset has evolved and investors are now more inclined to sell early in an attempt to time the market top, unlike in the early days when market cycles were less understood.
New Addresses:
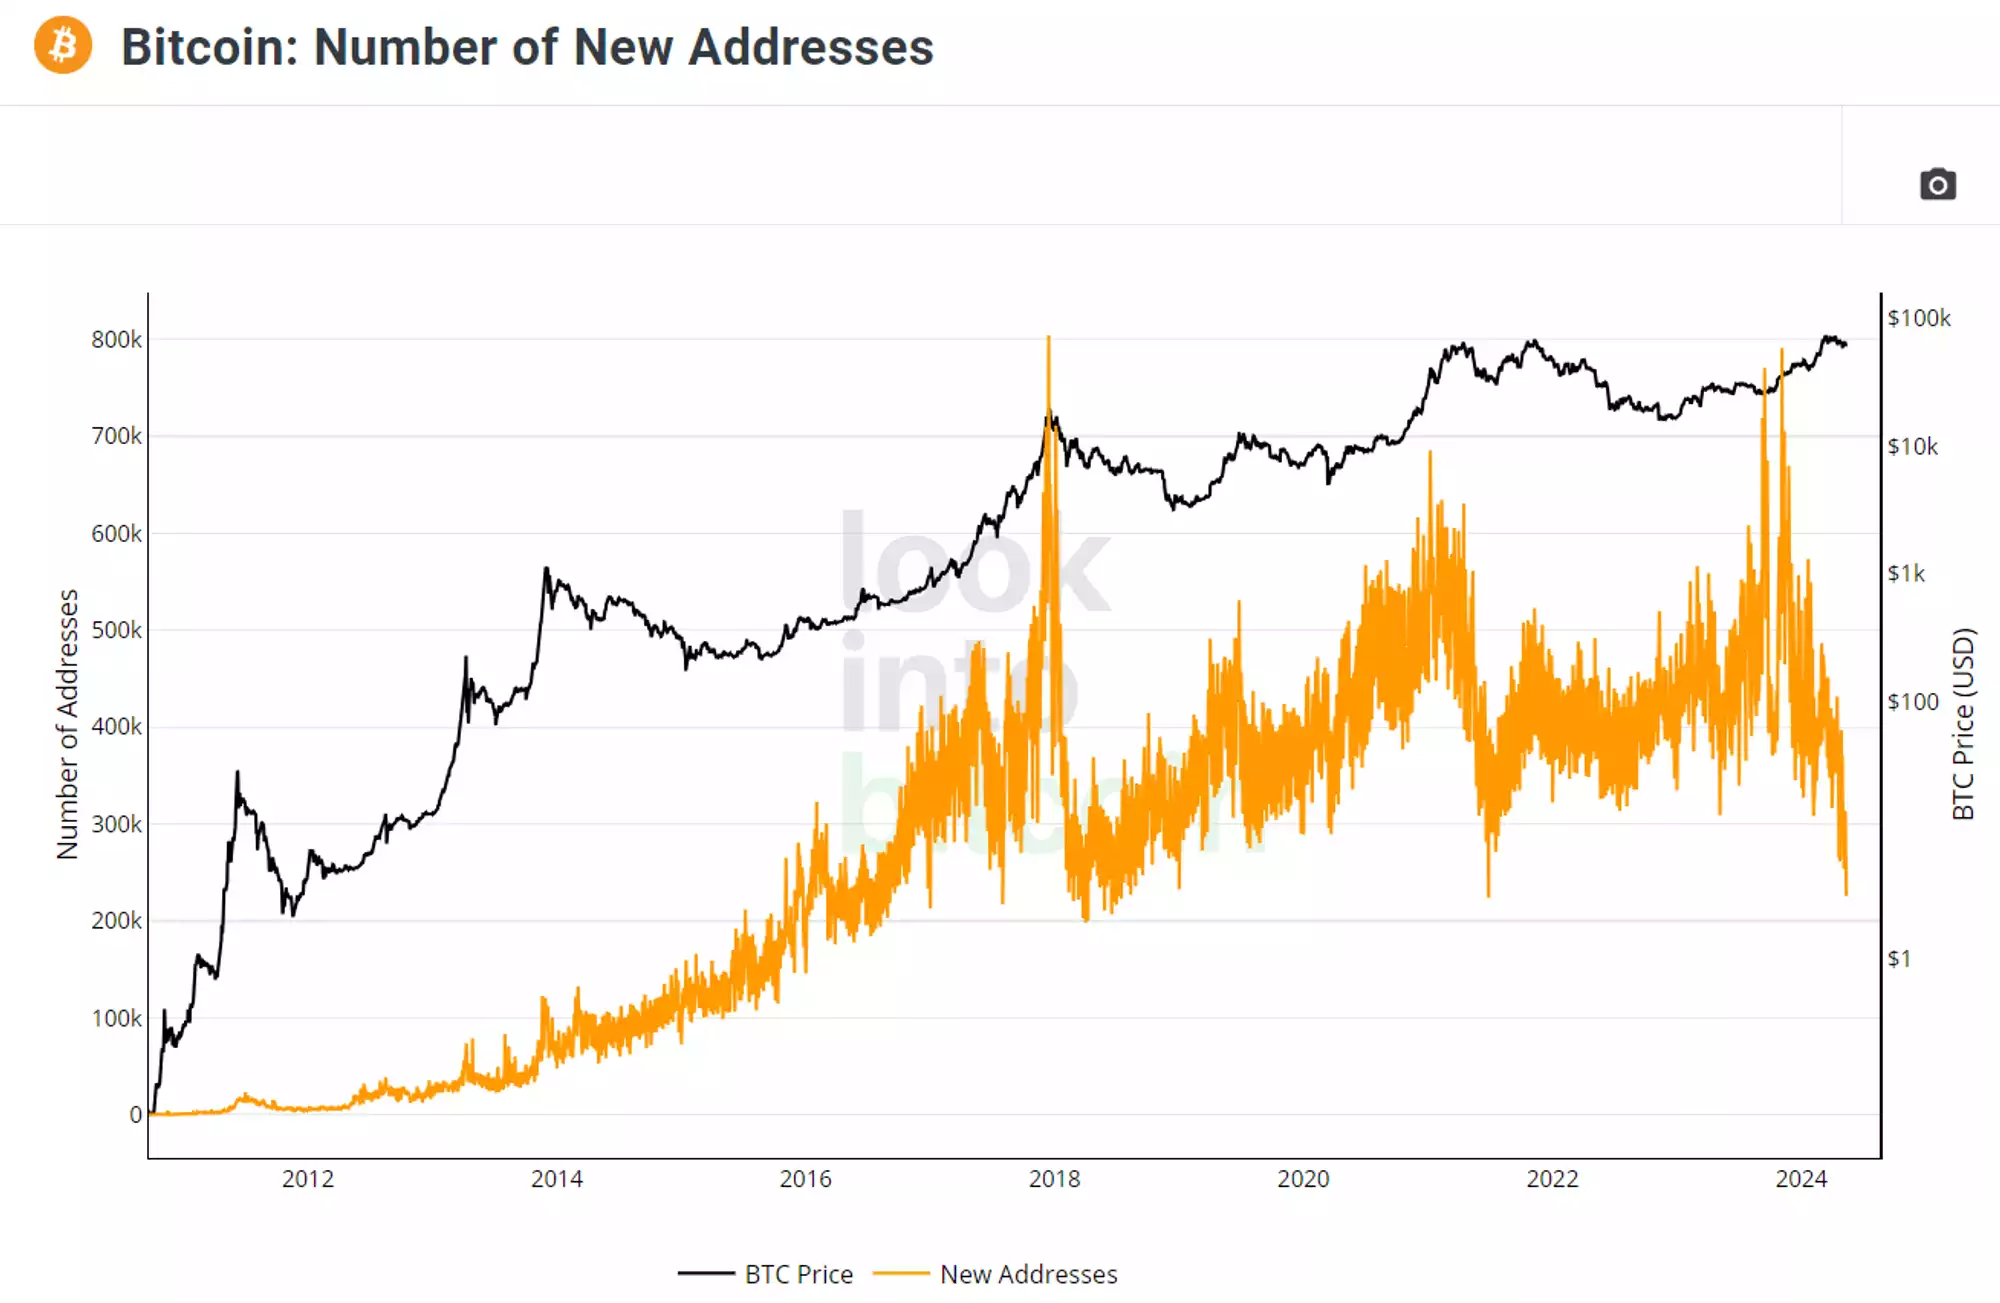
In the coming months, we should see a surge in new addresses as retail interest returns. There was a notable increase before the ETF launch, but it has since dropped off. The good news is that Bitcoin’s price has remained stable, demonstrating its strength. Historically, low address creation has been a strong entry point into the market, and we are seeing that opportunity today.
Market Sentiment
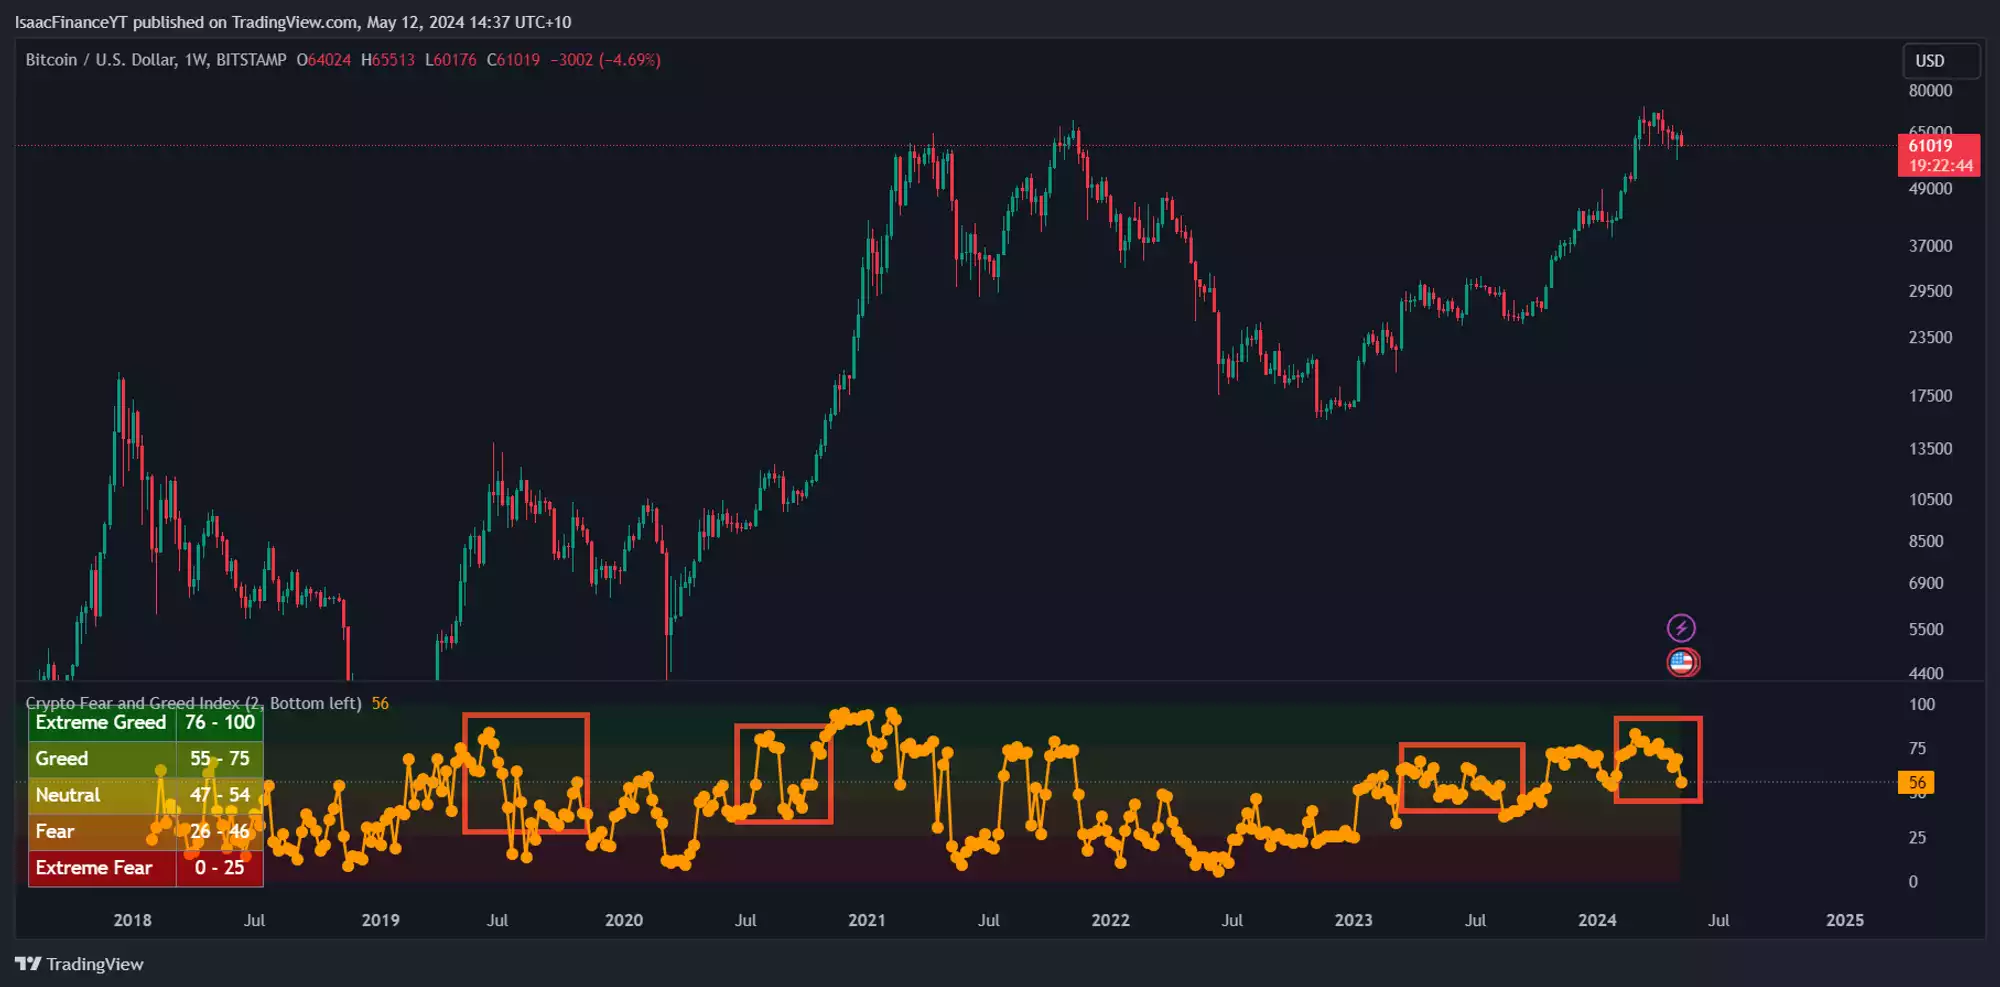
The macro sentiment has undergone a significant reset since the last Beyond the Block episode. This is a much-needed flush of weak hands, as excessive greed had set in at the highs. The red boxes in the chart illustrate that when the market becomes overly greedy, it almost always signals a bearish turn. With this reset, we are now in an excellent position to consolidate or trend higher, as sentiment has returned to a neutral level. This sentiment indicator will be crucial in timing the top of this cycle.
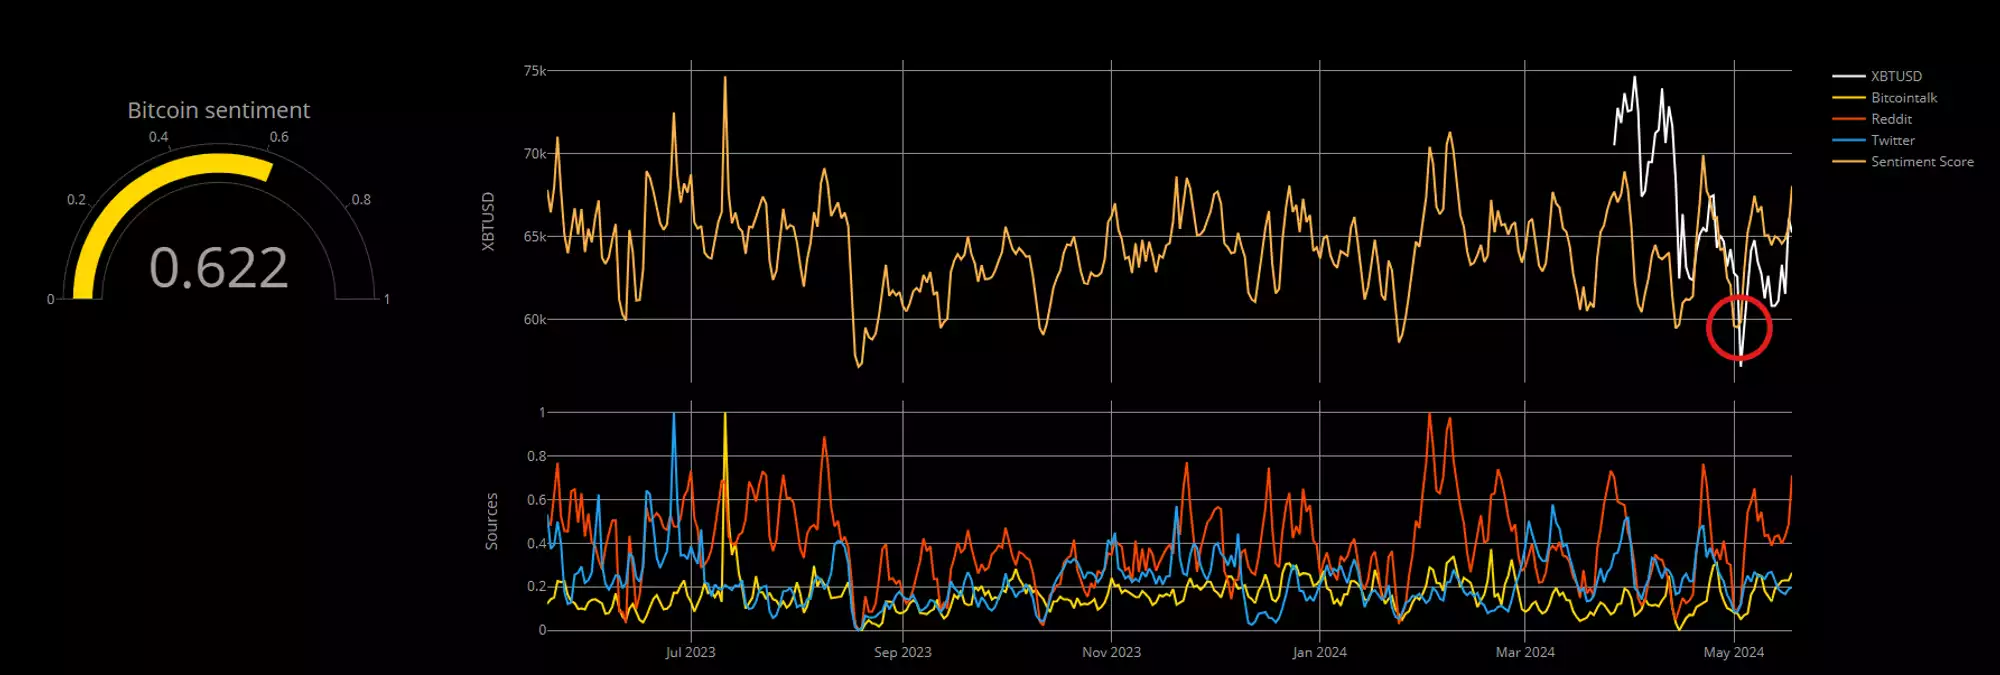
AI Short Term Sentiment Tracker:
In the short term, sentiment is currently neutral, as indicated by recent data from the low around 57k. This sentiment metric is highly effective at identifying local bottoms and tops because it tracks retail sentiment across crypto Twitter and other forums. By analysing discussions and sentiment trends within the crypto community, it provides valuable insights into market psychology. When sentiment is excessively optimistic, it often signals a local top, whereas excessively pessimistic sentiment can indicate a local bottom. Currently, the neutral stance suggests that the market is in a balanced state, neither overly bullish nor bearish, providing a stable environment for potential upward movements.
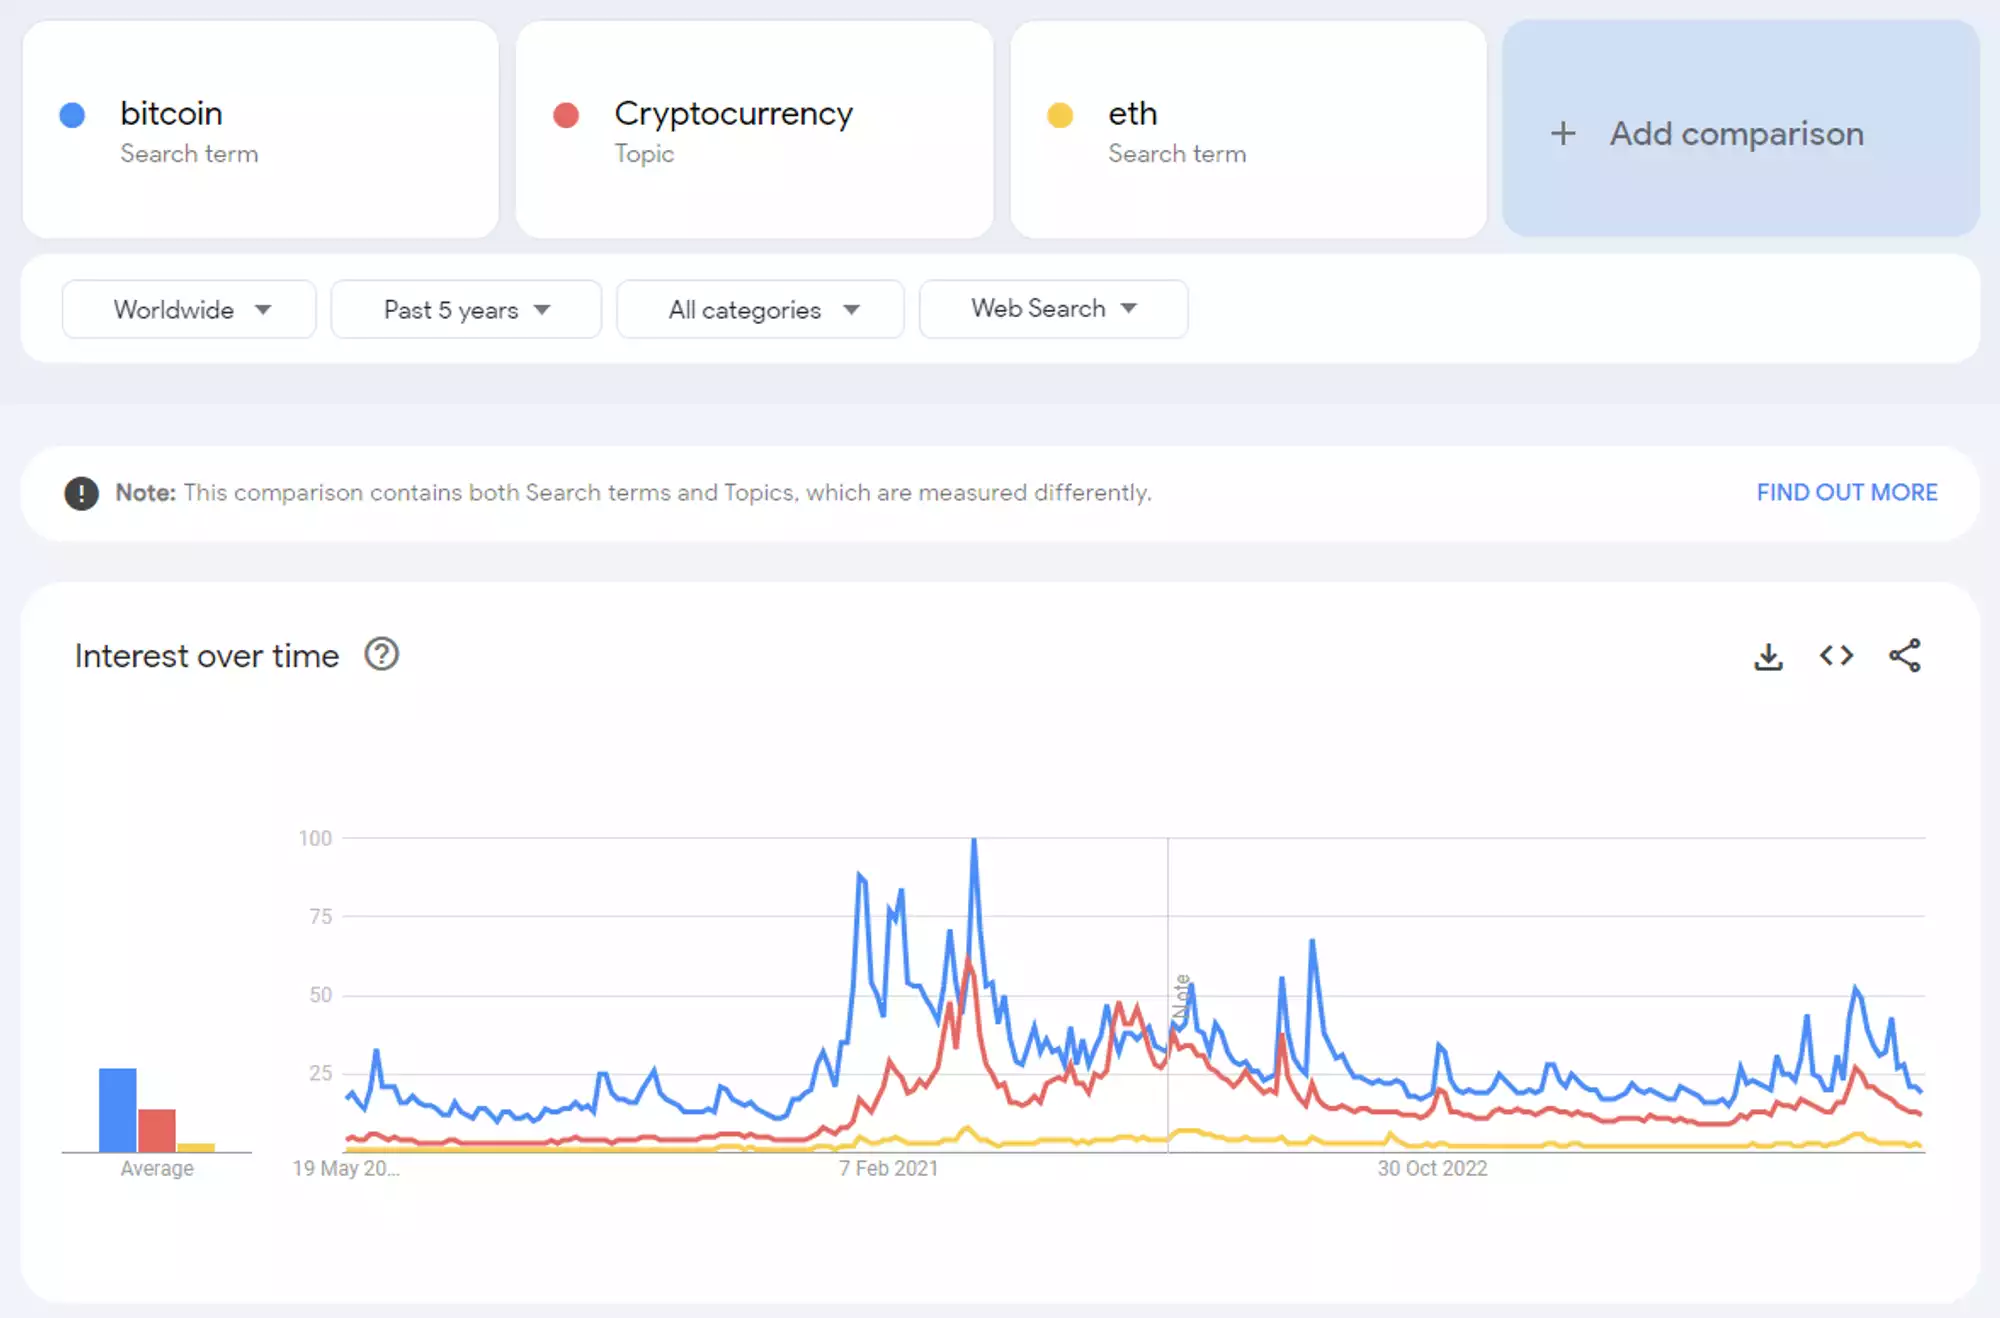
Shifting to Google Trends, we observe a clear decline in retail interest. While some may interpret this as a bearish signal, my analysis suggests it is actually bullish. Often, the best strategy is to go against the crowd, especially given our current position in the macro cycle. Leading up to the ETF launch and the halving, we saw a significant increase in interest, but it still hasn’t reached euphoric levels. The next catalyst to reignite retail interest is still uncertain, but it could be something as simple as a sustained series of green candles indicating upward price movement.
Technical Analysis
Cycles:
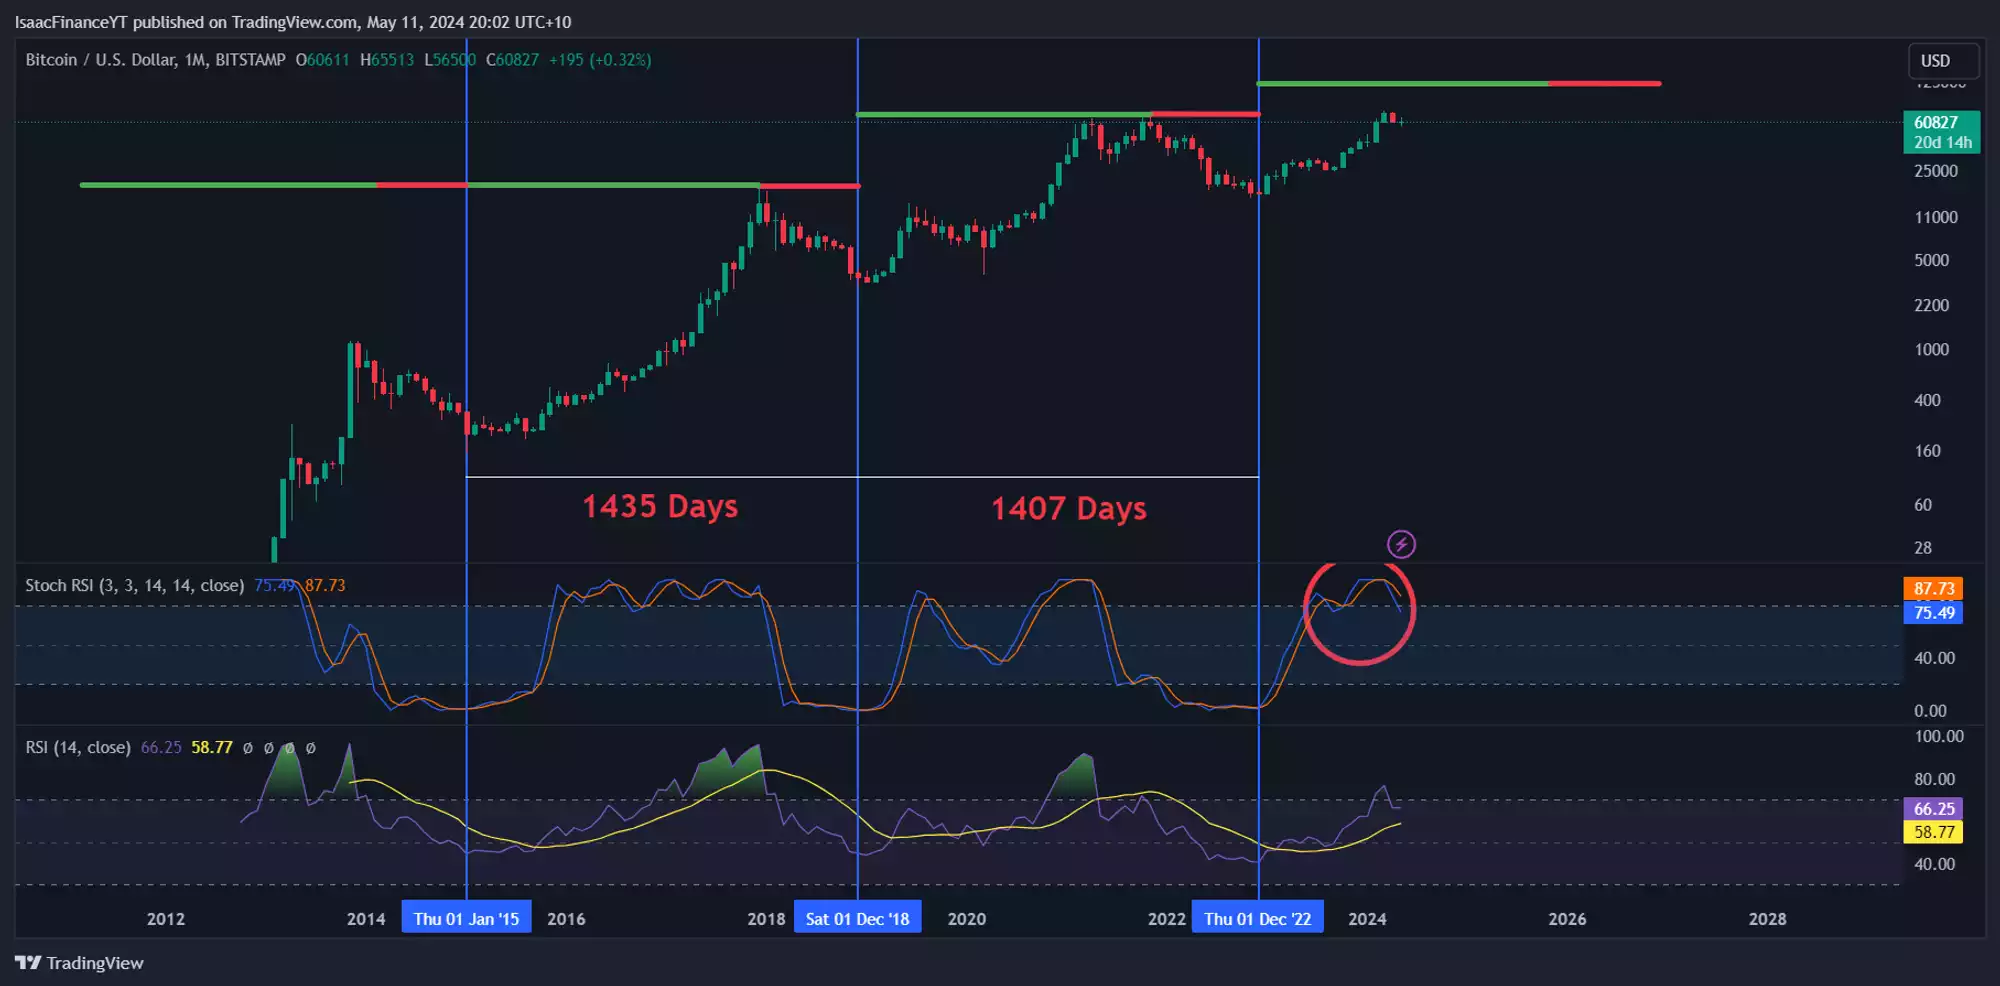
Regarding the Bitcoin cycle, we are currently about halfway through the standard bull market. The stochastic RSI indicates that momentum has shifted downward, which isn’t an ideal sign. However, the stochastic RSI can remain near the top for an extended period before the true market top is reached. Ideally, I would like to see the stochastic RSI flip bullish again, resembling the pattern seen in 2017. If the RSI continues to fall, it would not be favourable, as the price is likely to follow the downward trend.
Weekly:
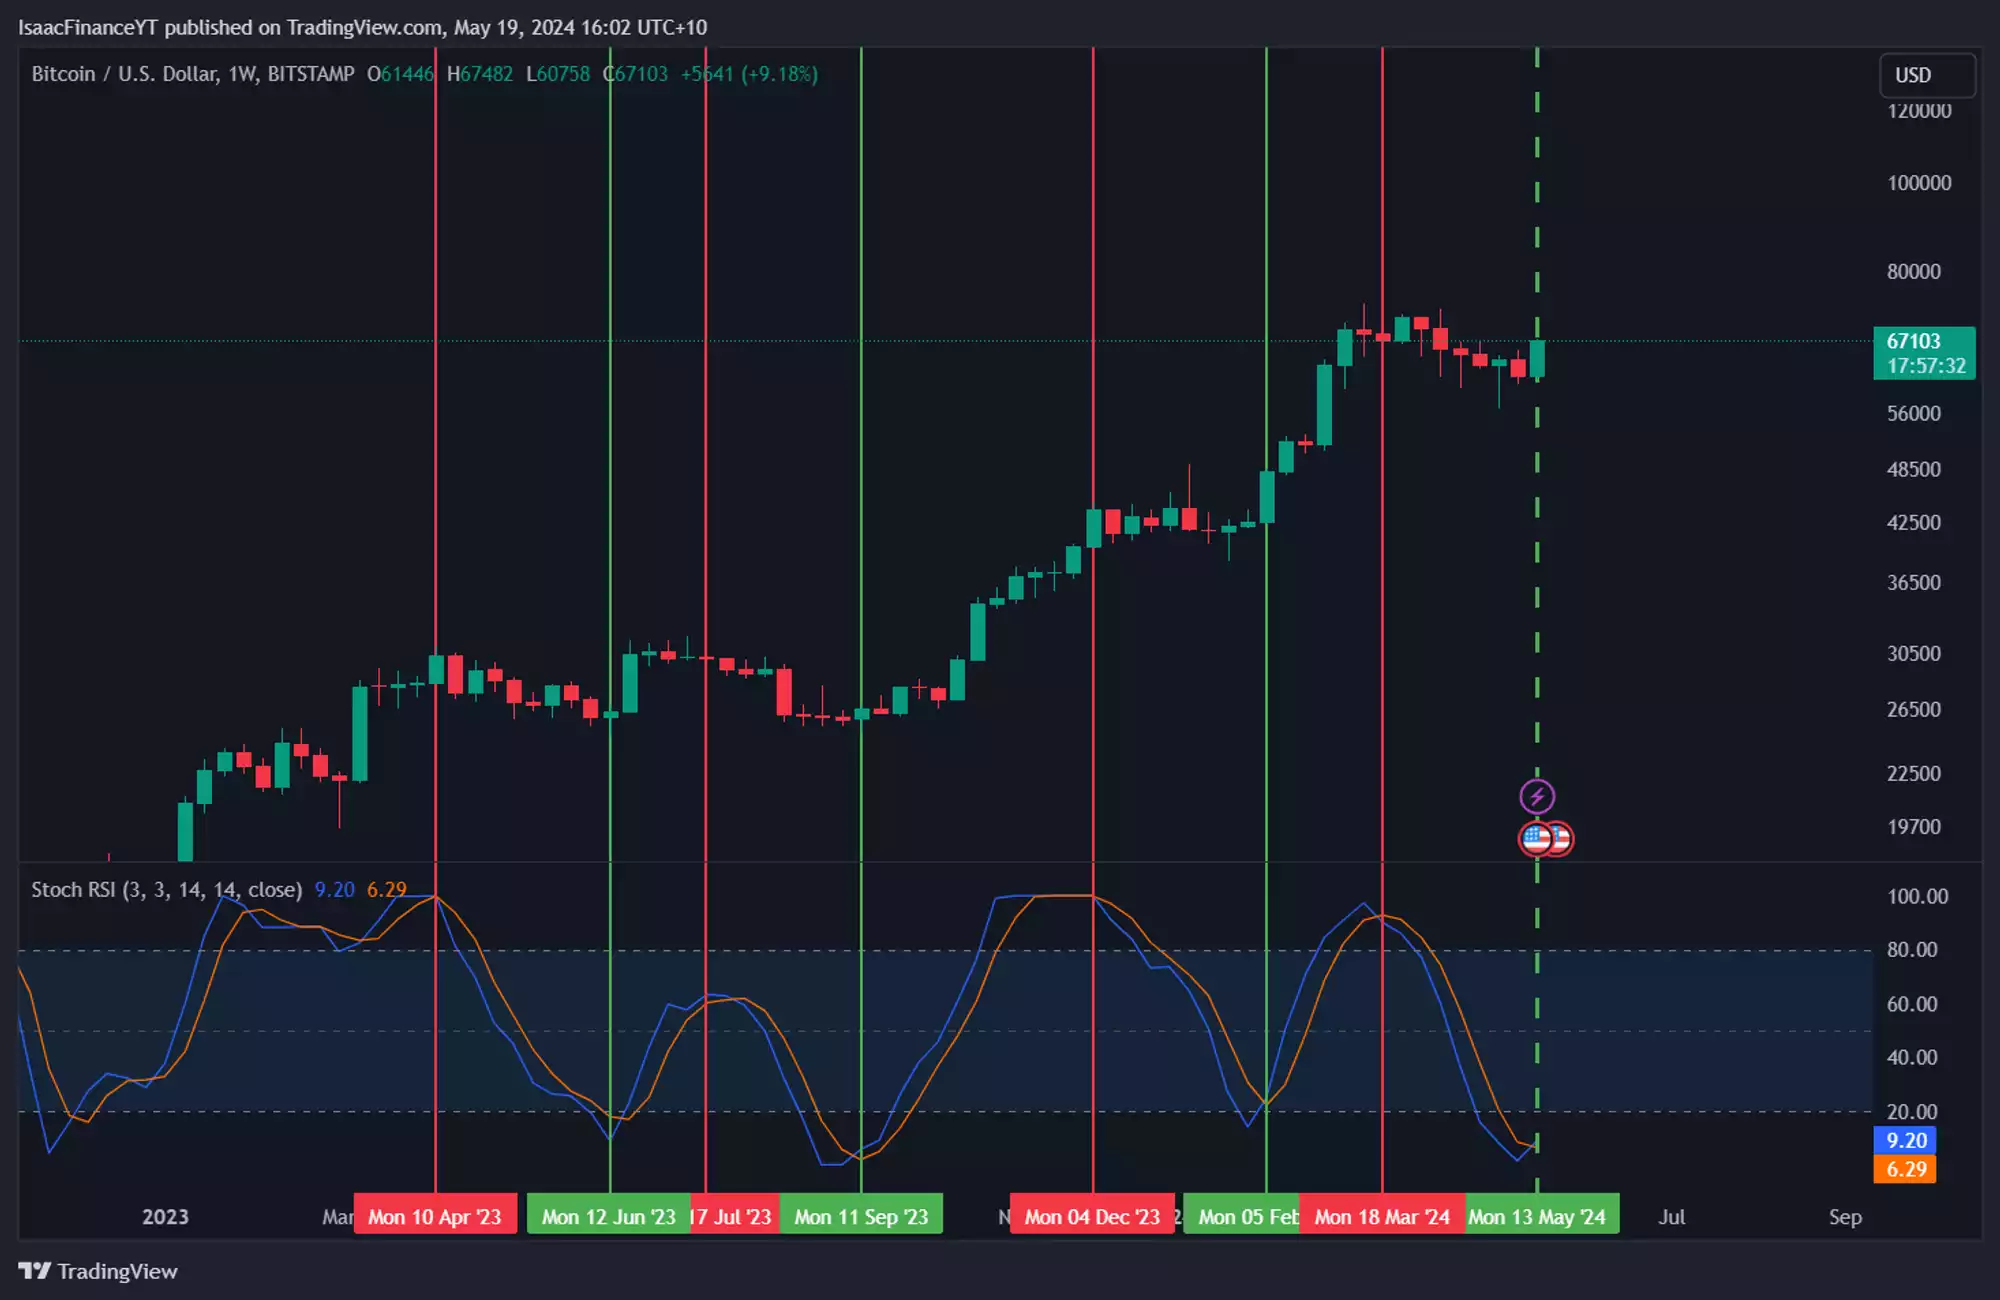
On the weekly timeframe, the stochastic indicator is rising. Since our last episode, it has surged to the 67k mark we discussed. With the momentum now turning bullish, we can expect further upside until a downside crossover occurs. Interestingly, this bullish reversal aligns with the 60-day cycle lows, which are covered in more detail later. This is positive news for Bitcoin, indicating that the bottom of this local downtrend is likely in.
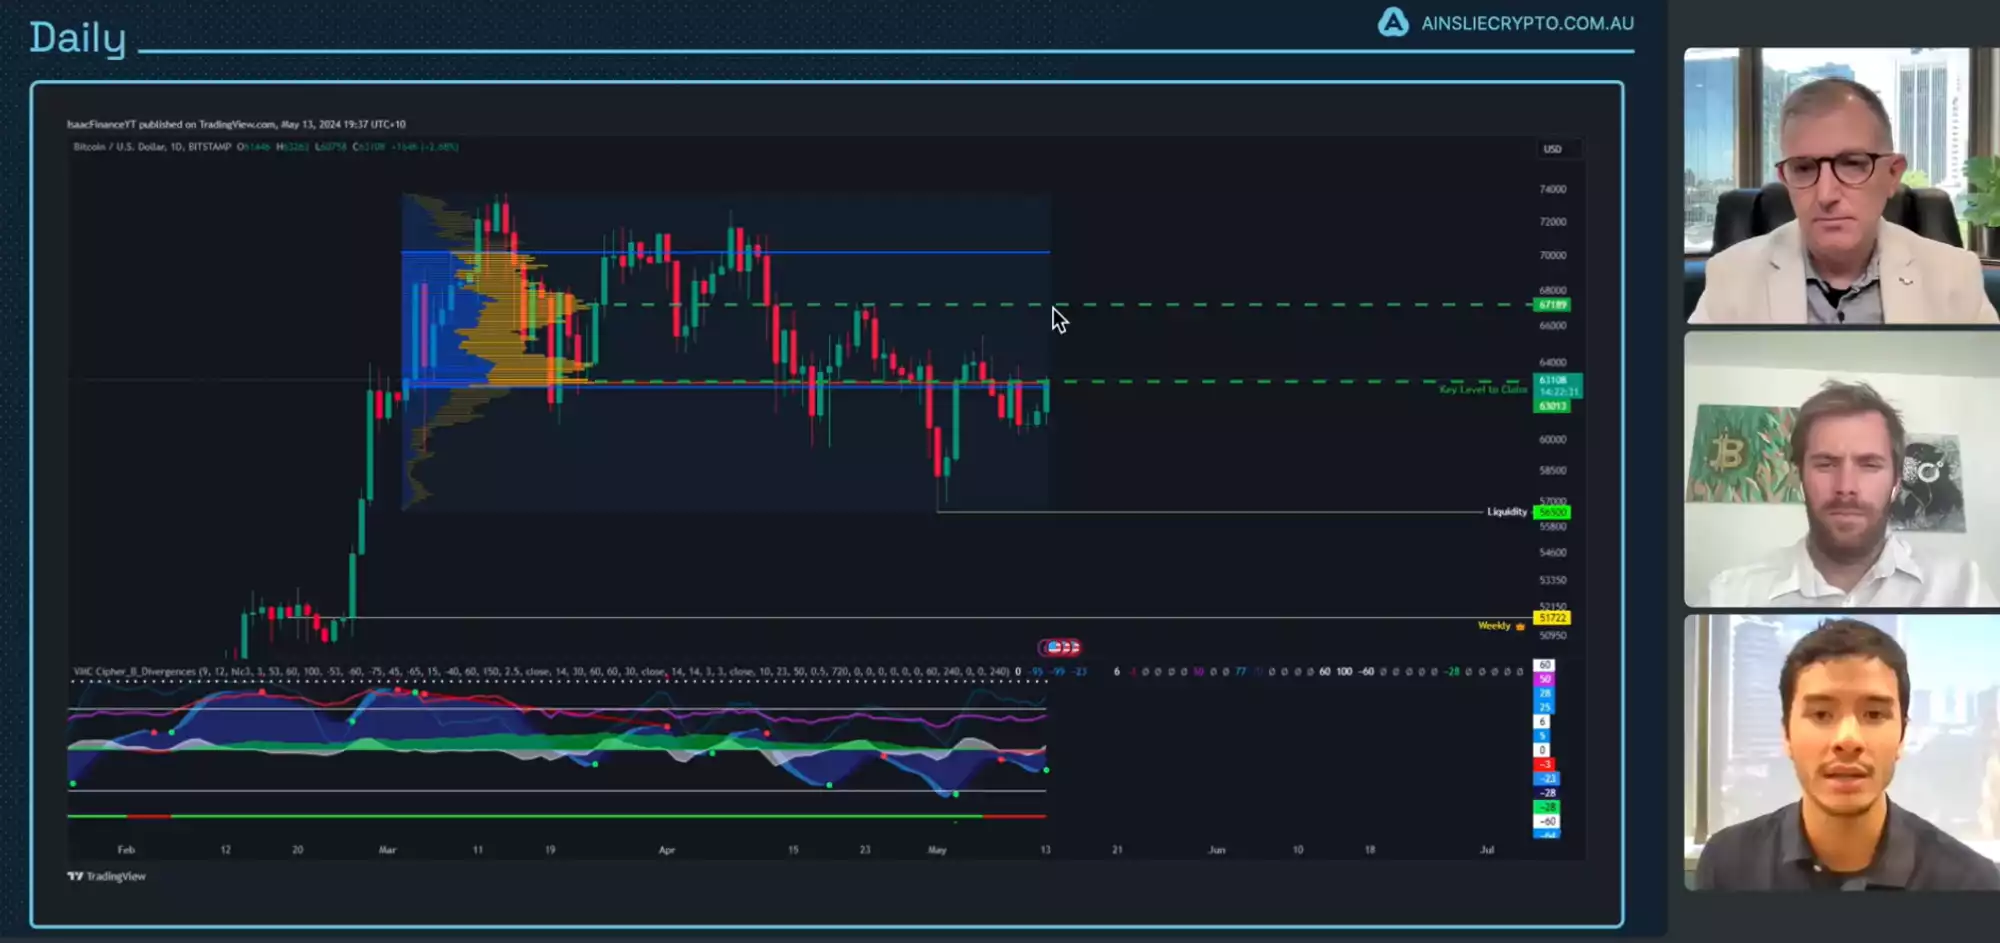
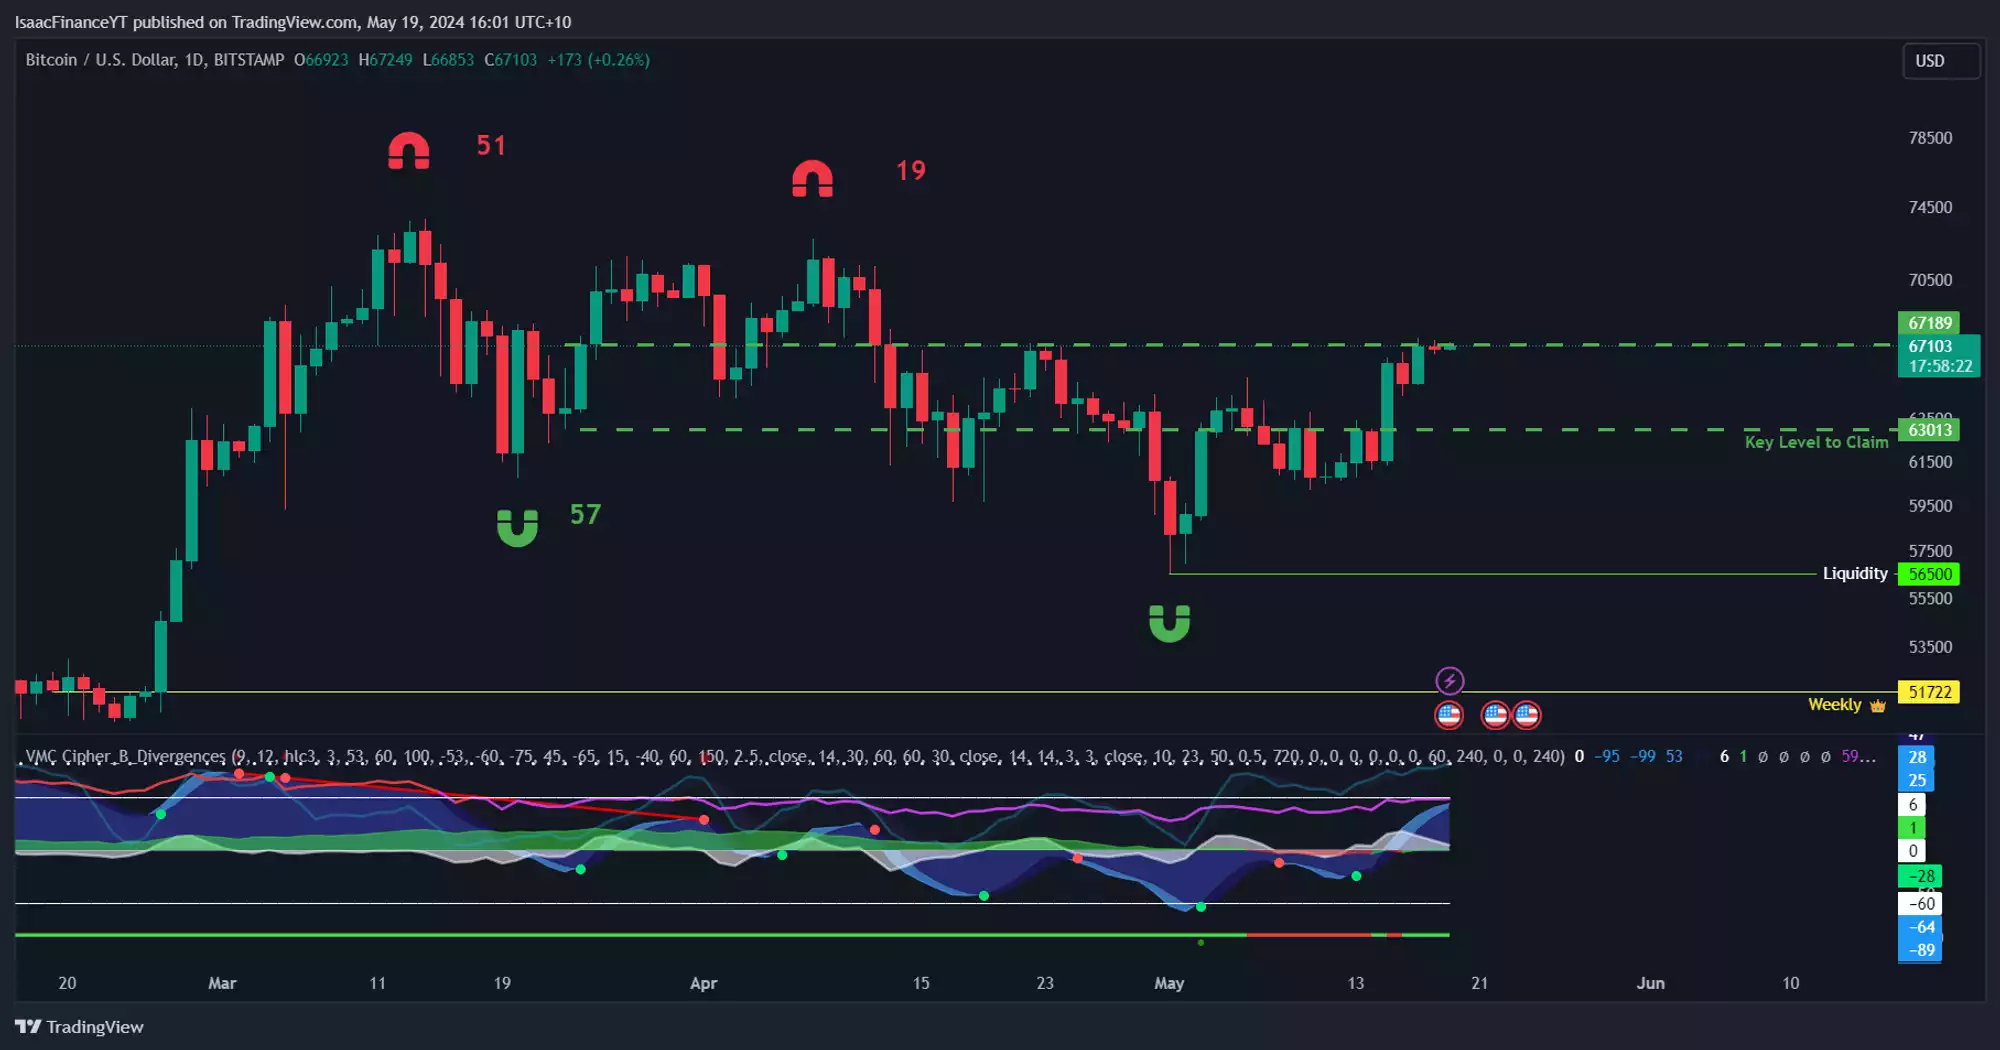
Switching to the daily timeframe, we discussed the head and shoulders pattern and its potential alignment with other metrics. Since then, we’ve seen a rise to the 67k region, which was my target. I anticipated this level as a take-profit zone for traders. Additionally, a high-volume node in the same area reinforced my conviction that the price would pause temporarily. This movement occurred against the backdrop of a rising stochastic indicator, supporting my bullish outlook. I’m still expecting higher prices locally as many metrics are flipping bullish.
Daily Cycles:
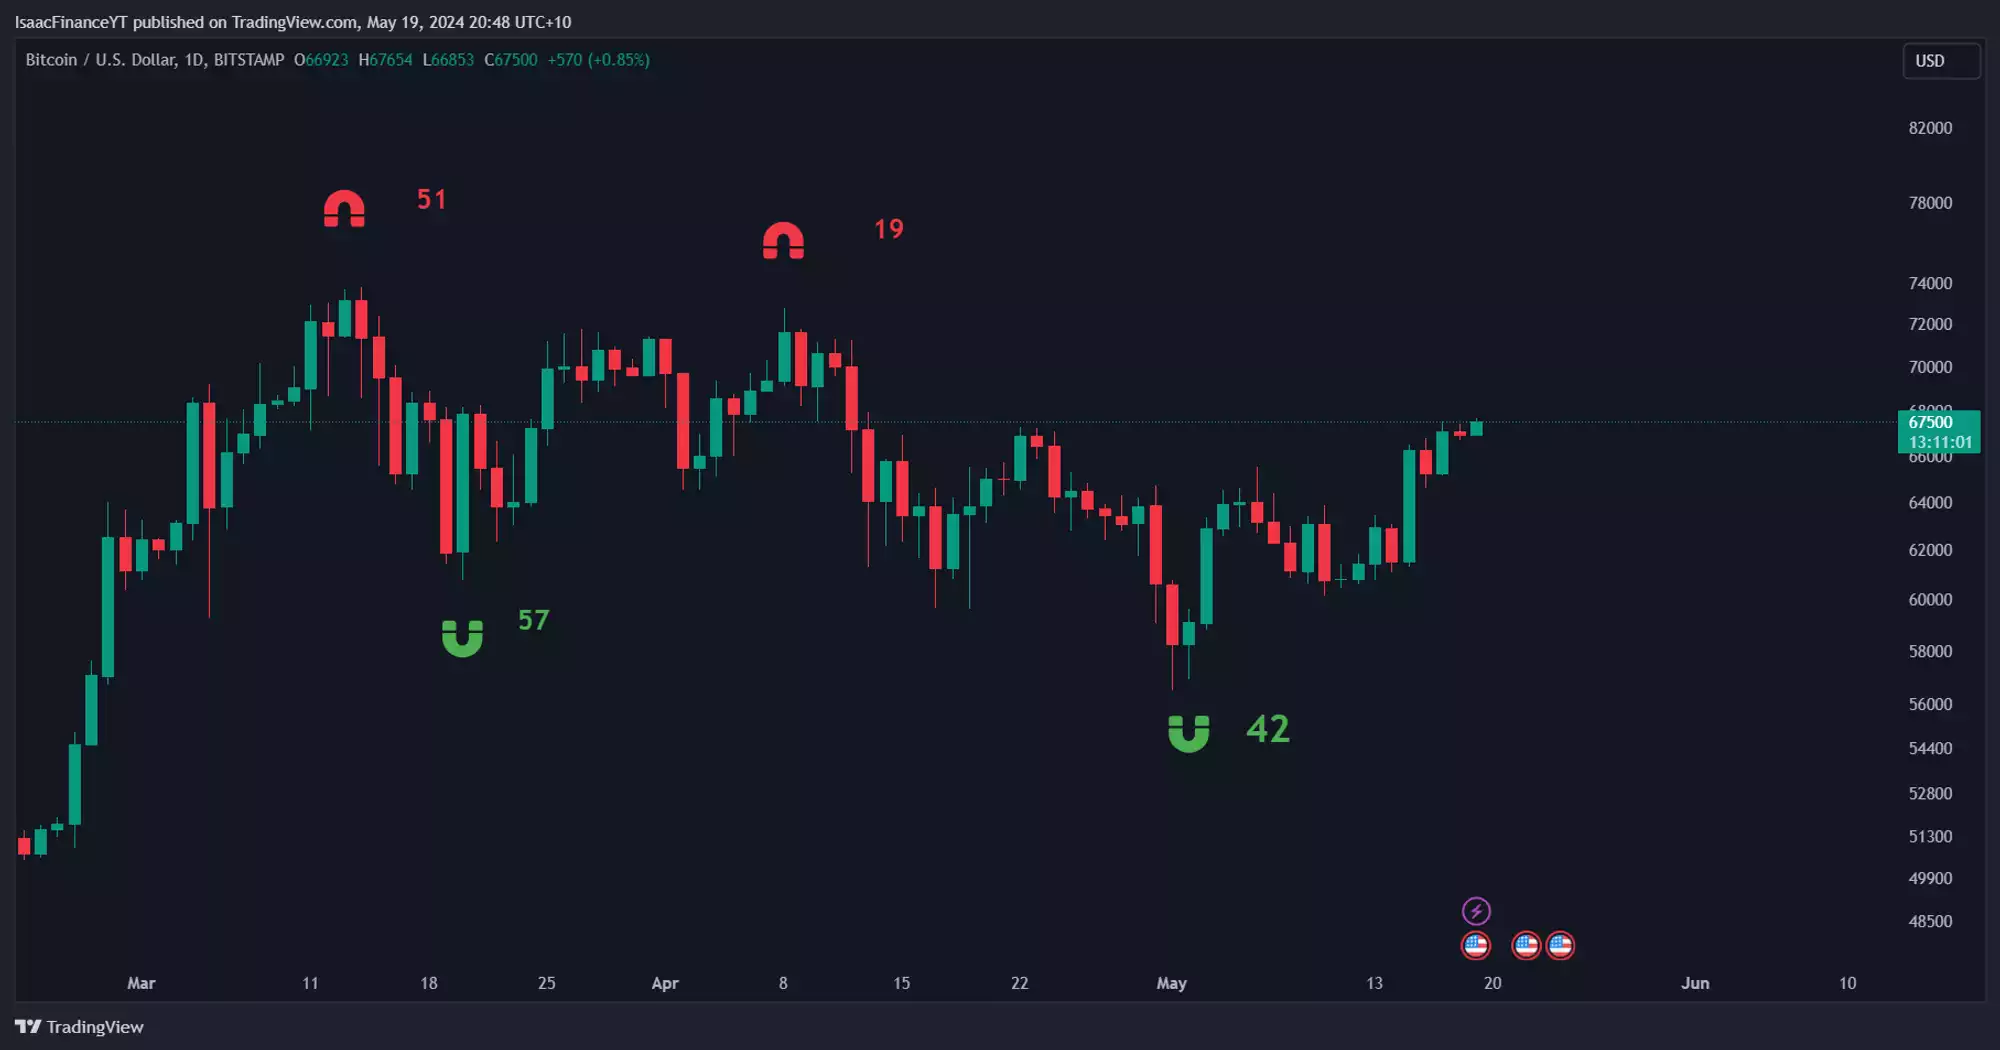
Regarding the 60-day cycle, I believe we experienced a shorter cycle of 42 days since the last daily cycle low. We discussed this possibility, and now it seems most likely. It’s too early to predict where this cycle will peak, so I’ll wait for more data before making that analysis. For now, with the cycle low most likely established, I expect continued bullish price action, regardless of whether we surpass the all-time high.
Liquidity Levels:
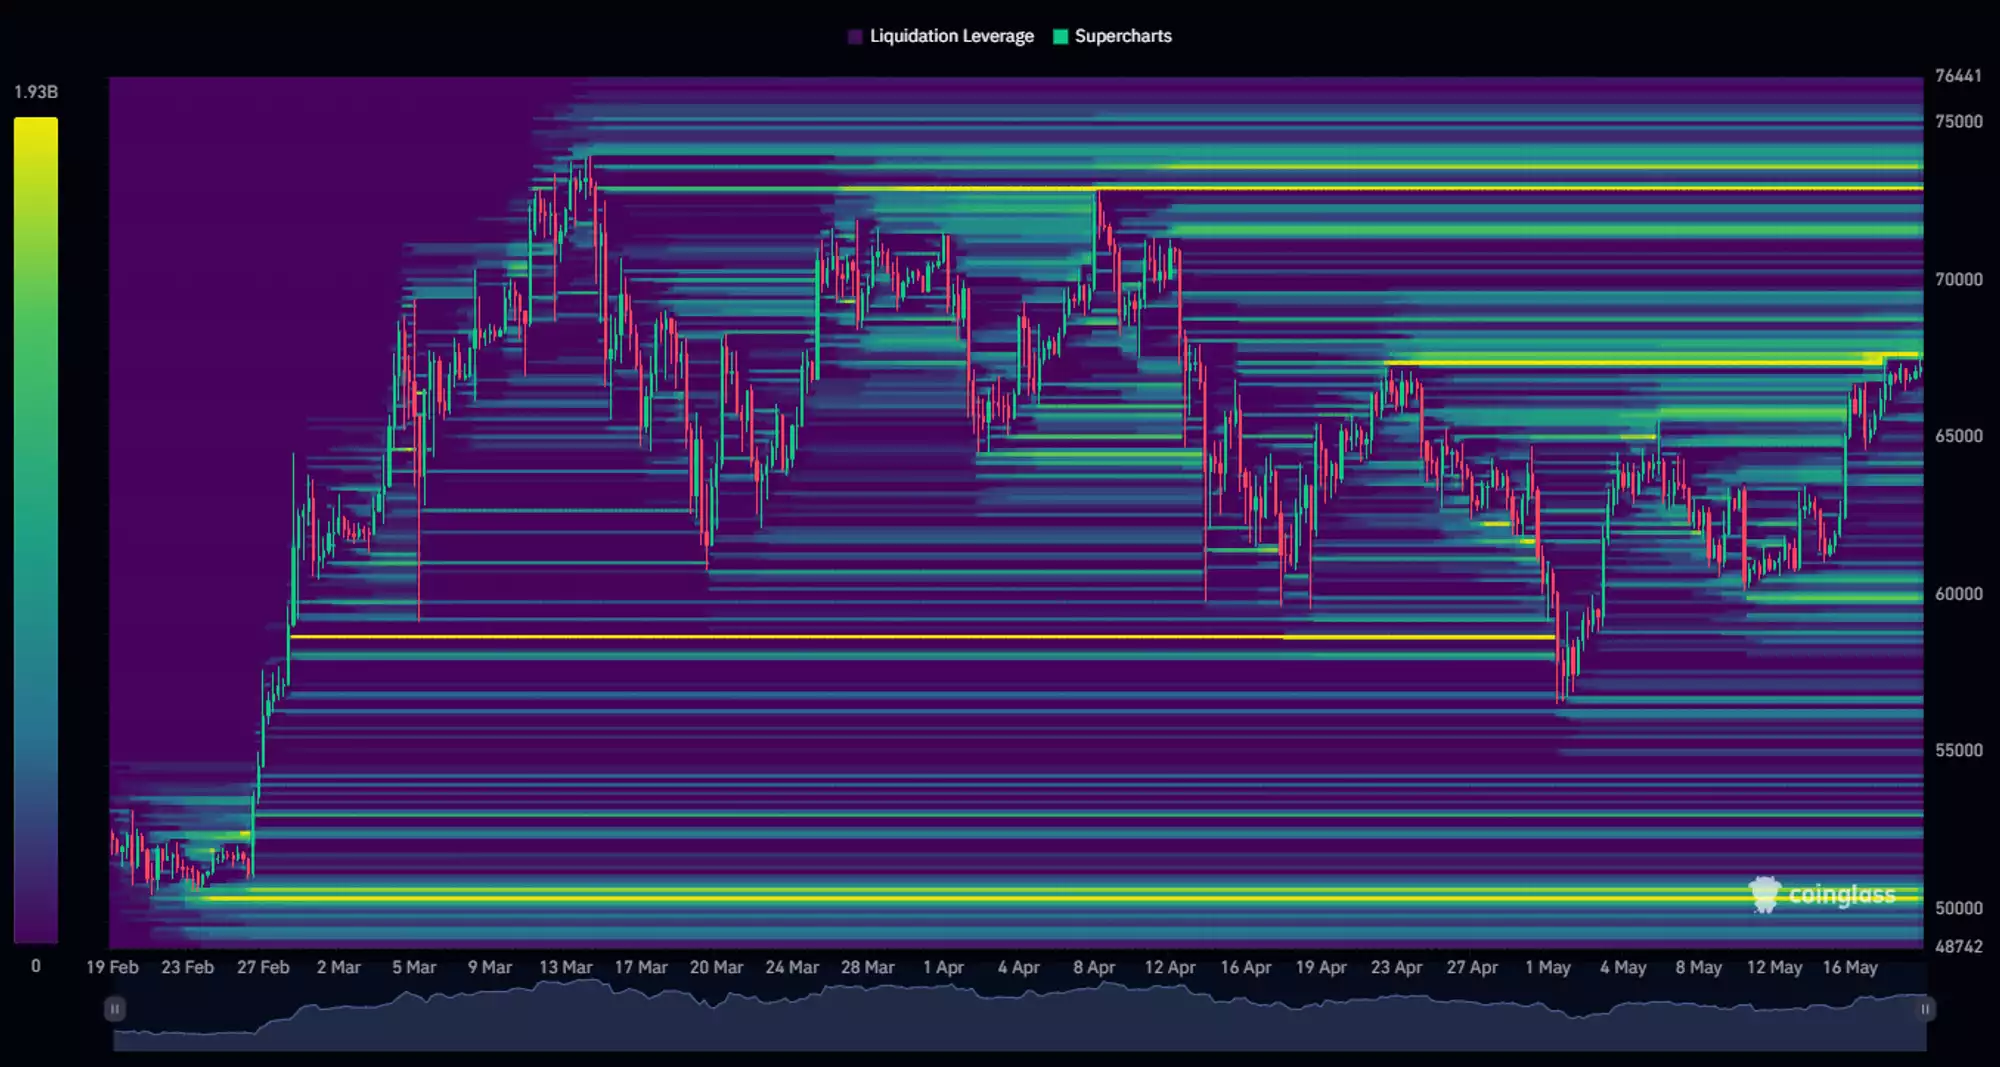
Regarding liquidity regions, the 67k level has been cleared, which was a key target for several reasons discussed in this report. Looking ahead to the next region, we see significant liquidity above the candle highs around 72k. This area acts as a magnet for price, potentially driving it higher in the short term. On the downside, the only notable level is around 52k, which has been frequently mentioned. However, based on the metrics we’ve analysed, it seems unlikely that the price will reach those lower levels.
Cumulative Volume Delta:
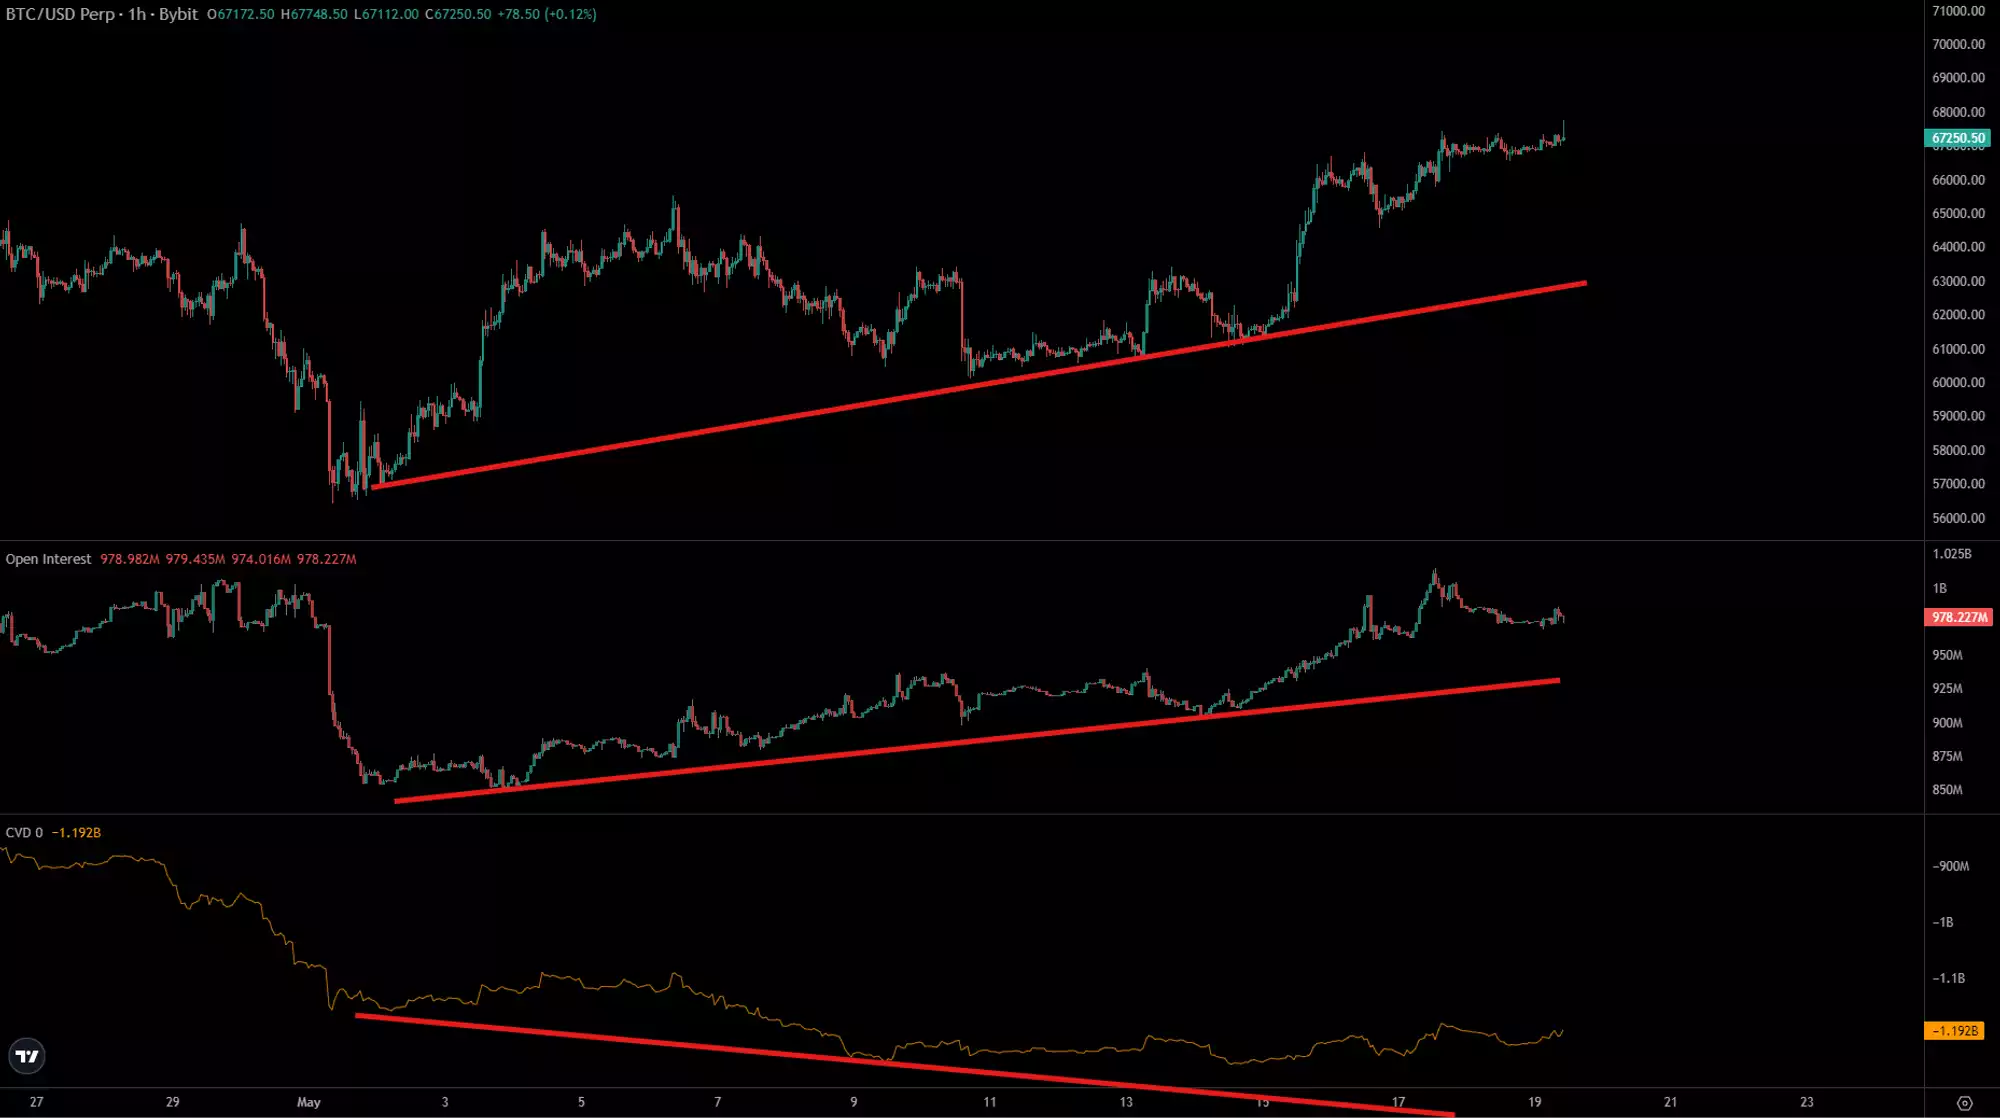
Regarding the CVD (Cumulative Volume Delta), there is a slight bullish divergence visible on the 1-hour chart. I’m not giving it too much weight as there isn’t enough data to draw a definitive conclusion. However, it is worth noting. This divergence does align with other metrics that would suggest a more bullish period in the short term.
Conclusion
In conclusion, Bitcoin’s market analysis indicates a mix of consolidation and potential upward movement. The MVRV Z-Score shows a significant reset, suggesting an undervalued market ripe for growth. Sentiment indicators, including macro sentiment and retail interest, point to a neutral stance, setting the stage for stability and potential gains. Key technical indicators like the Pi Cycle and stochastic RSI show bullish potential despite short-term fluctuations. Liquidity levels and CVD divergences support this outlook. Overall, with new retail interest anticipated and stable market metrics, Bitcoin is well-positioned for continued growth, potentially reaching new highs as the bull market progresses.
Watch the most recent video presentation of Bitcoin Analysis: Beyond the Block where I share some of these explanations in a panel format, and join the discussion on our YouTube Channel here.
I will return with more detailed analysis of everything Bitcoin next month, including more market analysis, on-chain metrics, sentiment, and technical analysis…
Isaac Ho | Independent Research Analyst
The Ainslie Group
x.com/IsaacsDevCorner
Share this Article:
Crypto in your SMSF
Top Movers
Get Started Trading Crypto with Ainslie.
Join Thousands of satisfied customers who trust Ainslie for their cryptocurrency and bullion needs.


